
Houses for sale in Enfield London Borough, England
House Prices in Enfield London Borough
Properties in Enfield London Borough have
an average house price of
£515k
and had 8,924 Property Transactions
within the last 3 years.¹
Enfield London Borough is a location in
England with
121,632 households², where the most expensive property was sold for £7.51M.
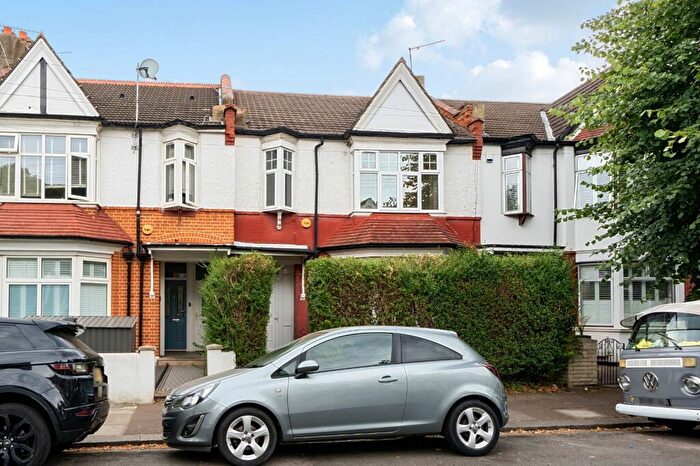
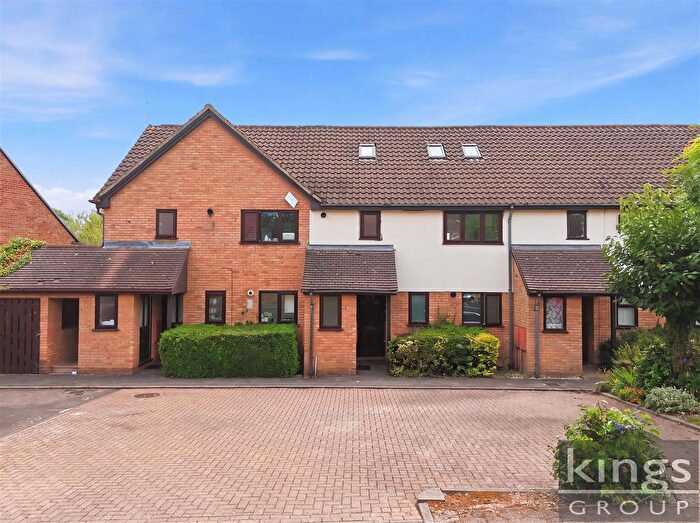
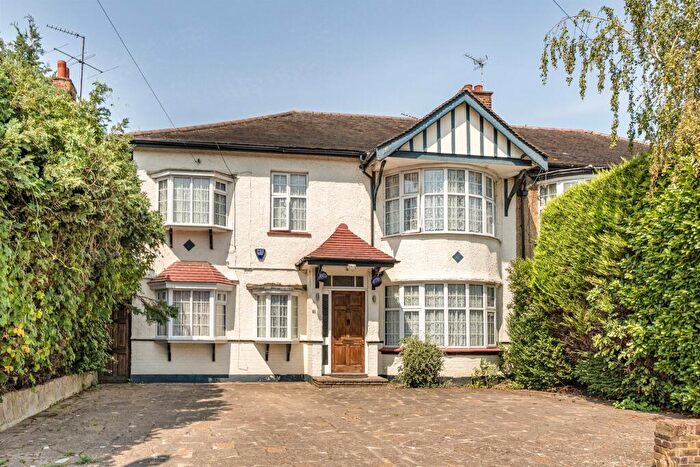
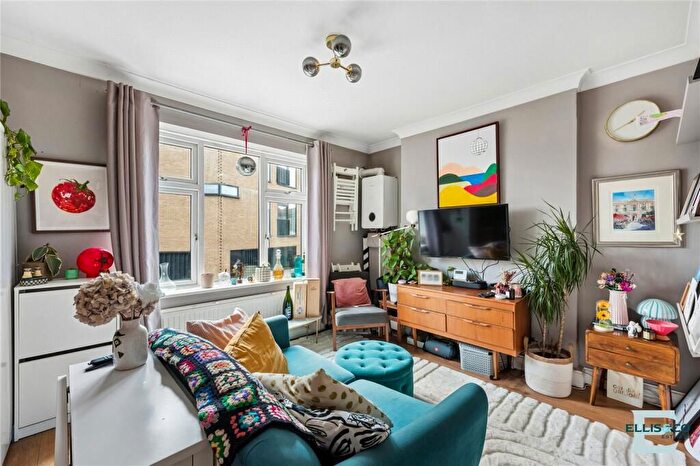
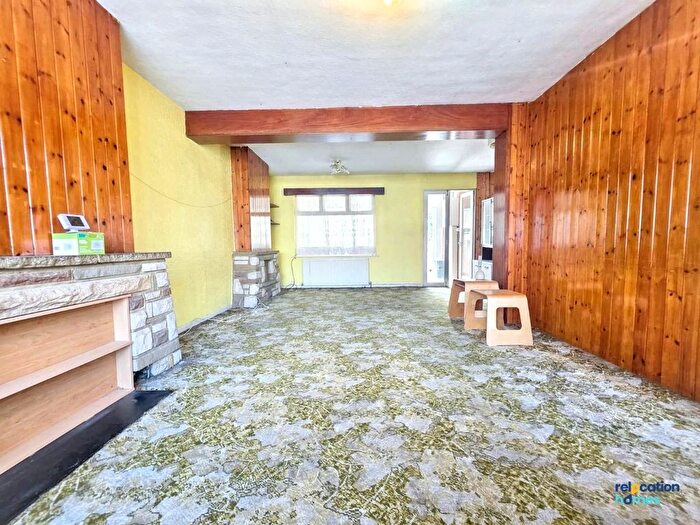
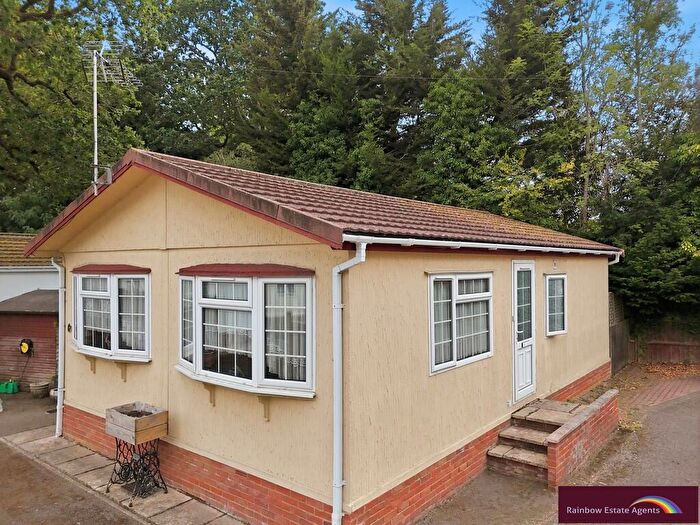
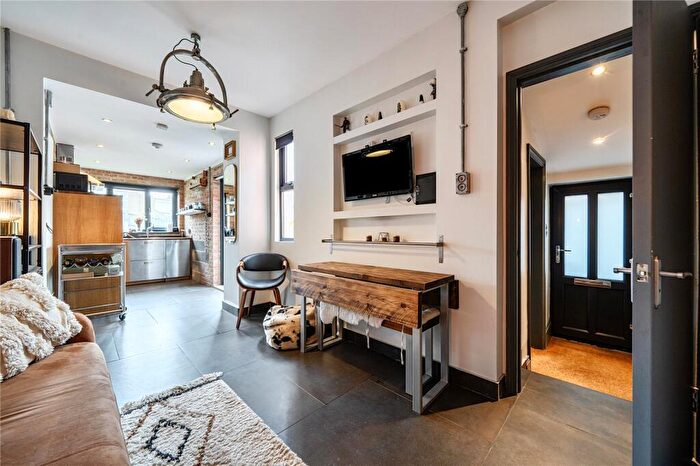
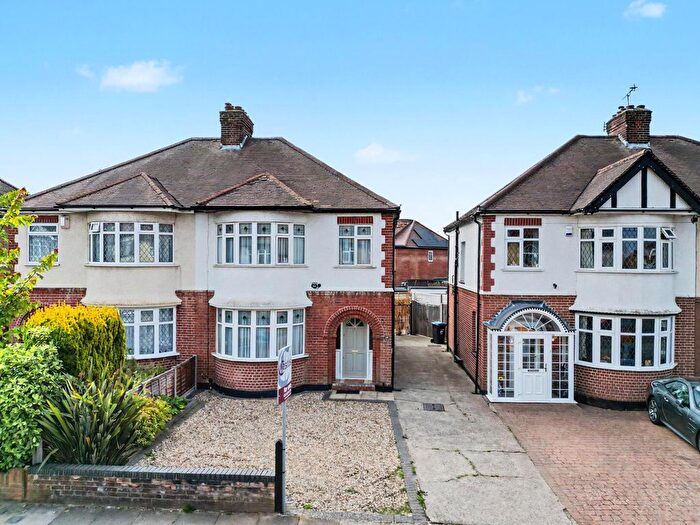
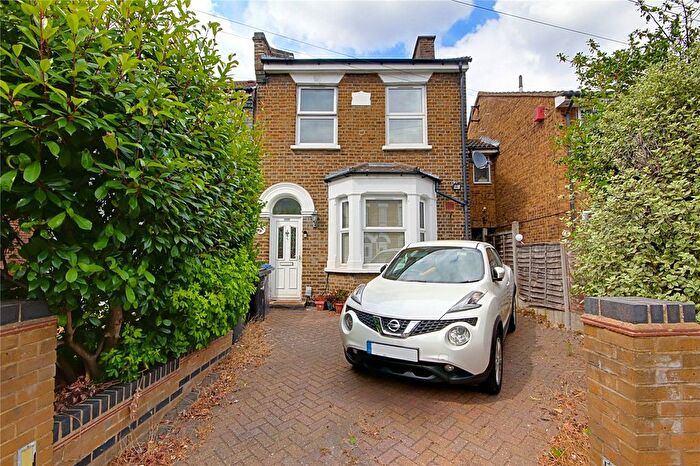
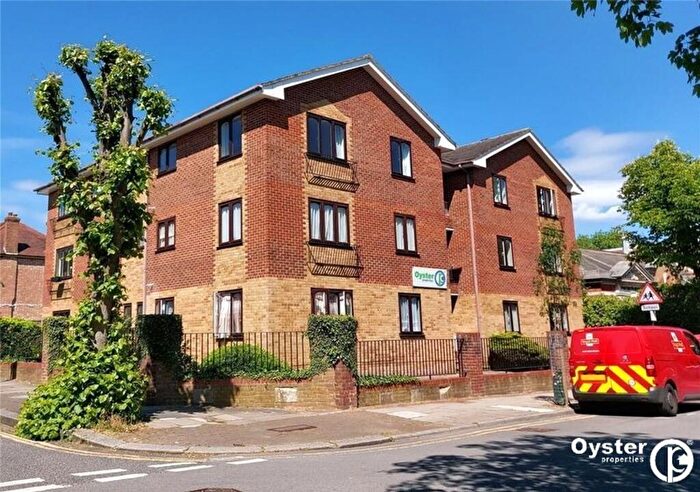
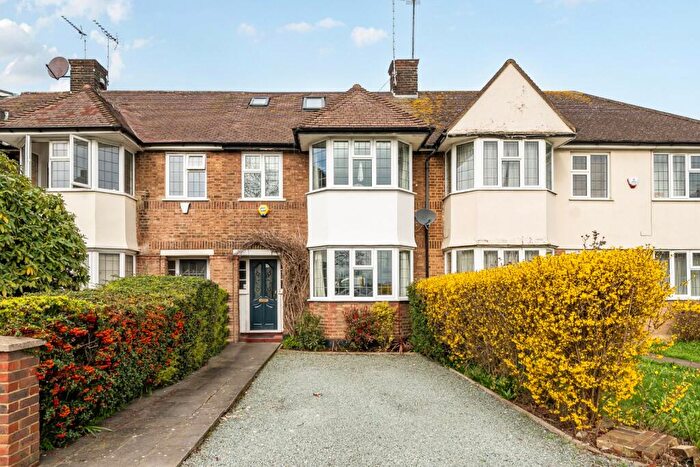
Properties for sale in Enfield London Borough
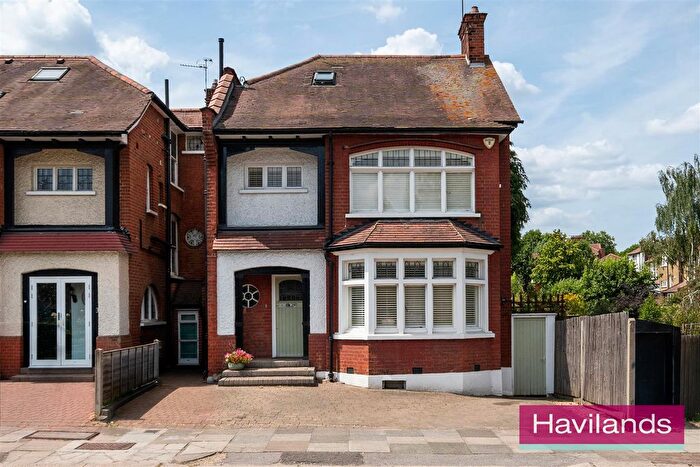
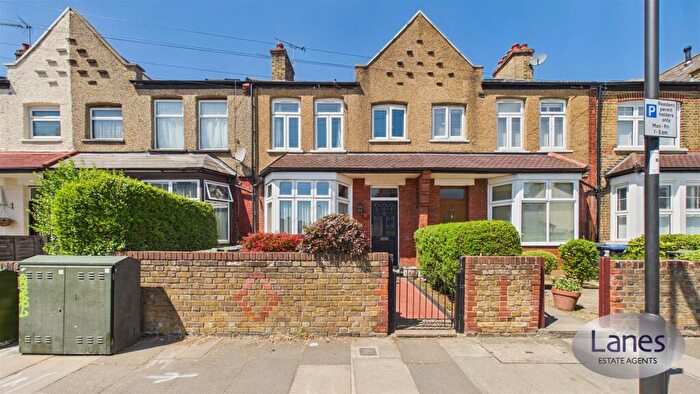
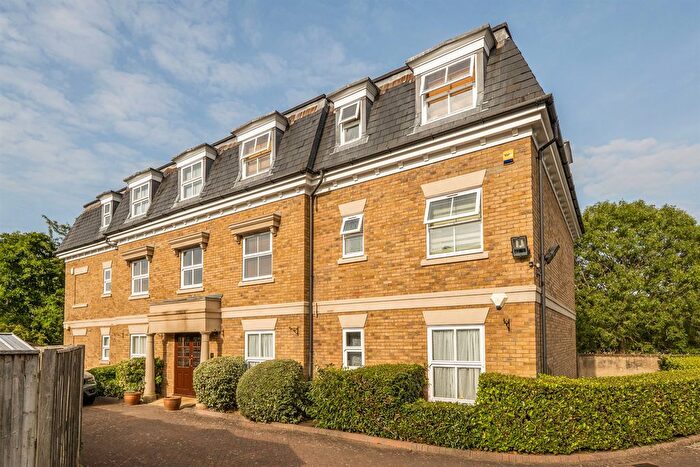
![]()
If you are looking to sell your house, let it out, or receive a property valuation, an expert can help you.
Click the button below to get started.

Towns in Enfield London Borough
Navigate through our locations to find the location of your next house in Enfield, England for sale or to rent.
Property price trends in Enfield London Borough
According to the latest Land Registry data, the average home in Enfield London Borough sold for £467,413 in 2026. That figure comes from a substantial record of 137,777 sales logged over the past 31 years.
Prices have fallen back over the last three years. Compared with 2023, when the typical sale came in around £512,165, that's a fall of roughly 8.7%.
Looking back five years, average prices are down about 5.8% since 2021, a drop of around £28,771 in cash terms.
Zoom out to the past decade for the fuller picture. Back in 2016, homes here averaged £434,413, so the typical sold price has climbed about 7.6% since then, roughly 0.7% a year. Stretch the view to fifteen years and that annual pace edges up closer to 3.3%.
Frequently asked questions about Enfield London Borough
What is the average price for a property for sale in Enfield London Borough?
The average price for a property for sale in Enfield London Borough is £514,996. This amount is 43% higher than the average price in England. There are more than 10,000 property listings for sale in Enfield London Borough.
What locations have the most expensive properties for sale in Enfield London Borough?
The locations with the most expensive properties for sale in Enfield London Borough are Barnet at an average of £1,270,420 and London at an average of £533,063.
What locations have the most affordable properties for sale in Enfield London Borough?
The locations with the most affordable properties for sale in Enfield London Borough are Waltham Cross at an average of £424,669 and Enfield at an average of £461,109.
Which train stations are available in or near Enfield London Borough?
Some of the train stations available in or near Enfield London Borough are Bush Hill Park, Grange Park and Enfield Town.
Property Price Paid in Enfield London Borough by Year
The average sold property price by year was:
| Year | Average Sold Price | Price Change |
Sold Properties
|
|---|---|---|---|
| 2026 | £467,413 | -11% |
470 Properties |
| 2025 | £517,018 | -1% |
3,038 Properties |
| 2024 | £523,180 | 2% |
2,865 Properties |
| 2023 | £512,165 | -3% |
2,551 Properties |
| 2022 | £527,429 | 6% |
3,400 Properties |
| 2021 | £496,184 | 5% |
4,412 Properties |
| 2020 | £471,344 | 3% |
2,664 Properties |
| 2019 | £456,708 | 2% |
3,052 Properties |
| 2018 | £449,328 | -1% |
2,958 Properties |
| 2017 | £451,771 | 4% |
3,223 Properties |
Property Price per Property Type in Enfield London Borough
Here you can find historic sold price data in order to help with your property search.
The average Property Paid Price for specific property types in the last three years are:
| Property Type | Average Sold Price | Sold Properties |
|---|---|---|
| Semi Detached House | £695,061.00 | 1,744 Semi Detached Houses |
| Terraced House | £500,171.00 | 3,733 Terraced Houses |
| Detached House | £1,213,725.00 | 451 Detached Houses |
| Flat | £323,469.00 | 2,996 Flats |
Transport in Enfield London Borough
Please see below transportation links in this area:

