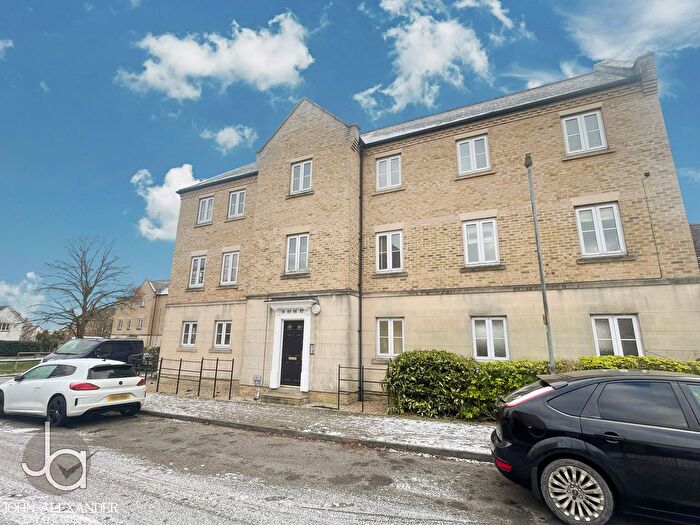
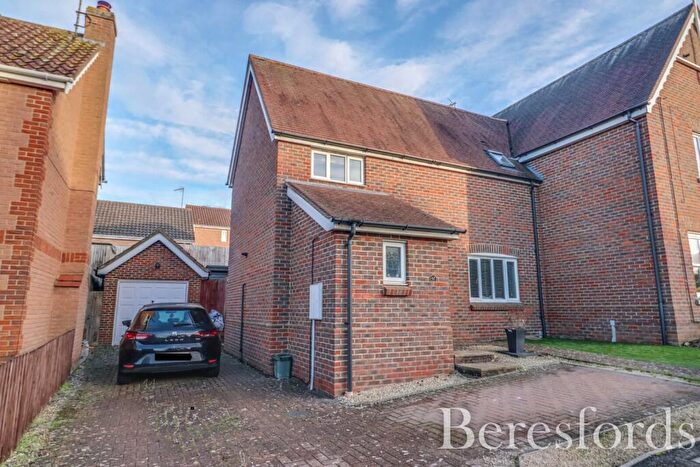
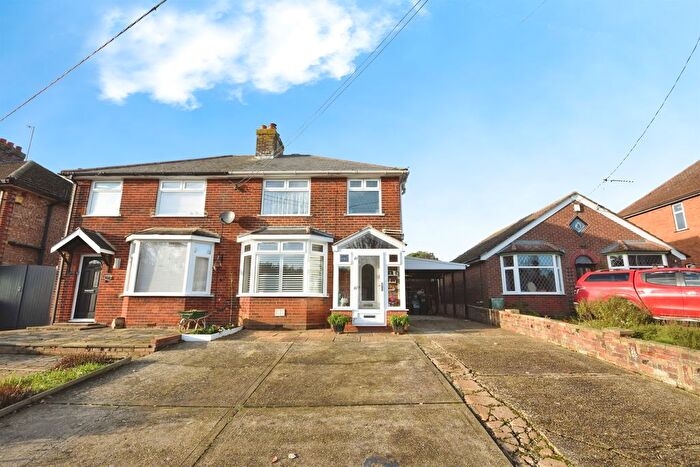
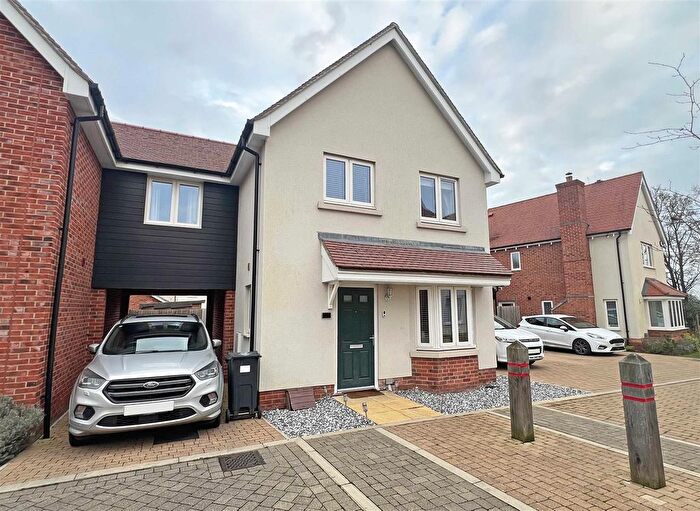
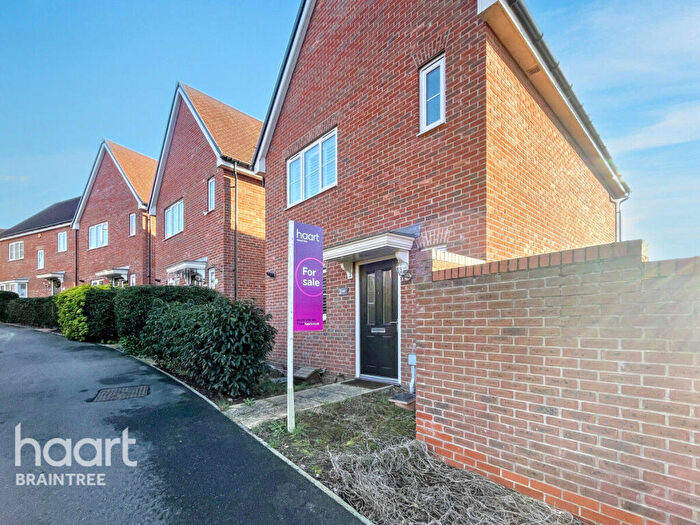
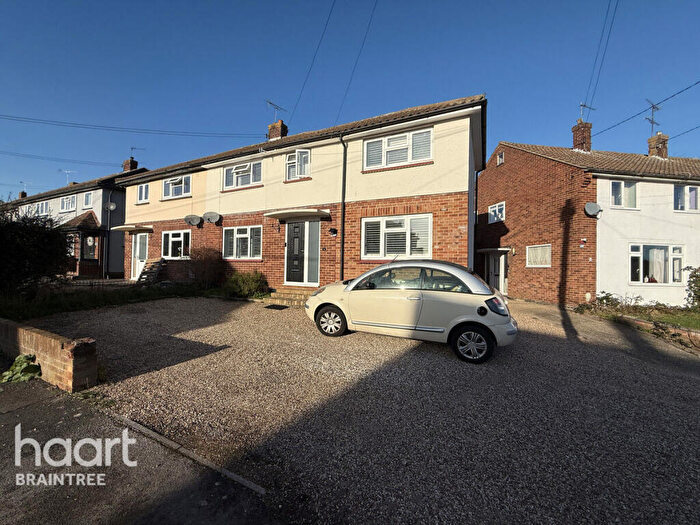
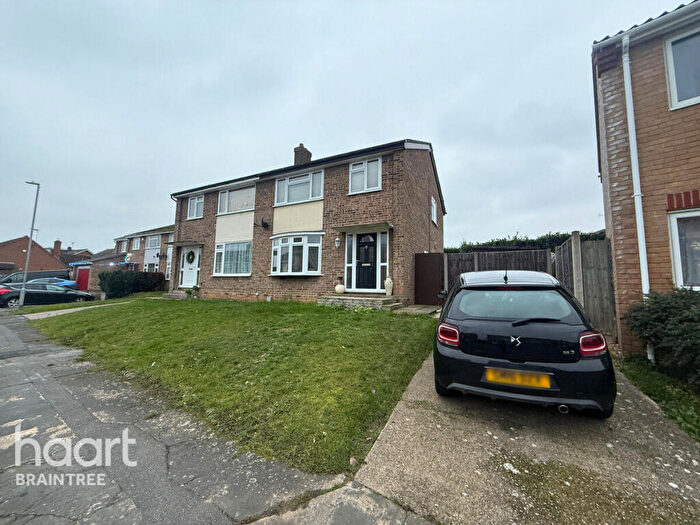
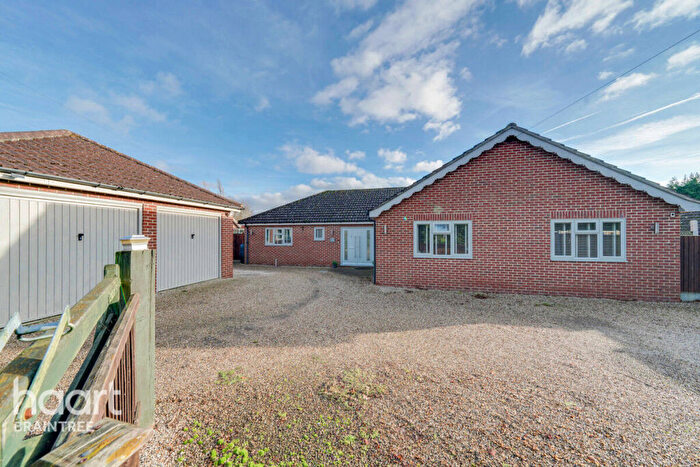
Houses for sale & to rent in Black Notley And Terling, Braintree
House Prices in Black Notley And Terling
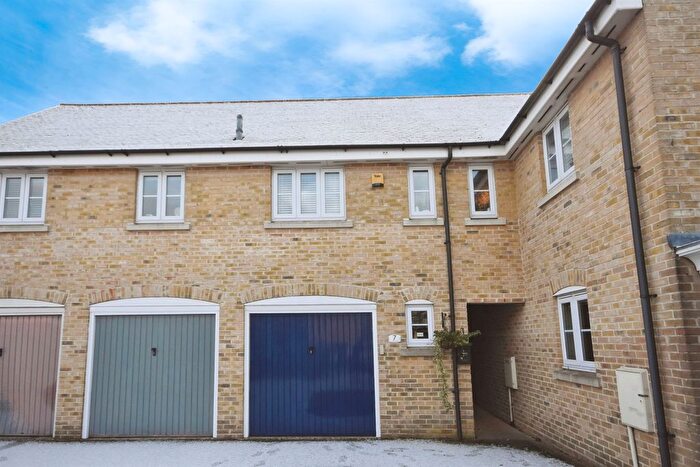
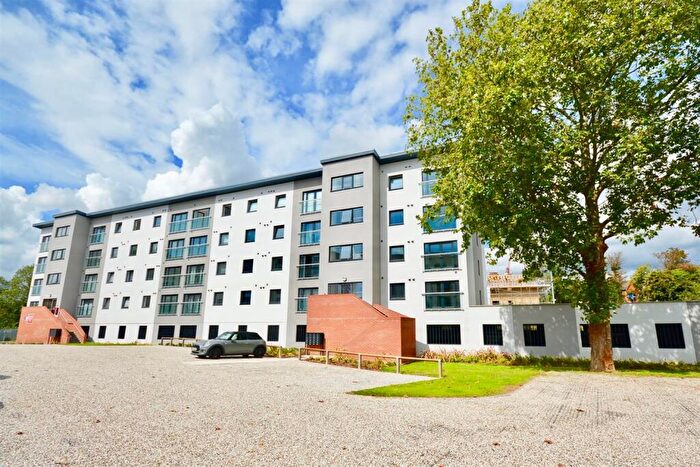
Properties in Black Notley And Terling have an average house price of £425,135.00 and had 122 Property Transactions within the last 3 years¹.
Black Notley And Terling is an area in Braintree, Essex with 879 households², where the most expensive property was sold for £1,750,000.00.
Properties for sale in Black Notley And Terling
Roads and Postcodes in Black Notley And Terling
Navigate through our locations to find the location of your next house in Black Notley And Terling, Braintree for sale or to rent.
| Streets | Postcodes |
|---|---|
| Bakers Lane | CM77 8LB CM77 8LD CM77 8QS |
| Bedells Avenue | CM77 8LZ CM77 8NA |
| Brain Valley Avenue | CM77 8LS CM77 8LT |
| Buck Hill | CM77 8LA |
| Bulford Lane | CM77 8NN CM77 8NW |
| Church Road | CM77 8LE CM77 8LG |
| Cohen Close | CM77 8FJ |
| Cokers Close | CM77 8NR |
| Constable Way | CM77 8FE |
| Custerson Drive | CM77 8ZS |
| Denton Crescent | CM77 8ZZ |
| Dewlands | CM77 8LW |
| Gainsborough Road | CM77 8DU |
| Hadfield Drive | CM77 8XW |
| Hospital Field | CM77 8FB |
| John Ray Gardens | CM77 8NE |
| London Road | CM77 8PT CM77 8QG CM77 8QN CM77 8QQ |
| Ludham Hall Lane | CM77 8QT |
| Mary Ruck Way | CM77 8FA CM77 8FU CM77 8GT CM77 8RA |
| Meadow Way | CM77 8NP |
| Osmond Close | CM77 8FH |
| Rose Walk | CM77 8AR |
| The Street | CM77 8LL |
| Turner Close | CM77 8FN |
| Wilkinson Grove | CM77 8RB |
| Witham Road | CM77 8JY CM77 8LH CM77 8LQ CM77 8LR CM77 8LU CM77 8LX CM77 8NB CM77 8ND CM77 8NG CM77 8NH CM77 8NJ CM77 8NQ |
Transport near Black Notley And Terling
- FAQ
- Price Paid By Year
- Property Type Price
Frequently asked questions about Black Notley And Terling
What is the average price for a property for sale in Black Notley And Terling?
The average price for a property for sale in Black Notley And Terling is £425,135. This amount is 21% higher than the average price in Braintree. There are 2,696 property listings for sale in Black Notley And Terling.
What streets have the most expensive properties for sale in Black Notley And Terling?
The streets with the most expensive properties for sale in Black Notley And Terling are London Road at an average of £731,388, Witham Road at an average of £532,181 and Gainsborough Road at an average of £530,000.
What streets have the most affordable properties for sale in Black Notley And Terling?
The streets with the most affordable properties for sale in Black Notley And Terling are Hadfield Drive at an average of £297,083, Wilkinson Grove at an average of £310,000 and Mary Ruck Way at an average of £326,500.
Which train stations are available in or near Black Notley And Terling?
Some of the train stations available in or near Black Notley And Terling are Cressing, Braintree Freeport and Braintree.
Property Price Paid in Black Notley And Terling by Year
The average sold property price by year was:
| Year | Average Sold Price | Price Change |
Sold Properties
|
|---|---|---|---|
| 2025 | £395,575 | -2% |
20 Properties |
| 2024 | £401,828 | -11% |
35 Properties |
| 2023 | £444,603 | -1% |
29 Properties |
| 2022 | £447,302 | 23% |
38 Properties |
| 2021 | £342,772 | -3% |
44 Properties |
| 2020 | £353,500 | 5% |
26 Properties |
| 2019 | £336,951 | -9% |
31 Properties |
| 2018 | £367,634 | -7% |
43 Properties |
| 2017 | £392,463 | 15% |
39 Properties |
| 2016 | £334,009 | 3% |
53 Properties |
| 2015 | £324,171 | 20% |
57 Properties |
| 2014 | £260,452 | -19% |
49 Properties |
| 2013 | £308,754 | 7% |
54 Properties |
| 2012 | £286,406 | 9% |
32 Properties |
| 2011 | £261,258 | 7% |
31 Properties |
| 2010 | £243,124 | -13% |
38 Properties |
| 2009 | £275,875 | 12% |
16 Properties |
| 2008 | £242,721 | -8% |
30 Properties |
| 2007 | £261,817 | 4% |
59 Properties |
| 2006 | £250,515 | 4% |
77 Properties |
| 2005 | £240,157 | 8% |
57 Properties |
| 2004 | £221,577 | 12% |
64 Properties |
| 2003 | £195,058 | 2% |
66 Properties |
| 2002 | £191,505 | 23% |
144 Properties |
| 2001 | £148,001 | 7% |
162 Properties |
| 2000 | £137,364 | 17% |
104 Properties |
| 1999 | £113,773 | 10% |
51 Properties |
| 1998 | £102,146 | 16% |
17 Properties |
| 1997 | £86,103 | 5% |
21 Properties |
| 1996 | £82,082 | 17% |
23 Properties |
| 1995 | £68,149 | - |
12 Properties |
Property Price per Property Type in Black Notley And Terling
Here you can find historic sold price data in order to help with your property search.
The average Property Paid Price for specific property types in the last three years are:
| Property Type | Average Sold Price | Sold Properties |
|---|---|---|
| Semi Detached House | £405,285.00 | 42 Semi Detached Houses |
| Detached House | £554,886.00 | 44 Detached Houses |
| Terraced House | £342,645.00 | 24 Terraced Houses |
| Flat | £183,833.00 | 12 Flats |

