
Houses for sale in Essex, England
House Prices in Essex
Properties in Essex have
an average house price of
£408k
and had 64,825 Property Transactions
within the last 3 years.¹
Essex is a location in
England with
628,449 households², where the most expensive property was sold for £12.25M.
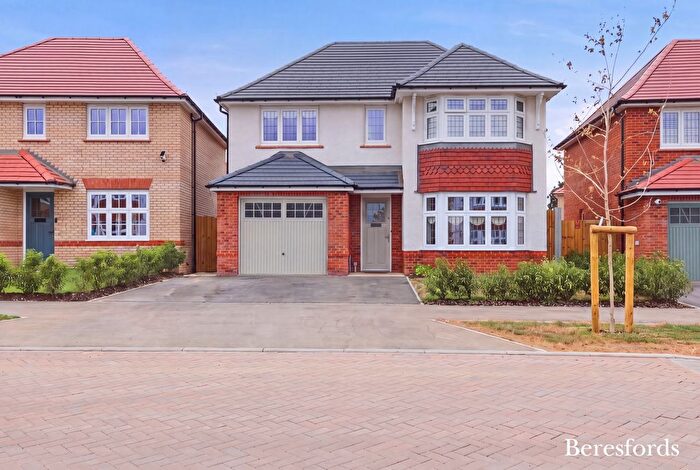
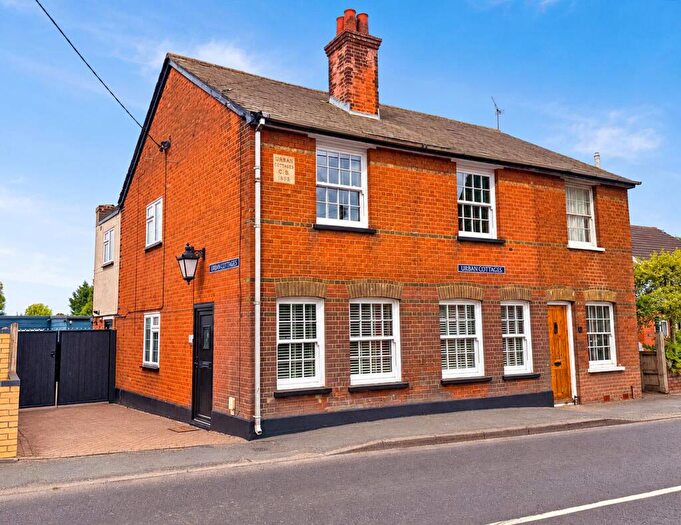
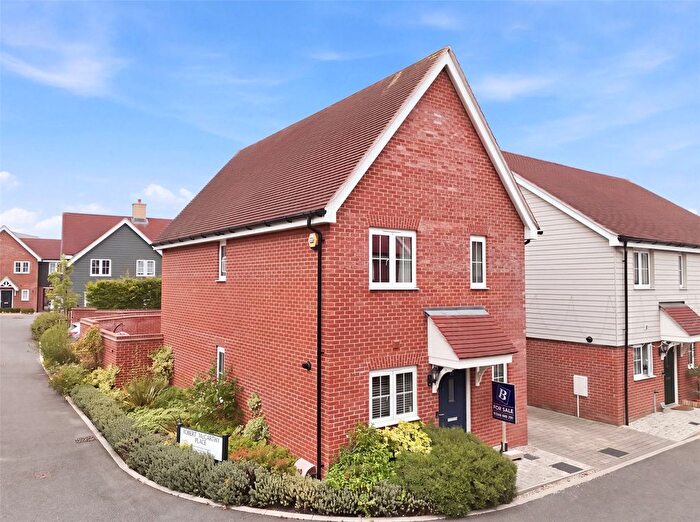
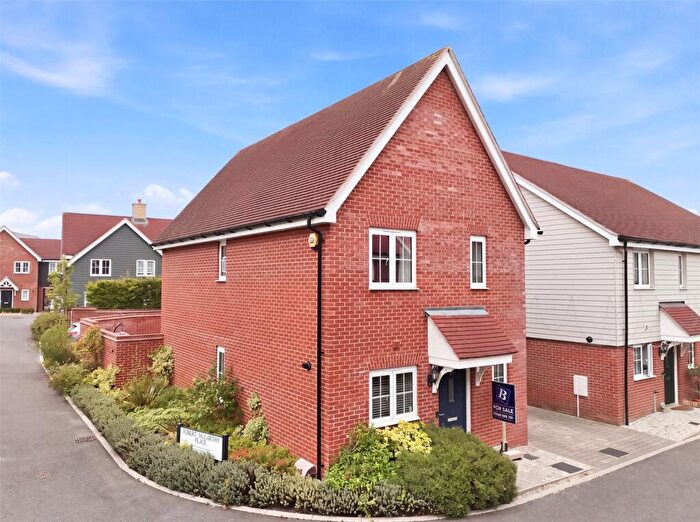
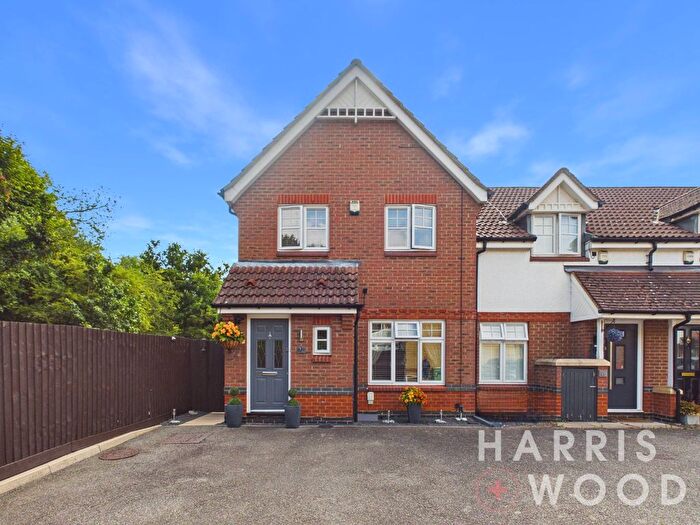
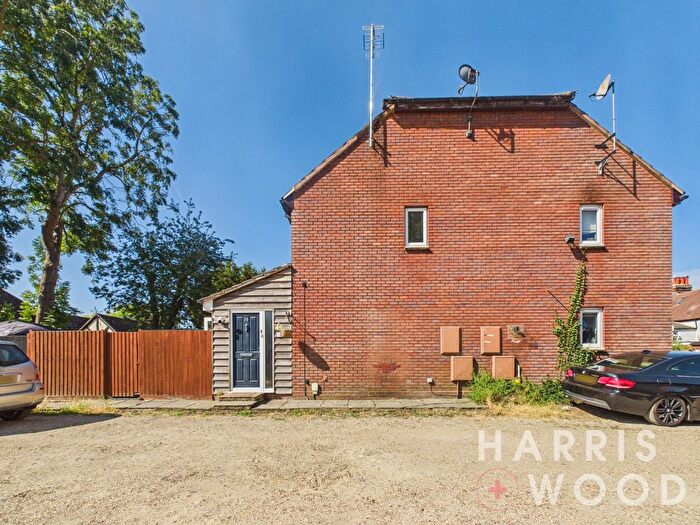
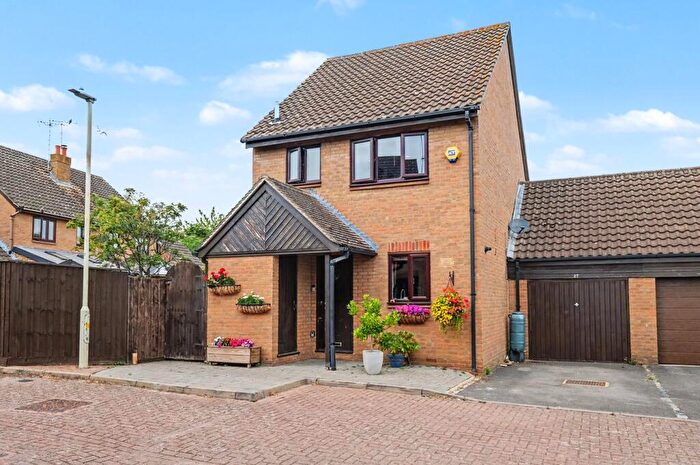
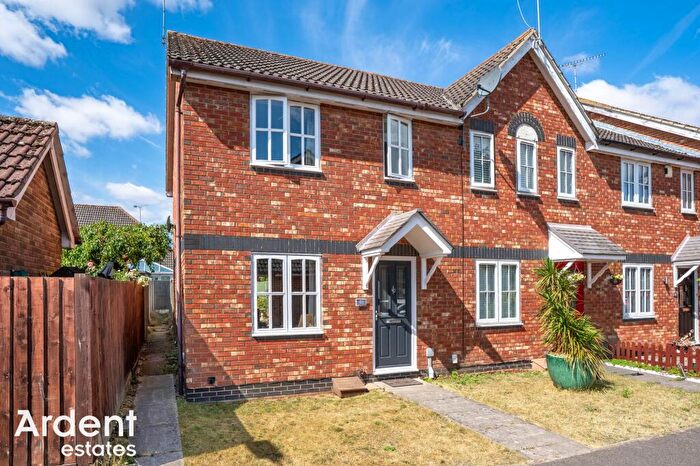
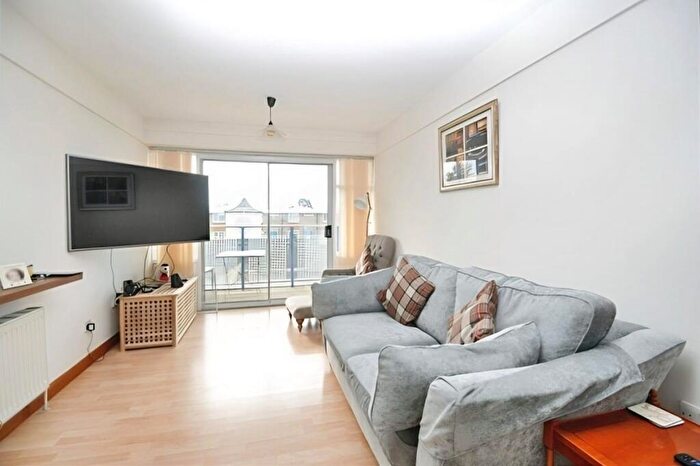
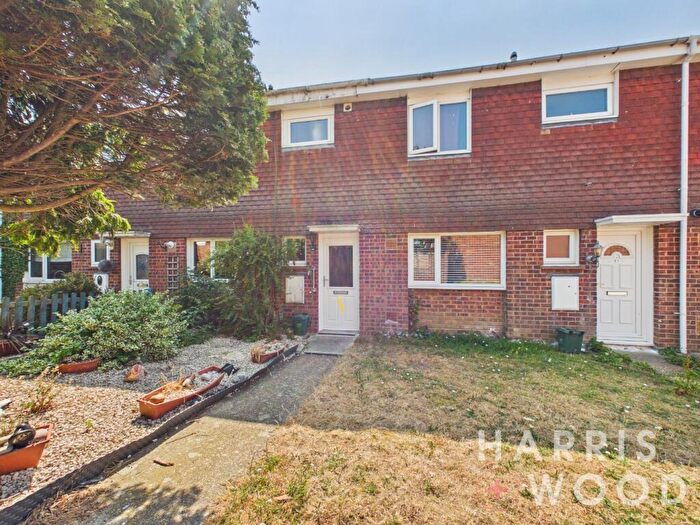
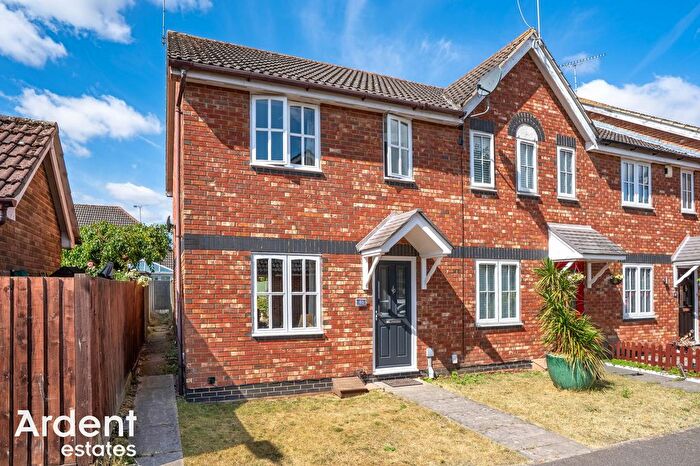
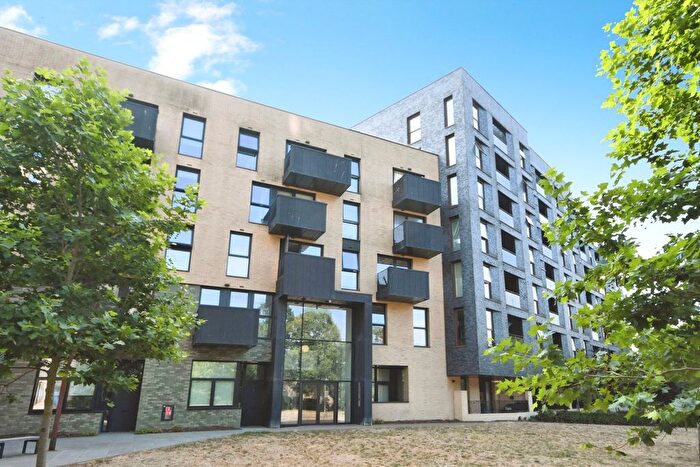
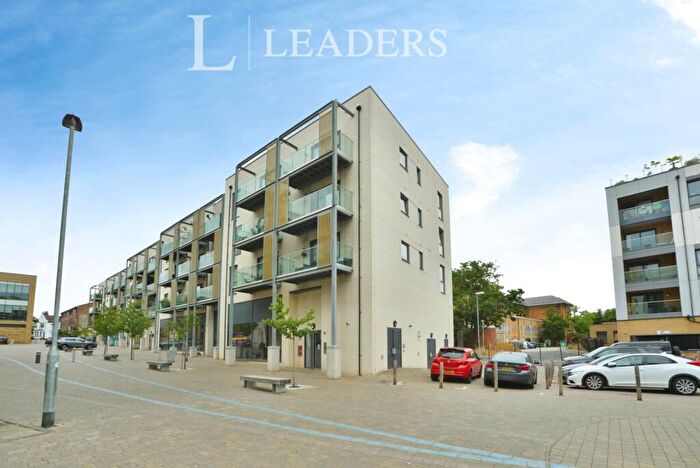
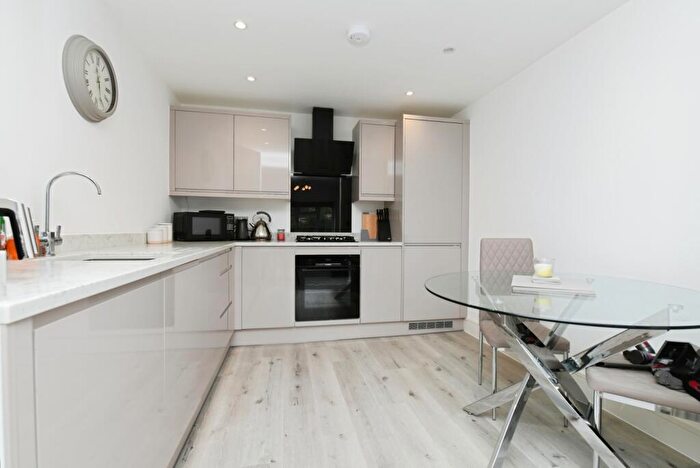
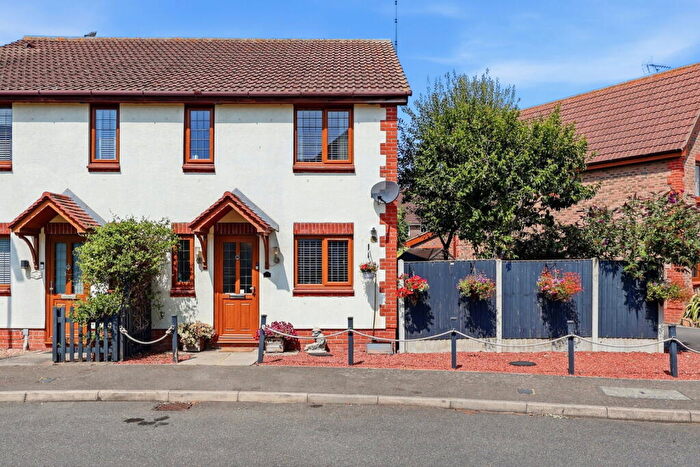
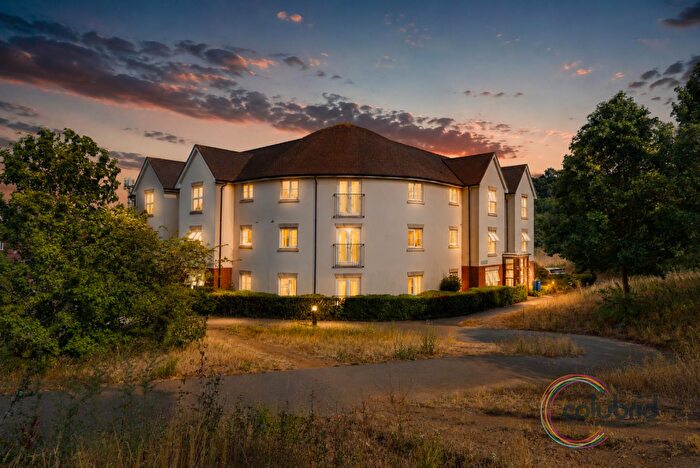
Properties for sale in Essex

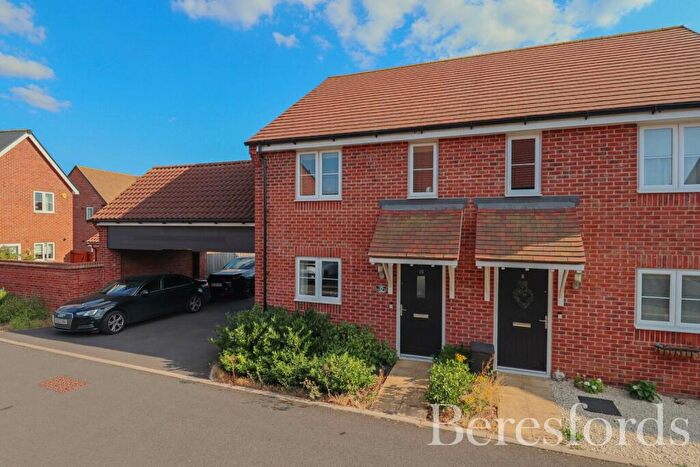


![]()
If you are looking to sell your house, let it out, or receive a property valuation, an expert can help you.
Click the button below to get started.

Towns in Essex
Navigate through our locations to find the location of your next house in Essex, England for sale or to rent.
- Loughton
- Brentwood
- Bures
- Frinton-on-sea
- Romford
- Broxbourne
- Wickford
- Harlow
- Sawbridgeworth
- Rayleigh
- Ongar
- Saffron Walden
- Harwich
- Cambridge
- Southend-on-sea
- Hoddesdon
- Leigh-on-sea
- Tilbury
- Royston
- Ingatestone
- South Ockendon
- Sudbury
- Haverhill
- Billericay
- Woodford Green
- Grays
- Chelmsford
- Westcliff-on-Sea
- Clacton-on-sea
- London
- Dunmow
- Buckhurst Hill
- Stansted
- Witham
- Upminster
- Bishops Stortford
- Burnham-on-crouch
- Rochford
- Stanford-le-hope
- Colchester
- Southminster
- Chigwell
- Braintree
- Manningtree
- Halstead
- Canvey Island
- Bishop's Stortford
- Walton On The Naze
- Basildon
- Maldon
- Epping
- Benfleet
- Hockley
- Waltham Abbey
Property price trends in Essex
According to the latest Land Registry data, the average home in Essex sold for £390,338 in 2026. That figure comes from a substantial record of 838,165 sales logged over the past 31 years.
Prices have softened over the last three years. Compared with 2023, when the typical sale came in around £401,941, that's a fall of roughly 2.9%.
Looking back five years, average prices are down about 1.4% since 2021, a drop of around £5,366 in cash terms.
Zoom out to the past decade for the fuller picture. Back in 2016, homes here averaged £320,531, so the typical sold price has climbed about 21.8% since then, roughly 2% a year. Stretch the view to fifteen years and that annual pace edges up closer to 3.2%.
Frequently asked questions about Essex
What is the average price for a property for sale in Essex?
The average price for a property for sale in Essex is £407,826. This amount is 14% higher than the average price in England. There are more than 10,000 property listings for sale in Essex.
What locations have the most expensive properties for sale in Essex?
The locations with the most expensive properties for sale in Essex are Chigwell at an average of £821,159, Ingatestone at an average of £796,042 and London at an average of £725,689.
What locations have the most affordable properties for sale in Essex?
The locations with the most affordable properties for sale in Essex are Harwich at an average of £245,083, Clacton-on-sea at an average of £255,256 and Walton On The Naze at an average of £265,980.
Which train stations are available in or near Essex?
Some of the train stations available in or near Essex are Hatfield Peverel, Witham and Chelmsford.
Property Price Paid in Essex by Year
The average sold property price by year was:
| Year | Average Sold Price | Price Change |
Sold Properties
|
|---|---|---|---|
| 2026 | £390,338 | -7% |
3,999 Properties |
| 2025 | £417,467 | 3% |
21,789 Properties |
| 2024 | £406,275 | 1% |
20,669 Properties |
| 2023 | £401,941 | -3% |
18,368 Properties |
| 2022 | £414,955 | 5% |
24,529 Properties |
| 2021 | £395,704 | 5% |
32,557 Properties |
| 2020 | £374,002 | 5% |
22,498 Properties |
| 2019 | £354,358 | 0,1% |
25,125 Properties |
| 2018 | £354,032 | 3% |
26,025 Properties |
| 2017 | £344,539 | 7% |
26,708 Properties |
Property Price per Property Type in Essex
Here you can find historic sold price data in order to help with your property search.
The average Property Paid Price for specific property types in the last three years are:
| Property Type | Average Sold Price | Sold Properties |
|---|---|---|
| Semi Detached House | £398,023.00 | 19,262 Semi Detached Houses |
| Terraced House | £333,514.00 | 15,481 Terraced Houses |
| Detached House | £589,364.00 | 19,035 Detached Houses |
| Flat | £216,249.00 | 11,047 Flats |
Transport in Essex
Please see below transportation links in this area:
