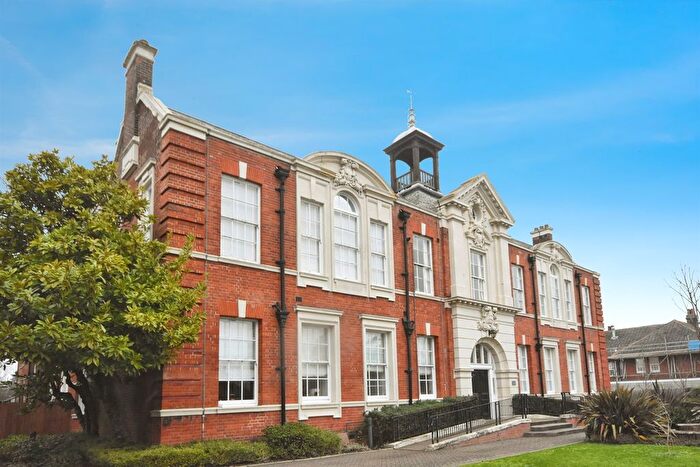
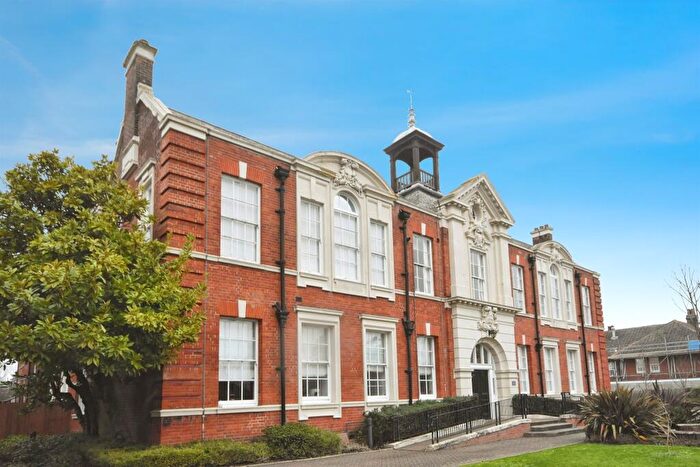
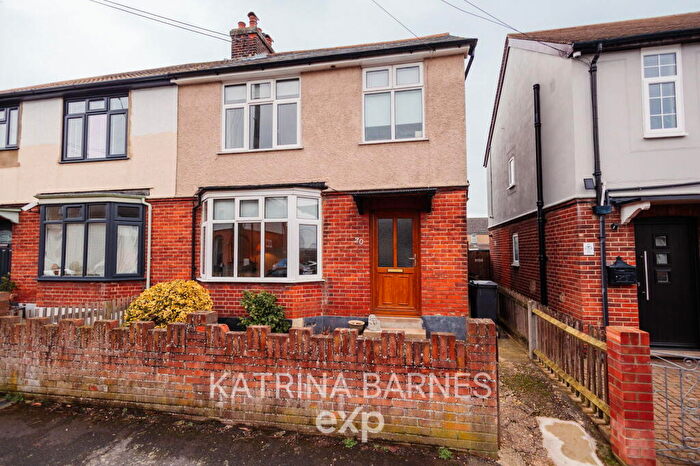
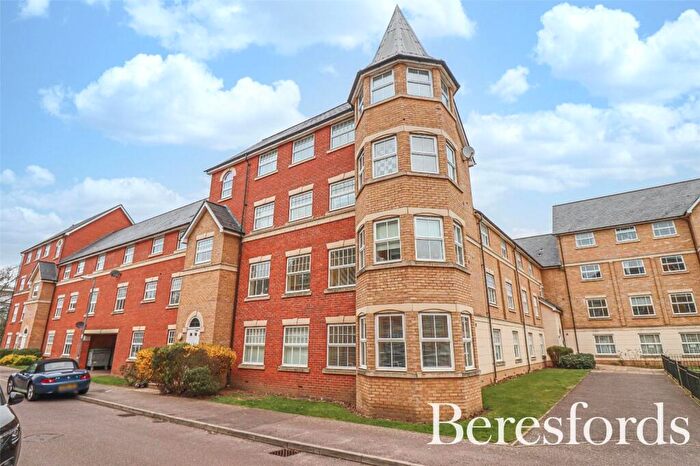
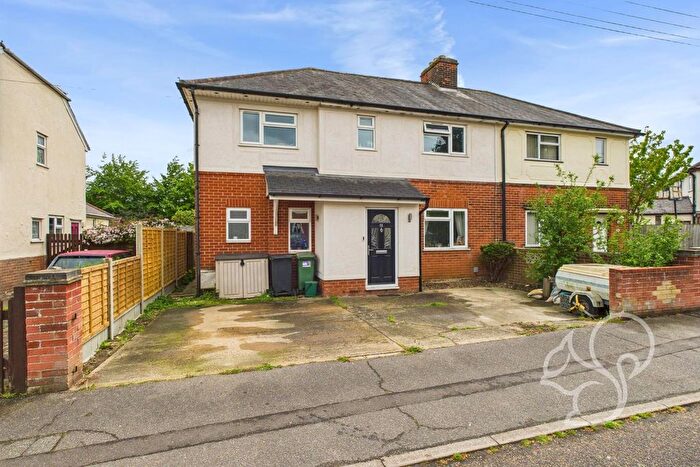
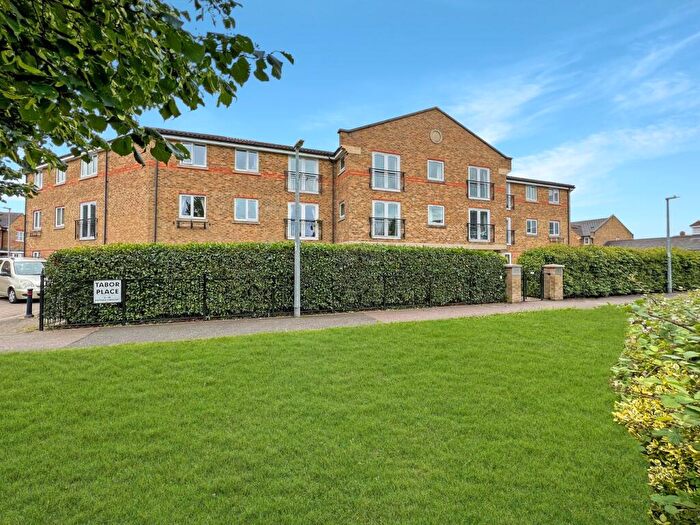
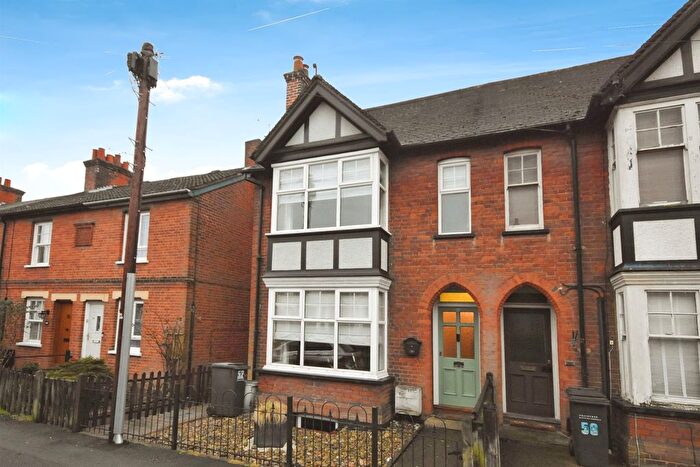
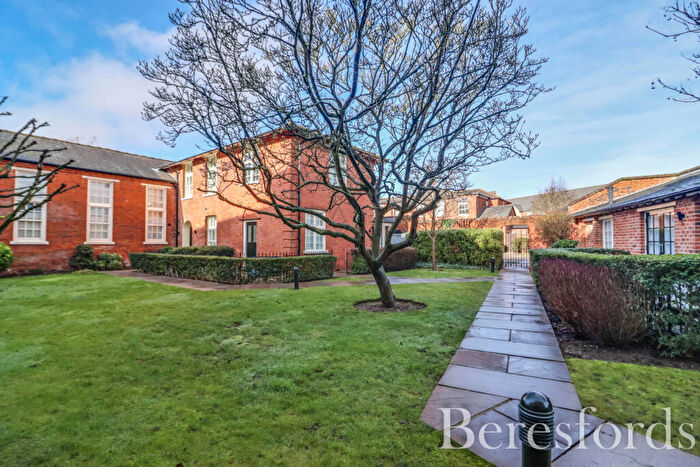
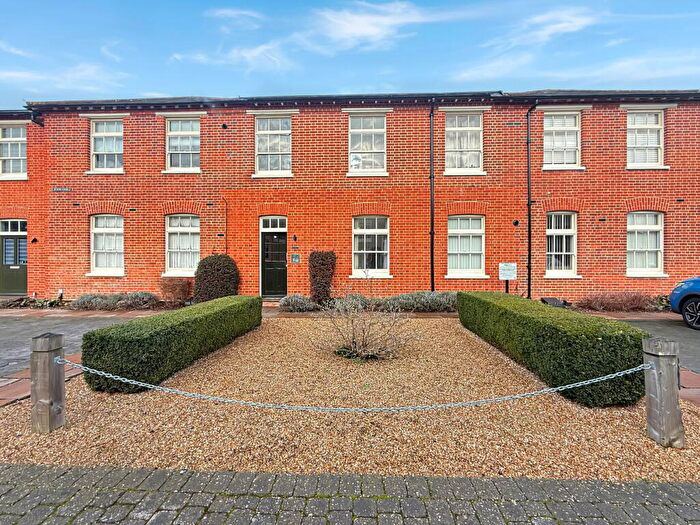
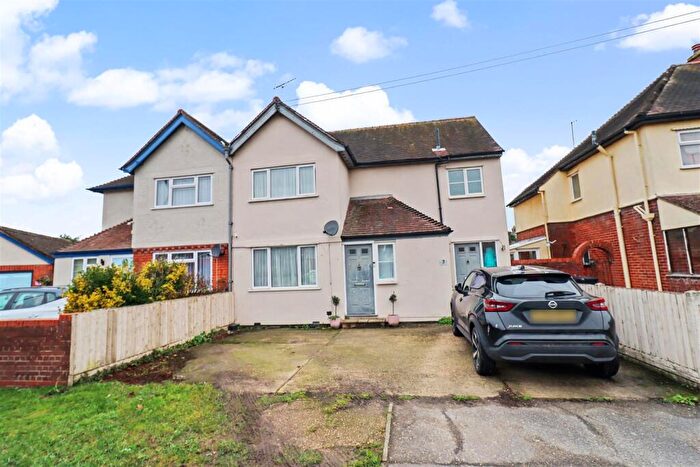
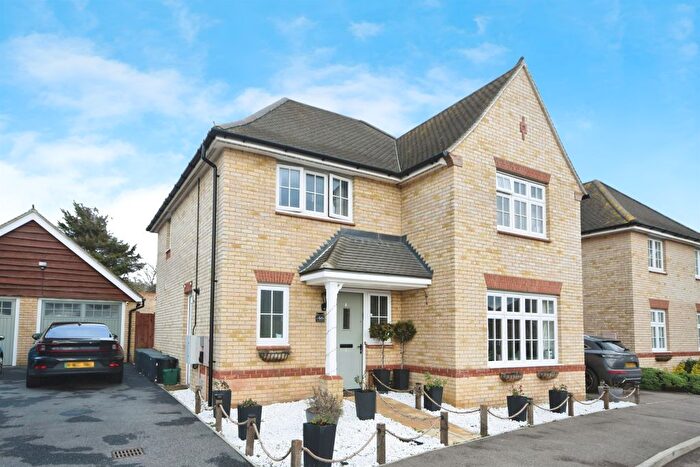
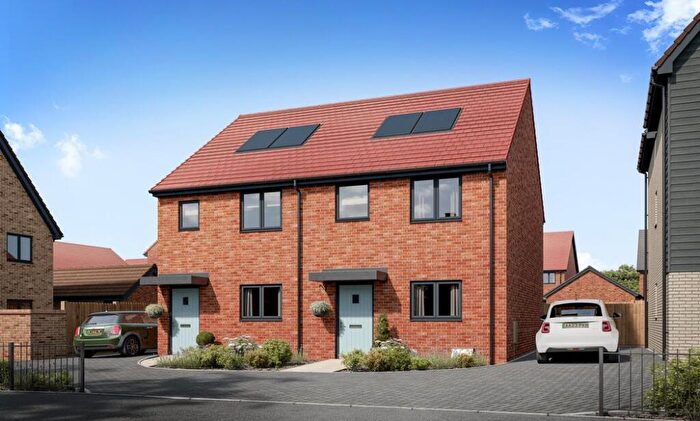
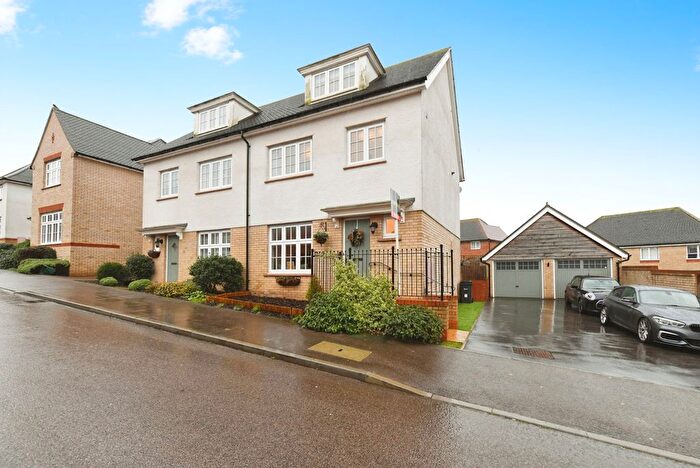
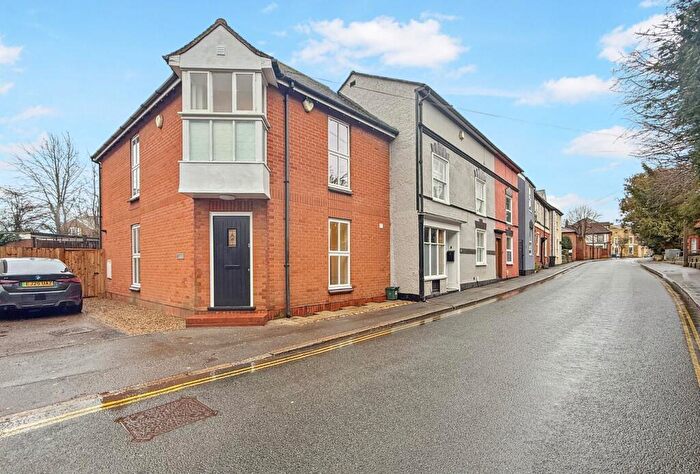
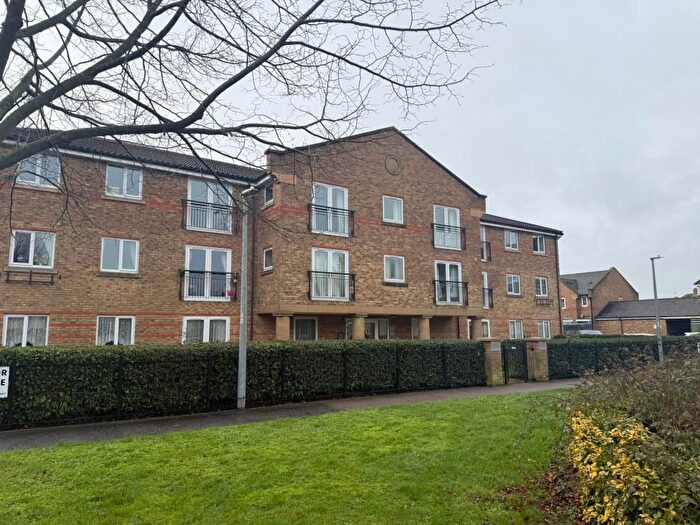
Houses for sale & to rent in Bocking South, Braintree
House Prices in Bocking South
Properties in Bocking South have an average house price of £300,156.00 and had 211 Property Transactions within the last 3 years¹.
Bocking South is an area in Braintree, Essex with 2,411 households², where the most expensive property was sold for £825,000.00.
Properties for sale in Bocking South
Roads and Postcodes in Bocking South
Navigate through our locations to find the location of your next house in Bocking South, Braintree for sale or to rent.
| Streets | Postcodes |
|---|---|
| Aetheric Road | CM7 2NE CM7 2NF |
| Alexander Road | CM7 5UH |
| Allan-williams View | CM7 2DB |
| Andrew Close | CM7 5QB |
| Arnhem Grove | CM7 5UQ |
| Bailey Bridge Road | CM7 5TN CM7 5TP CM7 5TR CM7 5TS CM7 5TT CM7 5TW |
| Bawn Close | CM7 9AY |
| Beech Avenue | CM7 5UB CM7 5UD |
| Blackwell Drive | CM7 2PU CM7 2QJ |
| Bocking End | CM7 9AA CM7 9AE |
| Boleyns Avenue | CM7 5TU CM7 5TX CM7 5TY |
| Bradbury Drive | CM7 2SD |
| Bradford Street | CM7 9AS |
| Broomfield Way | CM7 2DA |
| Bunyan Road | CM7 2PL CM7 2PJ |
| Canes Mill Court | CM7 9AP |
| Chadwick Drive | CM7 2AL |
| Cherry Bungalows | CM7 2NG |
| Chinnerys Court | CM7 2AU |
| Church Lane | CM7 5SD CM7 5SE CM7 5SF CM7 5SN |
| Coldnailhurst Avenue | CM7 2SJ CM7 2SL CM7 5PU CM7 5PX CM7 5PY CM7 5PZ CM7 5QA |
| Cooper Drive | CM7 2RF |
| Coopers Park | CM7 2TN |
| Crittal Court | CM7 2SE |
| Crittall Drive | CM7 2RT |
| Currants Farm Road | CM7 5UF |
| Dukes Road | CM7 5UE |
| Eagle Lane | CM7 5SW |
| Elliot Drive | CM7 2GD |
| Enterprise Drive | CM7 2DG |
| Faggot Yard | CM7 5SJ |
| Finch Drive | CM7 2SF |
| Flanders Close | CM7 5RU |
| Friars Lane | CM7 9BL |
| Gilchrist Way | CM7 2SY |
| Godric Place | CM7 2PN |
| Hare Pond Field | CM7 2AT |
| Harkilees Way | CM7 5QQ |
| Hills Close | CM7 9BP |
| John English Avenue | CM7 2SN CM7 2SW CM7 2SH |
| Kings Road | CM7 5RG |
| Lamberts Orchard | CM7 1FG |
| Lancaster Way | CM7 5UJ CM7 5UL |
| Little Pasture Close | CM7 1FD |
| Mace Avenue | CM7 2AE |
| Maysent Avenue | CM7 5TZ |
| Meadowside | CM7 5UG |
| Millam Way | CM7 5FT |
| Montgomery Mews | CM7 5FX |
| Motts Close | CM7 5RT |
| Normandy Way | CM7 5FF |
| Nottage Crescent | CM7 2TE CM7 2TF CM7 2TG CM7 2TS CM7 2TT CM7 2TX |
| Oak Tree Gardens | CM7 5FH |
| Osier Place | CM7 2BZ |
| Panfield Lane | CM7 1FH CM7 2TH CM7 2TJ CM7 2TL CM7 2TU CM7 5RH CM7 5RJ CM7 5RL CM7 5RN CM7 5RP CM7 5RW CM7 1FF CM7 5FP CM7 5XP |
| Peel Crescent | CM7 2RJ |
| Pegasus Way | CM7 5TL |
| Pilgrim Close | CM7 5QG |
| Porters Field | CM7 1FB CM7 1FE |
| Progress Court | CM7 2PS |
| Pygot Place | CM7 2SR |
| Queens Road | CM7 5UA |
| Rana Court | CM7 2XJ |
| Rana Drive | CM7 2TD |
| Rayne Road | CM7 2QS CM7 2QH CM7 2QT CM7 2QU |
| Rosemary Avenue | CM7 2SZ CM7 2TA CM7 2TB |
| Saunders Avenue | CM7 2ST CM7 2SS |
| Six Bells Court | CM7 5QE |
| Springwood Drive | CM7 2YN CM7 2GB |
| Springwood Industrial Estate | CM7 2RN |
| St James Road | CM7 5QF CM7 5QH |
| St Peters Close | CM7 9AW |
| St Peters In The Fields | CM7 9AR |
| St Peters Road | CM7 9AN |
| Sunnyside | CM7 2RP CM7 2RR |
| Swinbourne Drive | CM7 2YP CM7 2YG |
| Tabor Avenue | CM7 2SU CM7 2SX CM7 2SP |
| Tamdown Way | CM7 2QL |
| Tenter Close | CM7 5UN |
| The Retreat | CM7 9AZ |
| Warner Drive | CM7 2YW |
| Weavers Close | CM7 2WB |
| Wentworth Crescent | CM7 5QD |
| Wicks Close | CM7 2GE |
| Williams Drive | CM7 5QJ |
| Wingate Close | CM7 5TJ |
| Woolpack Lane | CM7 9BA |
| CM7 0TJ CM7 0TL CM7 0TN CM7 0TP CM7 0TQ CM7 0ZZ CM7 0SA CM7 0SB CM7 0SD CM7 0SE CM7 0SF CM7 0SG CM7 0SH CM7 0SJ CM7 0SL CM7 0SP CM7 0SQ CM7 0SR CM7 0SS CM7 0ST CM7 0SU CM7 0SW CM7 0SX CM7 0SY CM7 0SZ CM7 0TA CM7 0TB CM7 0TD CM7 0TE CM7 0TF CM7 0TG CM7 0TH CM7 9HB |
Transport near Bocking South
- FAQ
- Price Paid By Year
- Property Type Price
Frequently asked questions about Bocking South
What is the average price for a property for sale in Bocking South?
The average price for a property for sale in Bocking South is £300,156. This amount is 13% lower than the average price in Braintree. There are 2,145 property listings for sale in Bocking South.
What streets have the most expensive properties for sale in Bocking South?
The streets with the most expensive properties for sale in Bocking South are Motts Close at an average of £610,000, Bocking End at an average of £577,500 and Andrew Close at an average of £570,000.
What streets have the most affordable properties for sale in Bocking South?
The streets with the most affordable properties for sale in Bocking South are Lancaster Way at an average of £140,500, Progress Court at an average of £157,125 and Nottage Crescent at an average of £203,933.
Which train stations are available in or near Bocking South?
Some of the train stations available in or near Bocking South are Braintree, Braintree Freeport and Cressing.
Property Price Paid in Bocking South by Year
The average sold property price by year was:
| Year | Average Sold Price | Price Change |
Sold Properties
|
|---|---|---|---|
| 2025 | £288,901 | -4% |
66 Properties |
| 2024 | £299,695 | -4% |
78 Properties |
| 2023 | £311,779 | 1% |
67 Properties |
| 2022 | £309,242 | 8% |
78 Properties |
| 2021 | £283,267 | -8% |
97 Properties |
| 2020 | £306,304 | 3% |
80 Properties |
| 2019 | £297,192 | 13% |
113 Properties |
| 2018 | £257,772 | 2% |
74 Properties |
| 2017 | £253,394 | 11% |
69 Properties |
| 2016 | £224,326 | 1% |
85 Properties |
| 2015 | £222,204 | 13% |
139 Properties |
| 2014 | £193,434 | 3% |
92 Properties |
| 2013 | £188,299 | 0,1% |
70 Properties |
| 2012 | £188,087 | 7% |
66 Properties |
| 2011 | £174,978 | -7% |
42 Properties |
| 2010 | £186,641 | 15% |
51 Properties |
| 2009 | £158,631 | -10% |
74 Properties |
| 2008 | £174,813 | -10% |
46 Properties |
| 2007 | £191,962 | 8% |
112 Properties |
| 2006 | £176,274 | 7% |
139 Properties |
| 2005 | £163,464 | -16% |
131 Properties |
| 2004 | £189,486 | 27% |
164 Properties |
| 2003 | £137,907 | 12% |
108 Properties |
| 2002 | £121,056 | 22% |
58 Properties |
| 2001 | £94,934 | -3% |
69 Properties |
| 2000 | £97,776 | 19% |
67 Properties |
| 1999 | £79,325 | 6% |
104 Properties |
| 1998 | £74,655 | 17% |
67 Properties |
| 1997 | £61,675 | 5% |
64 Properties |
| 1996 | £58,487 | -3% |
50 Properties |
| 1995 | £60,031 | - |
46 Properties |
Property Price per Property Type in Bocking South
Here you can find historic sold price data in order to help with your property search.
The average Property Paid Price for specific property types in the last three years are:
| Property Type | Average Sold Price | Sold Properties |
|---|---|---|
| Flat | £189,678.00 | 49 Flats |
| Semi Detached House | £320,708.00 | 90 Semi Detached Houses |
| Detached House | £485,956.00 | 23 Detached Houses |
| Terraced House | £285,673.00 | 49 Terraced Houses |

