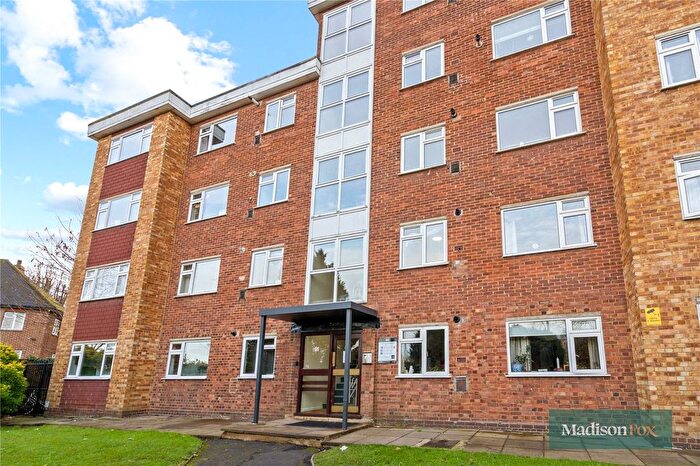
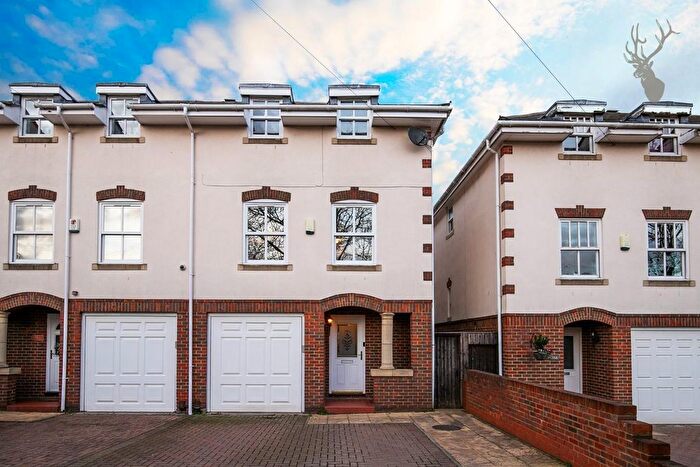
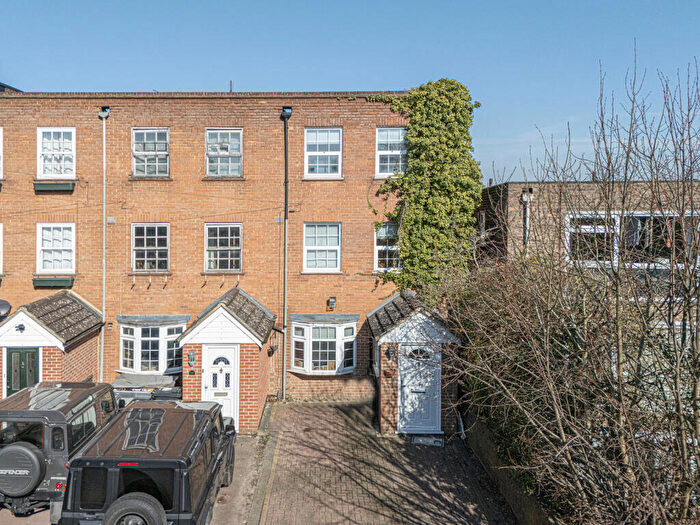
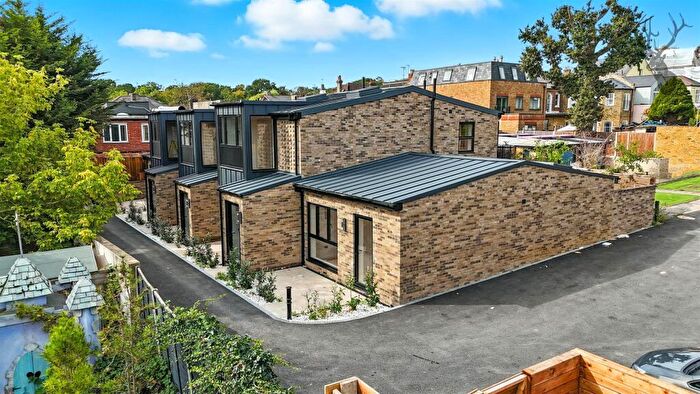
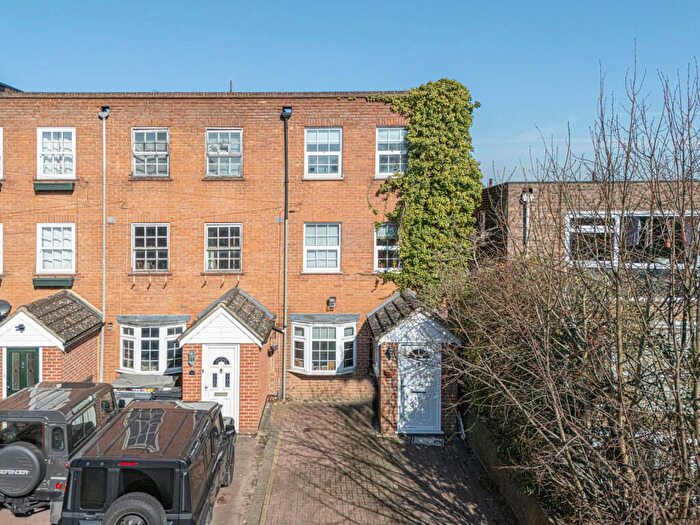
Houses for sale & to rent in Buckhurst Hill East, Buckhurst Hill
House Prices in Buckhurst Hill East
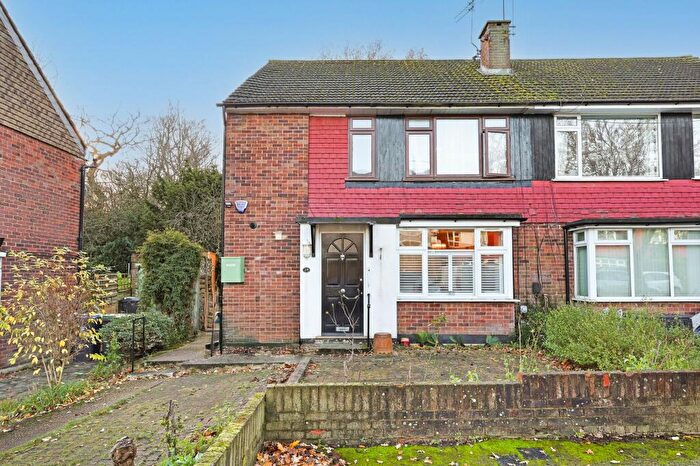
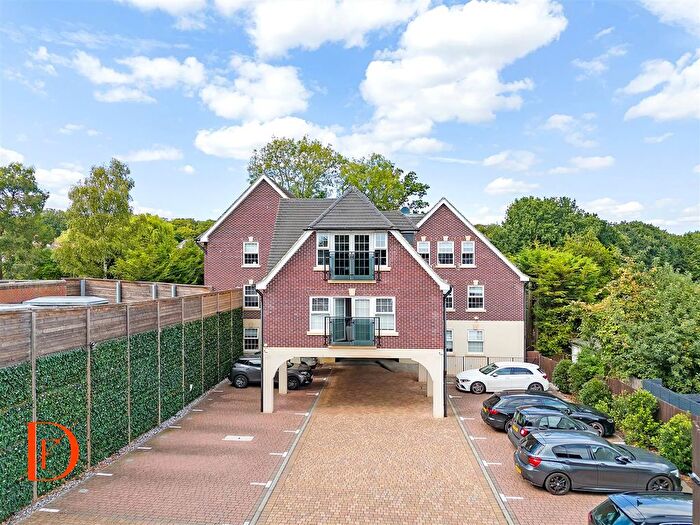
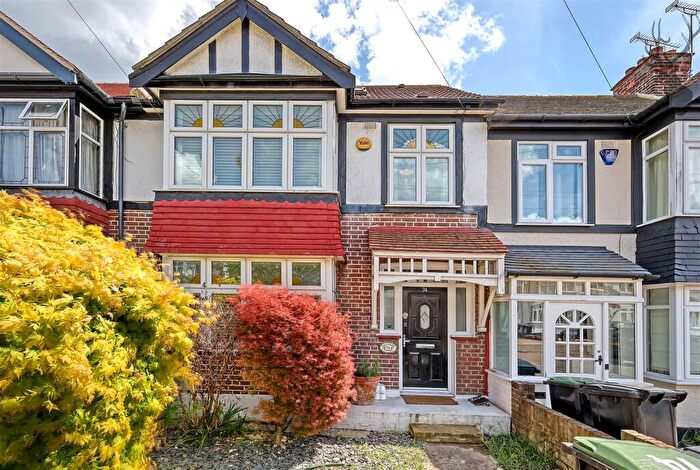
Properties in Buckhurst Hill East have an average house price of £546,063.00 and had 235 Property Transactions within the last 3 years¹.
Buckhurst Hill East is an area in Buckhurst Hill, Essex with 1,985 households², where the most expensive property was sold for £1,040,000.00.
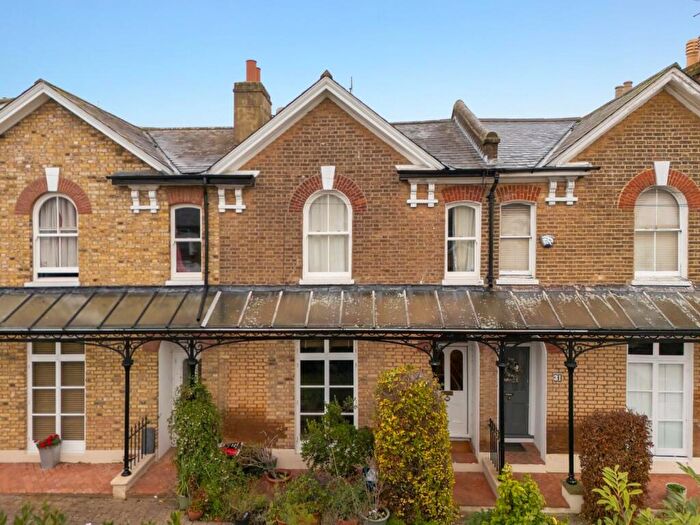
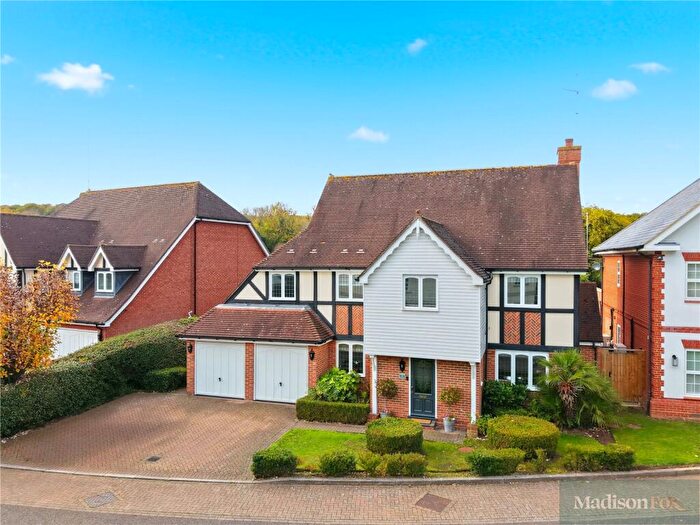
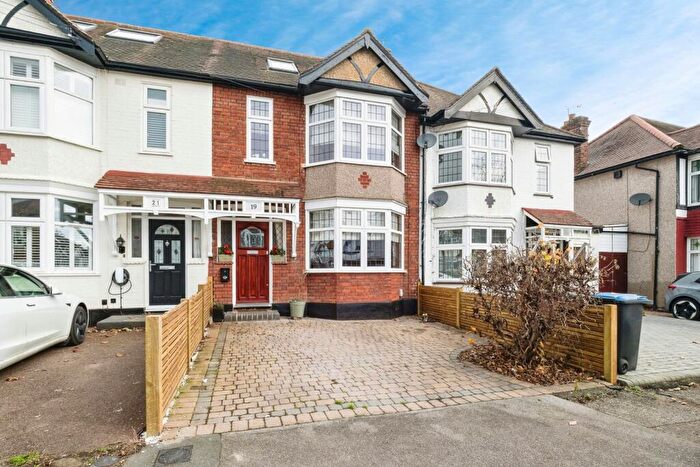
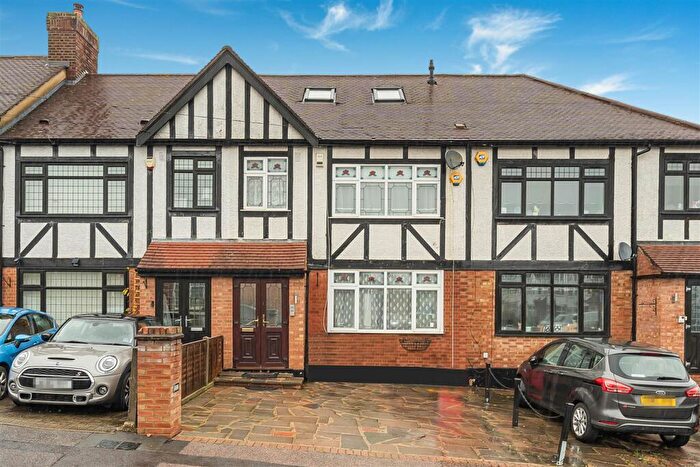
Properties for sale in Buckhurst Hill East
Roads and Postcodes in Buckhurst Hill East
Navigate through our locations to find the location of your next house in Buckhurst Hill East, Buckhurst Hill for sale or to rent.
| Streets | Postcodes |
|---|---|
| Albert Road | IG9 6BA IG9 6BF IG9 6BH IG9 6BQ IG9 6EF IG9 6EH IG9 6BD IG9 6FD |
| Albert Terrace | IG9 6DU |
| Alfred Road | IG9 6DP IG9 6DW IG9 6DR |
| Aspen Close | IG9 6FE |
| Beatrice Court | IG9 6EA |
| Birch Close | IG9 6HR |
| Blackmore Road | IG9 6AL IG9 6AP IG9 6AN |
| Boxted Close | IG9 6BX |
| Bradwell Road | IG9 6BY |
| Buckhurst Way | IG9 6HD IG9 6HJ IG9 6HP IG9 6HY IG9 6HZ |
| Cascade Close | IG9 6DY |
| Cascade Road | IG9 6DX |
| Cedar Close | IG9 6EJ |
| Chestnut Avenue | IG9 6EN IG9 6EP IG9 6EW |
| Chestnut Close | IG9 6EL |
| Dene Road | IG9 6BP |
| Elgar Close | IG9 6EG |
| Elm Close | IG9 6HL |
| Hazel Close | IG9 6FF |
| Holly Close | IG9 6HT |
| Hornbeam Close | IG9 6JS |
| Hornbeam Road | IG9 6HH IG9 6JT IG9 6JU IG9 6JX IG9 6JY IG9 6JZ IG9 6LA |
| Hurst Road | IG9 6AB |
| Lime Close | IG9 6HN |
| Loughton Way | IG9 6AA IG9 6AD IG9 6AE IG9 6AH IG9 6AJ IG9 6AR IG9 6AS |
| Lower Queens Road | IG9 6DF IG9 6DL IG9 6DN IG9 6DS IG9 6DT |
| Maple Close | IG9 6HW |
| Mountbatten Court | IG9 6DH |
| Pentlow Way | IG9 6BZ IG9 6DA |
| Plane Close | IG9 6JW |
| River Road | IG9 6BS |
| Roding Lane | IG9 6BJ IG9 6GQ |
| Roding View | IG9 6AF IG9 6AQ |
| Rous Road | IG9 6BL IG9 6BN IG9 6BT IG9 6BU IG9 6BW |
| Station Way | IG9 6LL IG9 6LN IG9 6FA |
| Thaxted Road | IG9 6AW |
| The Rise | IG9 6AG |
| The Windsors | IG9 6DJ |
| Walnut Way | IG9 6HU IG9 6HX |
| Willow Close | IG9 6HS |
| Yew Close | IG9 6BB |
Transport near Buckhurst Hill East
-
Buckhurst Hill Station
-
Roding Valley Station
-
Loughton Station
-
Chigwell Station
-
Woodford Station
-
Chingford Station
-
Grange Hill Station
-
Debden Station
-
Highams Park Station
-
Hainault Station
- FAQ
- Price Paid By Year
- Property Type Price
Frequently asked questions about Buckhurst Hill East
What is the average price for a property for sale in Buckhurst Hill East?
The average price for a property for sale in Buckhurst Hill East is £546,063. This amount is 14% lower than the average price in Buckhurst Hill. There are 1,015 property listings for sale in Buckhurst Hill East.
What streets have the most expensive properties for sale in Buckhurst Hill East?
The streets with the most expensive properties for sale in Buckhurst Hill East are Rous Road at an average of £789,781, Walnut Way at an average of £711,666 and Cascade Close at an average of £702,750.
What streets have the most affordable properties for sale in Buckhurst Hill East?
The streets with the most affordable properties for sale in Buckhurst Hill East are Albert Road at an average of £266,211, Hornbeam Road at an average of £331,676 and Station Way at an average of £363,700.
Which train stations are available in or near Buckhurst Hill East?
Some of the train stations available in or near Buckhurst Hill East are Chingford and Highams Park.
Which tube stations are available in or near Buckhurst Hill East?
Some of the tube stations available in or near Buckhurst Hill East are Buckhurst Hill, Roding Valley and Loughton.
Property Price Paid in Buckhurst Hill East by Year
The average sold property price by year was:
| Year | Average Sold Price | Price Change |
Sold Properties
|
|---|---|---|---|
| 2025 | £538,347 | -2% |
36 Properties |
| 2024 | £546,527 | -3% |
72 Properties |
| 2023 | £560,881 | 4% |
58 Properties |
| 2022 | £537,150 | -1% |
69 Properties |
| 2021 | £541,473 | 9% |
108 Properties |
| 2020 | £490,836 | -6% |
58 Properties |
| 2019 | £518,402 | 4% |
66 Properties |
| 2018 | £500,242 | 2% |
66 Properties |
| 2017 | £492,520 | 8% |
74 Properties |
| 2016 | £452,072 | 8% |
79 Properties |
| 2015 | £417,609 | 11% |
87 Properties |
| 2014 | £373,613 | 9% |
97 Properties |
| 2013 | £339,790 | 5% |
72 Properties |
| 2012 | £321,560 | 9% |
67 Properties |
| 2011 | £292,088 | 1% |
64 Properties |
| 2010 | £289,692 | 8% |
85 Properties |
| 2009 | £266,624 | -9% |
72 Properties |
| 2008 | £291,794 | 2% |
64 Properties |
| 2007 | £287,252 | 3% |
134 Properties |
| 2006 | £278,742 | 18% |
123 Properties |
| 2005 | £227,484 | -2% |
92 Properties |
| 2004 | £230,929 | 2% |
117 Properties |
| 2003 | £226,838 | 19% |
102 Properties |
| 2002 | £184,413 | 13% |
114 Properties |
| 2001 | £161,293 | 13% |
117 Properties |
| 2000 | £140,819 | 22% |
80 Properties |
| 1999 | £110,100 | 4% |
123 Properties |
| 1998 | £105,339 | 11% |
96 Properties |
| 1997 | £93,948 | 12% |
120 Properties |
| 1996 | £82,342 | -4% |
99 Properties |
| 1995 | £85,471 | - |
70 Properties |
Property Price per Property Type in Buckhurst Hill East
Here you can find historic sold price data in order to help with your property search.
The average Property Paid Price for specific property types in the last three years are:
| Property Type | Average Sold Price | Sold Properties |
|---|---|---|
| Semi Detached House | £675,427.00 | 74 Semi Detached Houses |
| Detached House | £675,500.00 | 6 Detached Houses |
| Terraced House | £611,384.00 | 89 Terraced Houses |
| Flat | £301,169.00 | 66 Flats |

