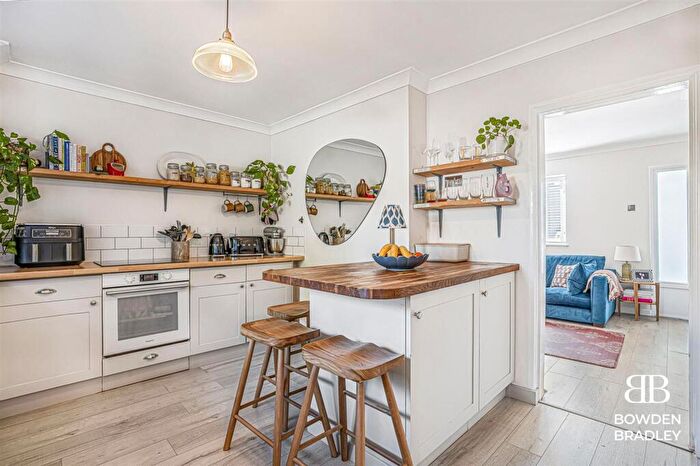
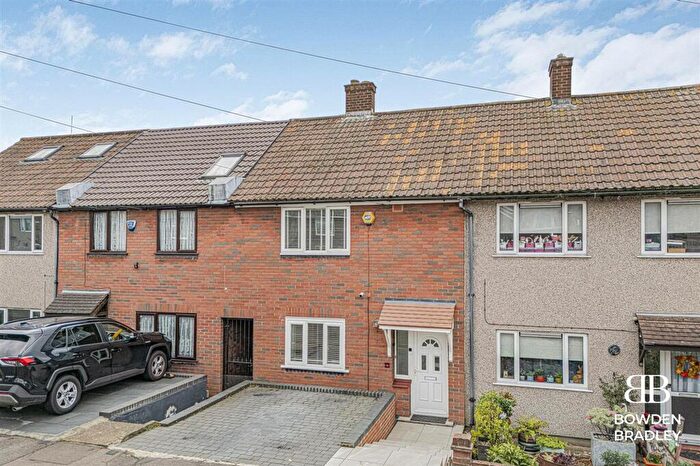
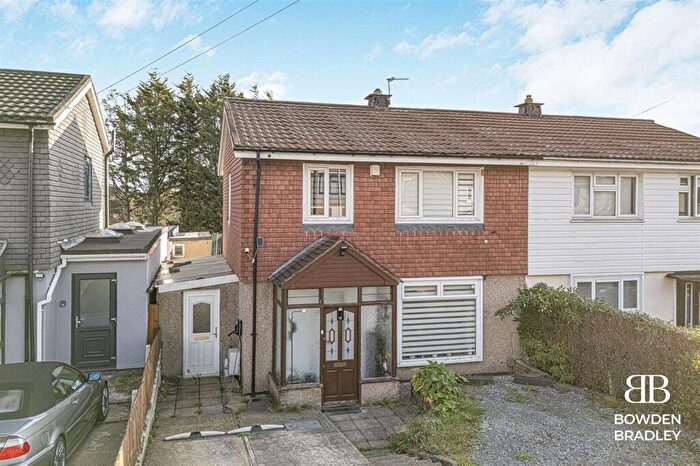
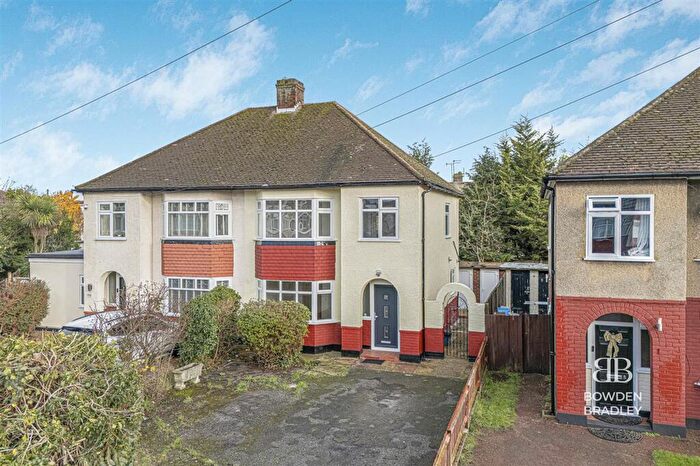
Houses for sale & to rent in Chigwell Row, Chigwell
House Prices in Chigwell Row
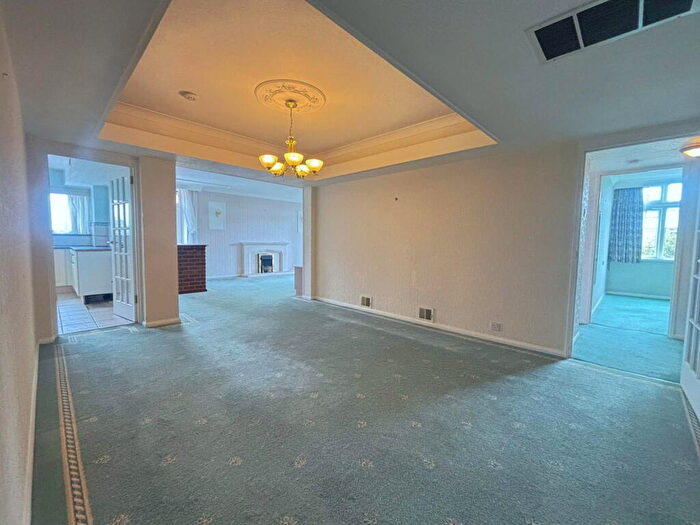
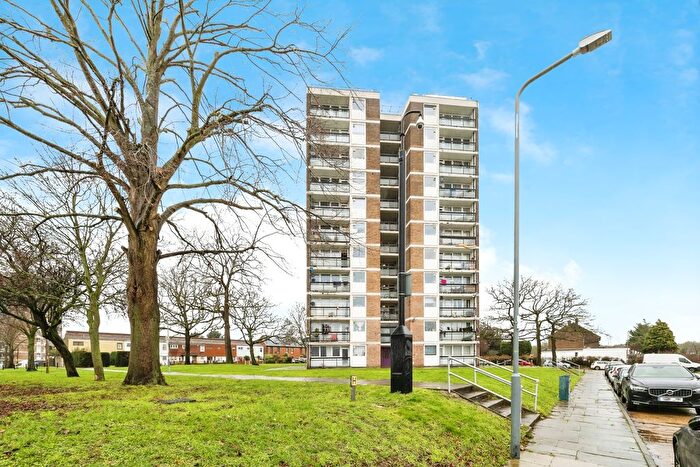
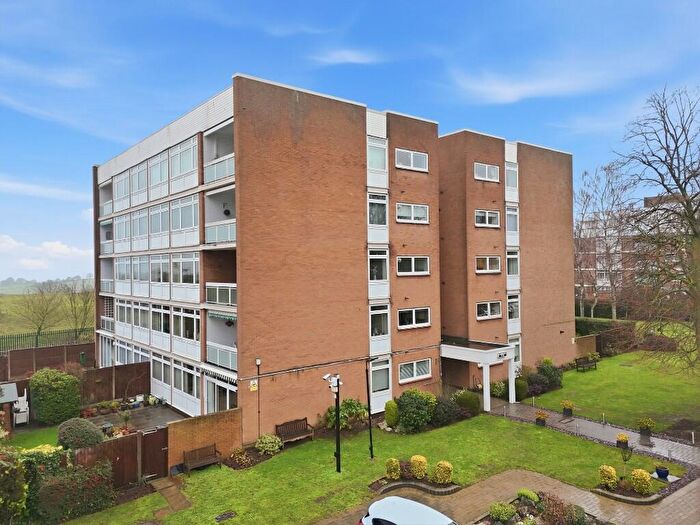
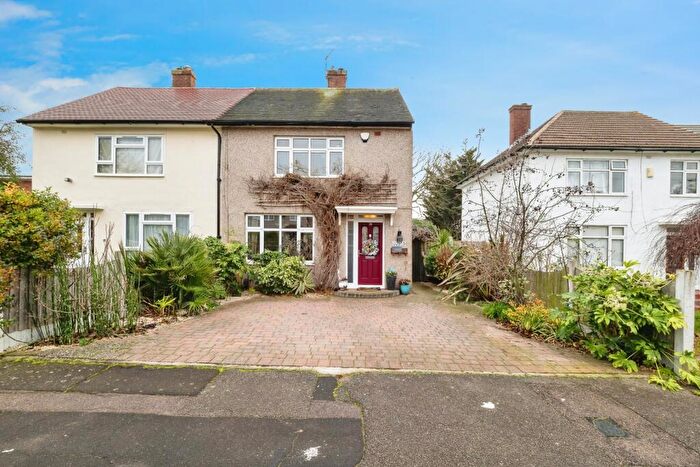
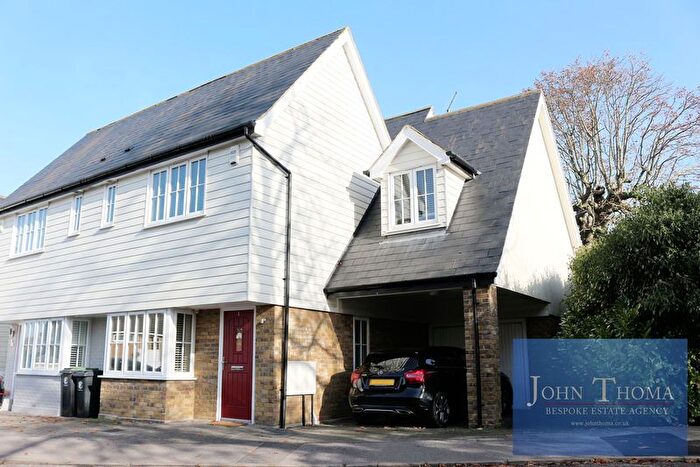
Properties in Chigwell Row have an average house price of £619,318.00 and had 113 Property Transactions within the last 3 years¹.
Chigwell Row is an area in Chigwell, Essex with 908 households², where the most expensive property was sold for £2,975,000.00.
Properties for sale in Chigwell Row
Roads and Postcodes in Chigwell Row
Navigate through our locations to find the location of your next house in Chigwell Row, Chigwell for sale or to rent.
| Streets | Postcodes |
|---|---|
| All Saints Close | IG7 6EG |
| Canterbury Close | IG7 6HG |
| Chapel Lane | IG7 6JJ |
| Chase Lane | IG7 6JW |
| Coopers Close | IG7 6EU IG7 6EX |
| Daylop Drive | IG7 4QF |
| Faversham Close | IG7 6HB |
| Gainsborough Place | IG7 6LA |
| Glebelands | IG7 4QG |
| Gravel Close | IG7 6BZ |
| Gravel Lane | IG7 6DA IG7 6DB |
| Green Lane | IG7 6LY |
| Grove Lane | IG7 6JD IG7 6JE IG7 6JF IG7 6JQ |
| Ingleby Gardens | IG7 6EH |
| Lakeside Close | IG7 6HJ |
| Lambourne Close | IG7 6EB |
| Lambourne Crescent | IG7 6EY |
| Lambourne Road | IG7 6EF IG7 6EJ IG7 6EN IG7 6EP IG7 6ET IG7 6EZ IG7 6HA IG7 6HX IG7 6JN IG7 6JP IG7 6JS IG7 6JT IG7 6JU IG7 6HH IG7 6HZ IG7 6JB IG7 6NN IG7 6FA |
| Lodge Close | IG7 6JL |
| Marden Close | IG7 6ER |
| Maxwell Court | IG7 6DZ |
| Maypole Drive | IG7 6DE |
| Millers Close | IG7 6DF |
| Millers Lane | IG7 6DG |
| Orchard Way | IG7 6EE |
| Pudding Lane | IG7 6BY IG7 6JG IG7 6FD |
| Raymond Gardens | IG7 6EW |
| Retreat Way | IG7 6EL |
| Romford Road | IG7 4QD |
| Shillibeer Walk | IG7 6JA |
| Sunnymede | IG7 6DU IG7 6ES |
| Sylvan Way | IG7 4QB |
| The Bowls | IG7 6NB IG7 6ND |
| Vicarage Lane | IG7 6LT IG7 6LZ |
| Whitehall Close | IG7 6EQ |
| Willow Mead | IG7 6JR |
| Woolhampton Way | IG7 4QE IG7 4QH IG7 4QJ IG7 4QQ |
Transport near Chigwell Row
-
Grange Hill Station
-
Hainault Station
-
Chigwell Station
-
Fairlop Station
-
Debden Station
-
Barkingside Station
-
Buckhurst Hill Station
-
Loughton Station
-
Roding Valley Station
- FAQ
- Price Paid By Year
- Property Type Price
Frequently asked questions about Chigwell Row
What is the average price for a property for sale in Chigwell Row?
The average price for a property for sale in Chigwell Row is £619,318. This amount is 28% lower than the average price in Chigwell. There are 823 property listings for sale in Chigwell Row.
What streets have the most expensive properties for sale in Chigwell Row?
The streets with the most expensive properties for sale in Chigwell Row are Pudding Lane at an average of £1,775,000, Chapel Lane at an average of £1,547,500 and Lodge Close at an average of £1,002,500.
What streets have the most affordable properties for sale in Chigwell Row?
The streets with the most affordable properties for sale in Chigwell Row are Retreat Way at an average of £371,013, Sunnymede at an average of £379,312 and Gravel Close at an average of £391,250.
Which tube stations are available in or near Chigwell Row?
Some of the tube stations available in or near Chigwell Row are Grange Hill, Hainault and Chigwell.
Property Price Paid in Chigwell Row by Year
The average sold property price by year was:
| Year | Average Sold Price | Price Change |
Sold Properties
|
|---|---|---|---|
| 2025 | £521,031 | -5% |
16 Properties |
| 2024 | £545,055 | -28% |
27 Properties |
| 2023 | £697,675 | 6% |
26 Properties |
| 2022 | £654,328 | -1% |
44 Properties |
| 2021 | £659,392 | 15% |
42 Properties |
| 2020 | £562,177 | -3% |
39 Properties |
| 2019 | £578,756 | 3% |
37 Properties |
| 2018 | £561,734 | 6% |
33 Properties |
| 2017 | £528,913 | -4% |
29 Properties |
| 2016 | £552,411 | 9% |
45 Properties |
| 2015 | £502,446 | 23% |
32 Properties |
| 2014 | £387,305 | 1% |
41 Properties |
| 2013 | £383,129 | 11% |
31 Properties |
| 2012 | £342,077 | 10% |
36 Properties |
| 2011 | £306,204 | -13% |
22 Properties |
| 2010 | £345,564 | -9% |
27 Properties |
| 2009 | £375,675 | -7% |
20 Properties |
| 2008 | £403,145 | -1% |
24 Properties |
| 2007 | £407,661 | 7% |
61 Properties |
| 2006 | £378,408 | 25% |
56 Properties |
| 2005 | £282,884 | -12% |
46 Properties |
| 2004 | £317,088 | -10% |
77 Properties |
| 2003 | £349,215 | 22% |
46 Properties |
| 2002 | £272,059 | 20% |
42 Properties |
| 2001 | £217,034 | -6% |
43 Properties |
| 2000 | £230,328 | 15% |
47 Properties |
| 1999 | £195,979 | 28% |
52 Properties |
| 1998 | £140,915 | -34% |
42 Properties |
| 1997 | £189,340 | 38% |
35 Properties |
| 1996 | £116,599 | -9% |
39 Properties |
| 1995 | £127,291 | - |
42 Properties |
Property Price per Property Type in Chigwell Row
Here you can find historic sold price data in order to help with your property search.
The average Property Paid Price for specific property types in the last three years are:
| Property Type | Average Sold Price | Sold Properties |
|---|---|---|
| Semi Detached House | £589,562.00 | 28 Semi Detached Houses |
| Detached House | £1,067,352.00 | 25 Detached Houses |
| Terraced House | £498,195.00 | 28 Terraced Houses |
| Flat | £401,312.00 | 32 Flats |

