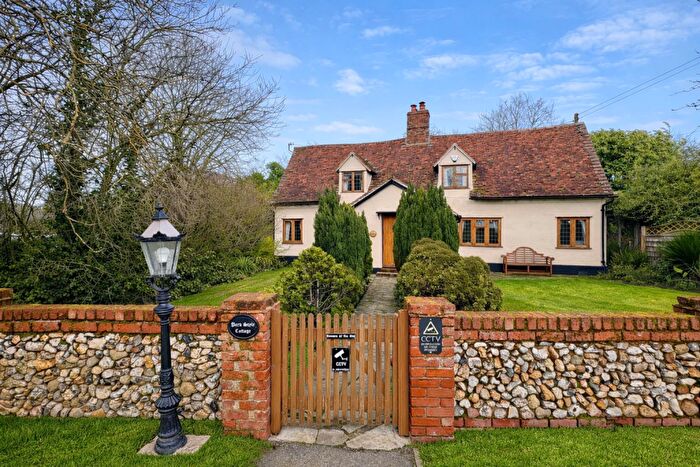
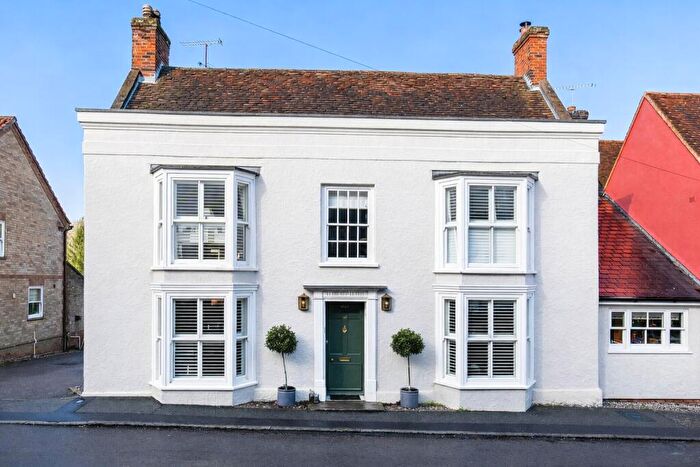
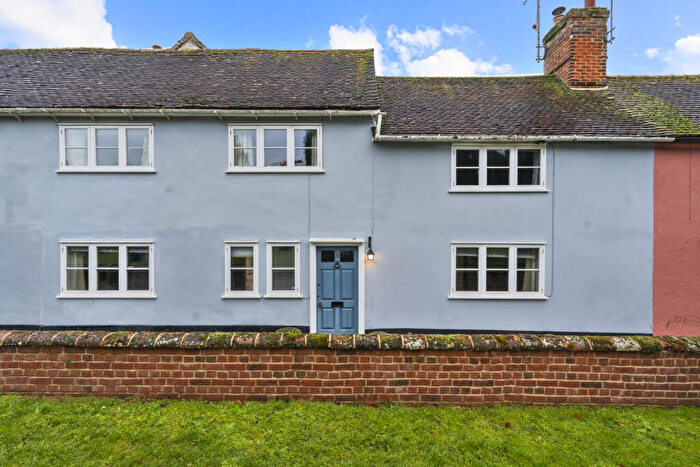
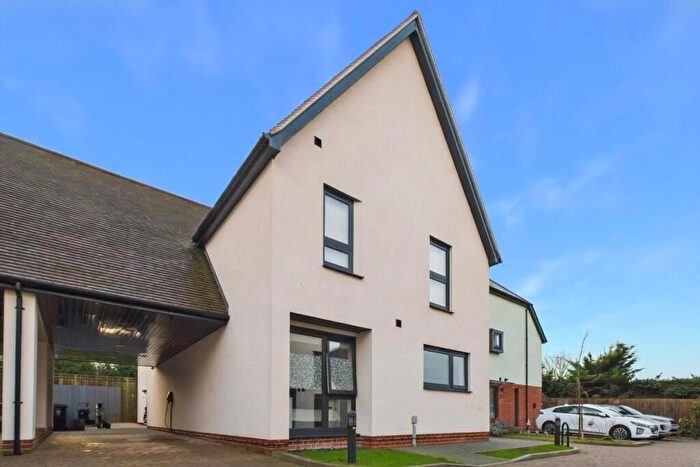
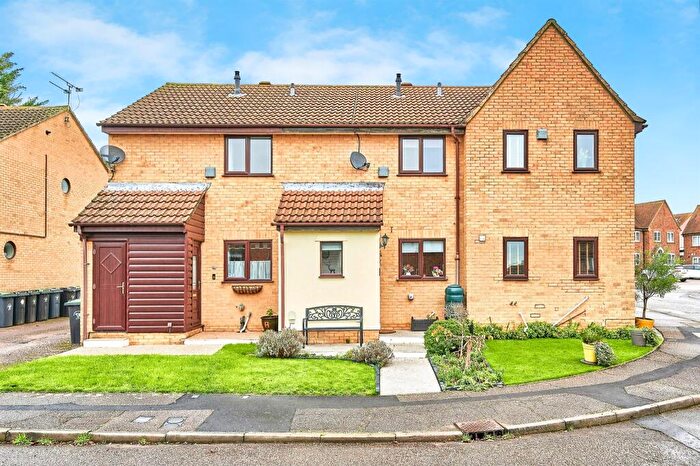
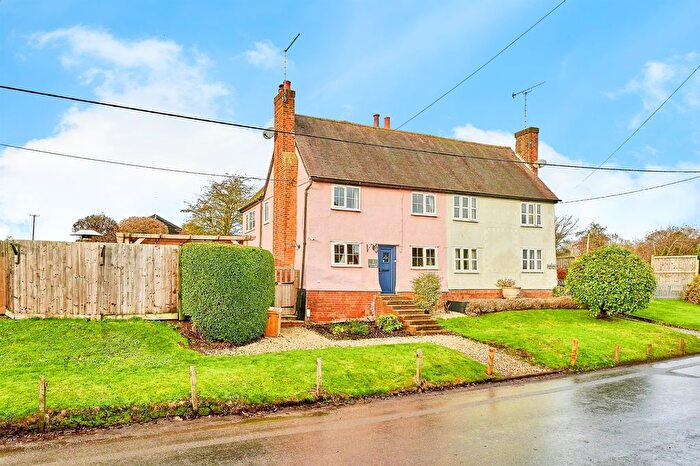
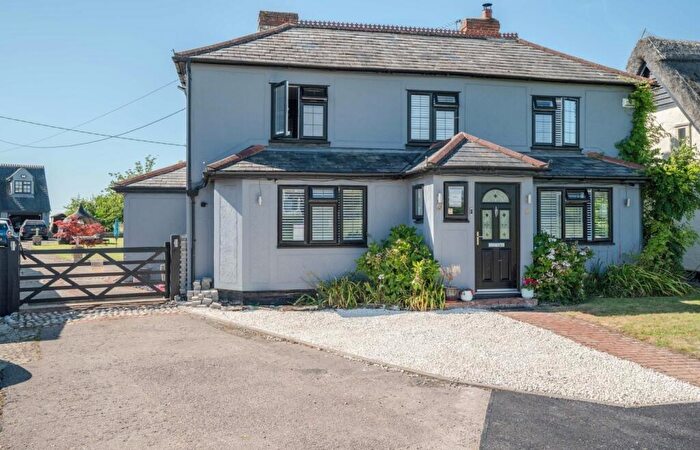
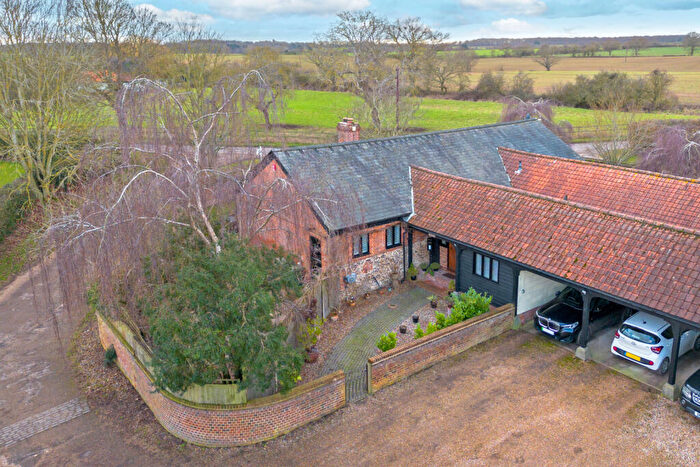
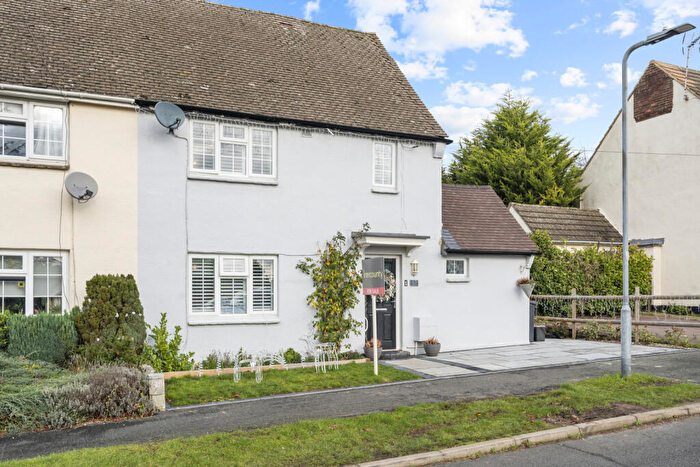
Houses for sale & to rent in Thaxted, Dunmow
House Prices in Thaxted
Properties in Thaxted have an average house price of £510,902.00 and had 97 Property Transactions within the last 3 years¹.
Thaxted is an area in Dunmow, Essex with 1,254 households², where the most expensive property was sold for £1,750,000.00.
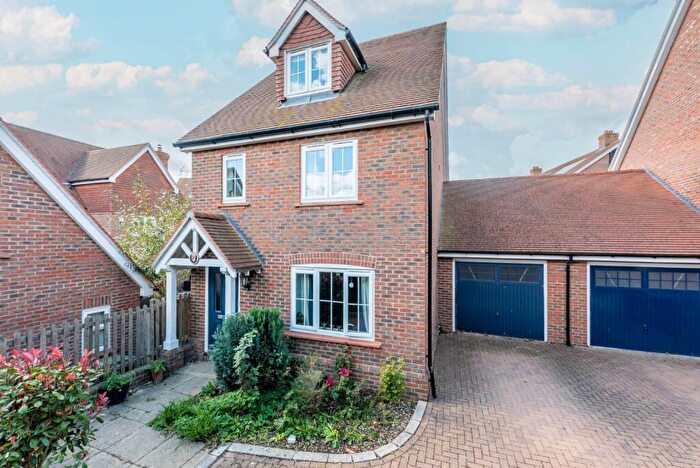
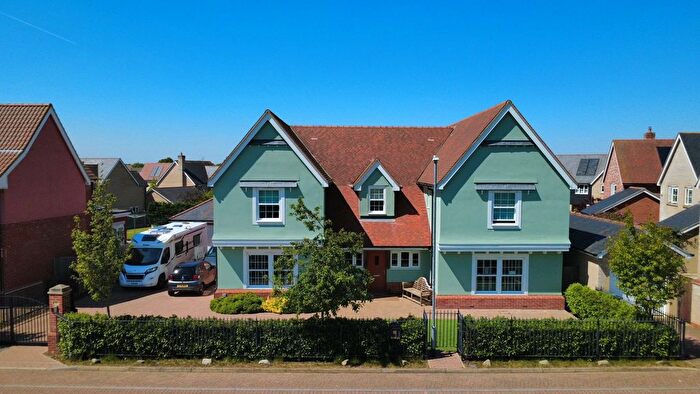
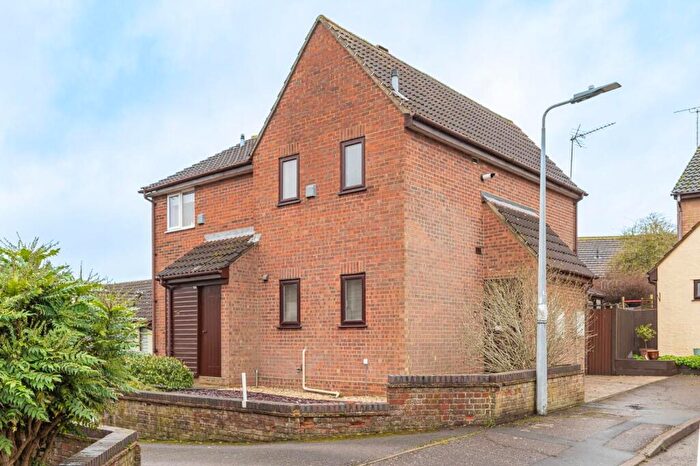
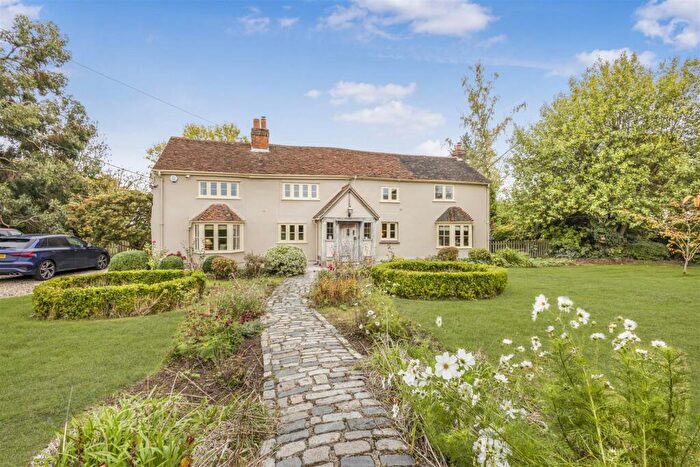
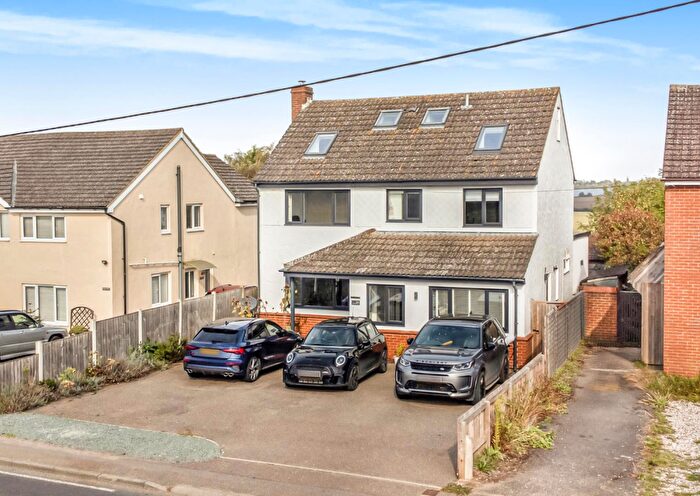
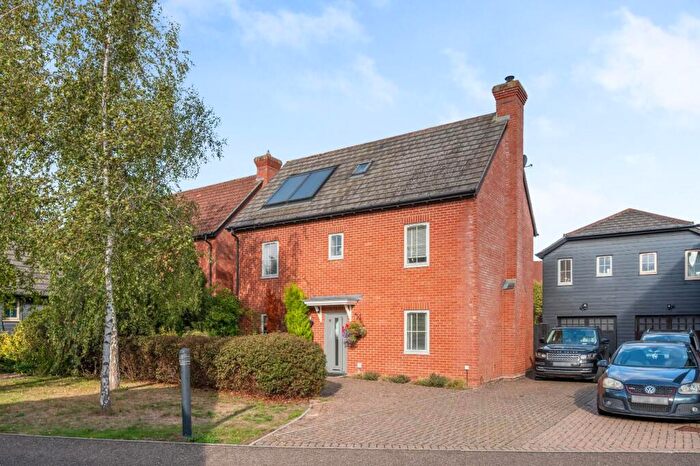
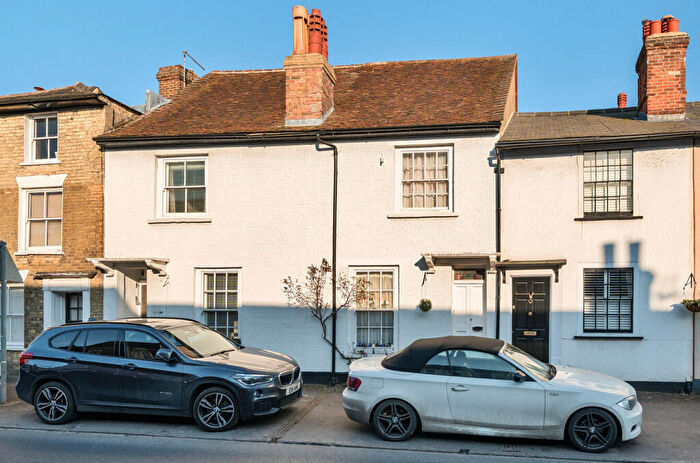
Properties for sale in Thaxted
Roads and Postcodes in Thaxted
Navigate through our locations to find the location of your next house in Thaxted, Dunmow for sale or to rent.
| Streets | Postcodes |
|---|---|
| Abbey View | CM6 2EA CM6 2EB |
| Aldborough Court | CM6 2PA |
| Bardfield End Green | CM6 3PX CM6 3PY CM6 3PZ CM6 3QA |
| Bardfield Road | CM6 2LP CM6 2LR CM6 2LW CM6 3PU |
| Barnards Field | CM6 2LY |
| Bellrope Meadow | CM6 2FE |
| Blamsters Rise | CM6 3PW |
| Bolford Street | CM6 2PY |
| Boyton End | CM6 2RB CM6 2RD |
| Brook View | CM6 2LX |
| Bull Ring | CM6 2PL |
| Clare Court | CM6 2RN |
| Claypits Villas | CM6 2LN |
| Copthall Lane | CM6 2LF CM6 2LG CM6 2RP |
| Cutlers Green | CM6 2PZ CM6 2QA CM6 2QD CM6 2QF |
| Dunmow Road | CM6 2LU CM6 2NX CM6 3QD |
| Duton Hill | CM6 2DX CM6 2DY CM6 2DZ |
| Fishmarket Street | CM6 2PG |
| Folly Mill Lane | CM6 2NP CM6 2NW |
| Gallows Green | CM6 3QS |
| Guelphs Lane | CM6 2PT |
| Hanchetts Orchard | CM6 2JT |
| Little Cambridge | CM6 3QU |
| Magdalen Green | CM6 2LJ |
| Margaret Street | CM6 2QN |
| Mayes Place | CM6 2NT |
| Mill End | CM6 2LT |
| Mill Row | CM6 2PQ |
| Monk Street | CM6 2NR CM6 3QE |
| Newbiggen Street | CM6 2EZ CM6 2QR CM6 2QS CM6 2QT CM6 2QU |
| Orange Street | CM6 2LH CM6 2LQ CM6 2RS |
| Orchard Close | CM6 2JX |
| Park Street | CM6 2ND CM6 2NE CM6 2QJ |
| Radleys End | CM6 3PT |
| Richmonds Green | CM6 3QF |
| Rochelle Close | CM6 2PX |
| Rose Cottages | CM6 2DT |
| Sibleys Lane | CM6 2NU |
| South View | CM6 2PS |
| St Clements | CM6 2LL |
| Stanbrook | CM6 2NG CM6 2NH CM6 2NJ CM6 2NN CM6 2NQ |
| Star Mead | CM6 2NF |
| Stoney Lane | CM6 2PF |
| The Drive | CM6 2UY |
| The Lees | CM6 2LZ |
| The Maltings | CM6 2NB |
| The Maypole | CM6 2QZ |
| Town Street | CM6 2LA CM6 2LB CM6 2LD |
| Townfield | CM6 2JU |
| Vicarage Lane | CM6 2QP |
| Wainsfield Villas | CM6 2LS |
| Walden Road | CM6 2RG |
| Watling Lane | CM6 2QX CM6 2QY CM6 2RA |
| Watling Street | CM6 2PE |
| Weaverhead Close | CM6 2PP CM6 2PR CM6 2PW |
| Weaverhead Lane | CM6 2LE CM6 2PN |
| Wedow Road | CM6 2JY CM6 2JZ |
| Wolsleys Chase | CM6 2DU |
Transport near Thaxted
-
Elsenham Station
-
Stansted Airport Station
-
Newport (Essex) Station
-
Stansted Mountfitchet Station
-
Audley End Station
-
Bishops Stortford Station
- FAQ
- Price Paid By Year
- Property Type Price
Frequently asked questions about Thaxted
What is the average price for a property for sale in Thaxted?
The average price for a property for sale in Thaxted is £510,902. This amount is 3% higher than the average price in Dunmow. There are 479 property listings for sale in Thaxted.
What streets have the most expensive properties for sale in Thaxted?
The streets with the most expensive properties for sale in Thaxted are Gallows Green at an average of £1,340,000, Boyton End at an average of £1,200,000 and Bardfield End Green at an average of £1,045,000.
What streets have the most affordable properties for sale in Thaxted?
The streets with the most affordable properties for sale in Thaxted are Abbey View at an average of £275,000, Barnards Field at an average of £279,500 and Orange Street at an average of £285,000.
Which train stations are available in or near Thaxted?
Some of the train stations available in or near Thaxted are Elsenham, Stansted Airport and Newport (Essex).
Property Price Paid in Thaxted by Year
The average sold property price by year was:
| Year | Average Sold Price | Price Change |
Sold Properties
|
|---|---|---|---|
| 2025 | £558,375 | 9% |
20 Properties |
| 2024 | £507,034 | 4% |
43 Properties |
| 2023 | £487,867 | -29% |
34 Properties |
| 2022 | £630,257 | 24% |
35 Properties |
| 2021 | £476,373 | 3% |
69 Properties |
| 2020 | £460,004 | 4% |
50 Properties |
| 2019 | £440,263 | 10% |
43 Properties |
| 2018 | £395,309 | -4% |
38 Properties |
| 2017 | £409,155 | 0,3% |
54 Properties |
| 2016 | £408,065 | 1% |
68 Properties |
| 2015 | £405,813 | 28% |
59 Properties |
| 2014 | £291,383 | -29% |
42 Properties |
| 2013 | £376,737 | 13% |
42 Properties |
| 2012 | £327,624 | 0,2% |
48 Properties |
| 2011 | £326,903 | -5% |
42 Properties |
| 2010 | £341,819 | 7% |
52 Properties |
| 2009 | £319,107 | 1% |
53 Properties |
| 2008 | £315,229 | 8% |
56 Properties |
| 2007 | £289,621 | -0,1% |
72 Properties |
| 2006 | £289,845 | 14% |
72 Properties |
| 2005 | £250,522 | -1% |
49 Properties |
| 2004 | £252,435 | 12% |
55 Properties |
| 2003 | £221,642 | -13% |
59 Properties |
| 2002 | £250,978 | 27% |
67 Properties |
| 2001 | £183,423 | 7% |
64 Properties |
| 2000 | £169,704 | 5% |
53 Properties |
| 1999 | £161,535 | 9% |
63 Properties |
| 1998 | £146,719 | 18% |
50 Properties |
| 1997 | £119,959 | 19% |
62 Properties |
| 1996 | £96,748 | -2% |
76 Properties |
| 1995 | £98,353 | - |
40 Properties |
Property Price per Property Type in Thaxted
Here you can find historic sold price data in order to help with your property search.
The average Property Paid Price for specific property types in the last three years are:
| Property Type | Average Sold Price | Sold Properties |
|---|---|---|
| Semi Detached House | £422,896.00 | 29 Semi Detached Houses |
| Detached House | £623,336.00 | 49 Detached Houses |
| Terraced House | £356,666.00 | 18 Terraced Houses |
| Flat | £330,000.00 | 1 Flat |

