
Houses for sale in Bumpstead, Halstead
House Prices in Bumpstead
Properties in Bumpstead have an average house price of £310k and had 1 Property Transaction within the last 3 years¹.
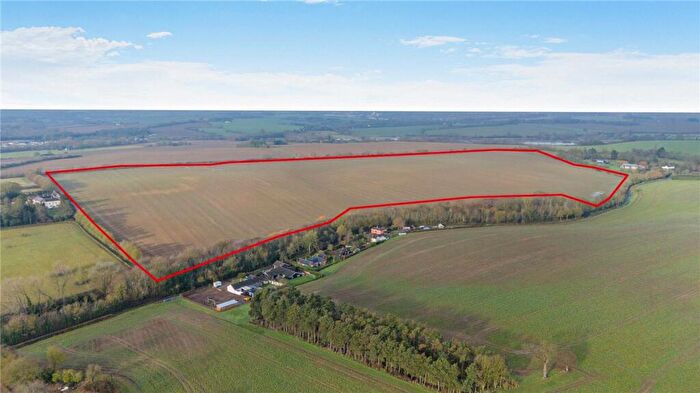
Bumpstead is an area in Halstead, Essex with 39 households², where the most expensive property was sold for £310k.
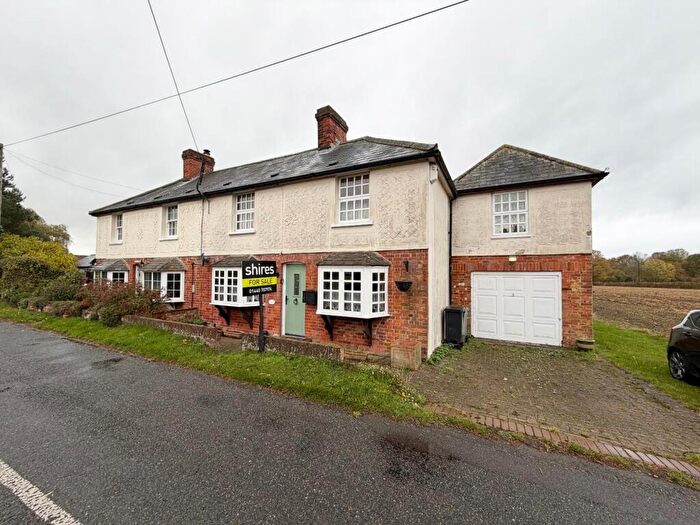
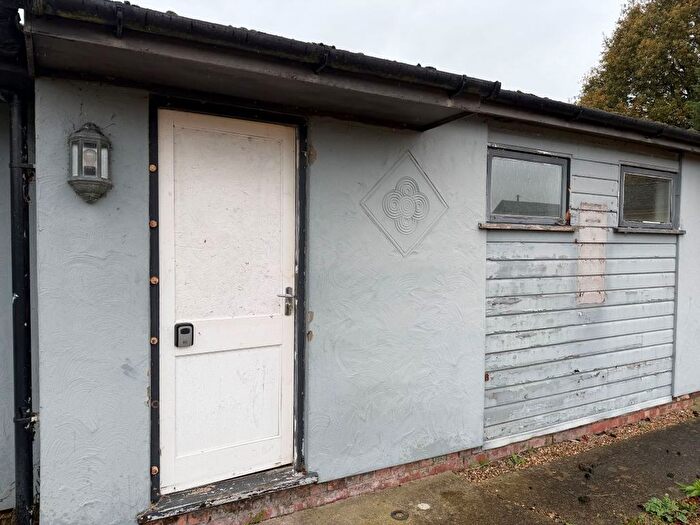
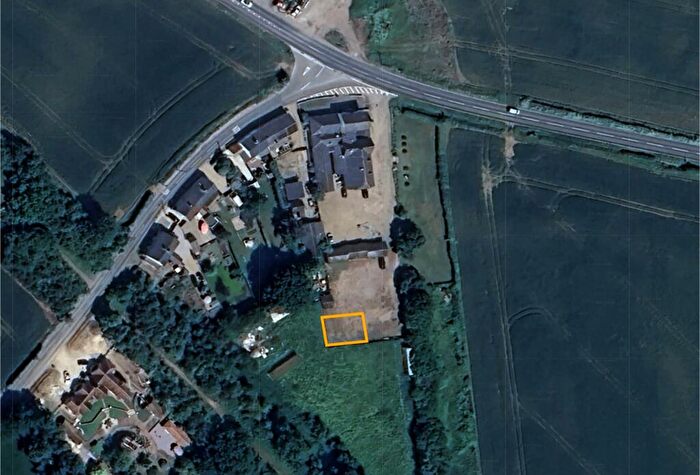
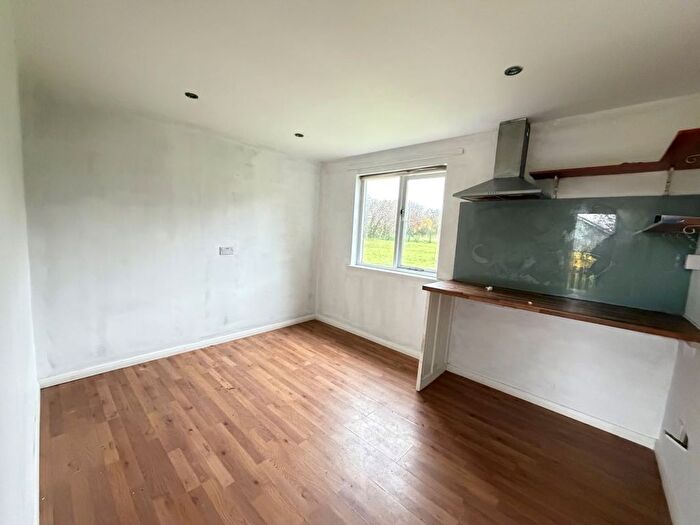
Properties for sale in Bumpstead
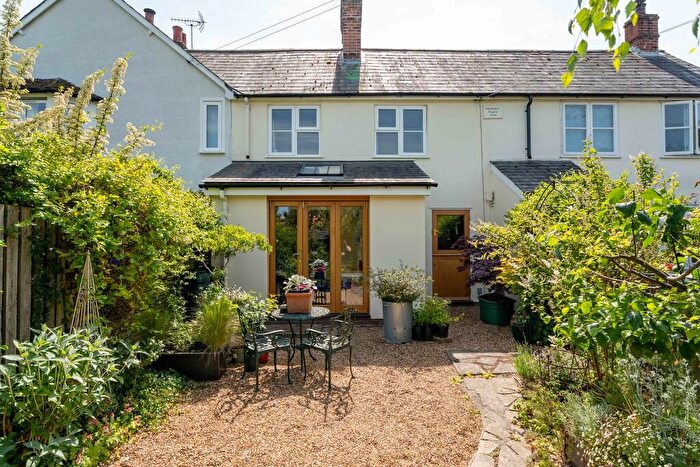
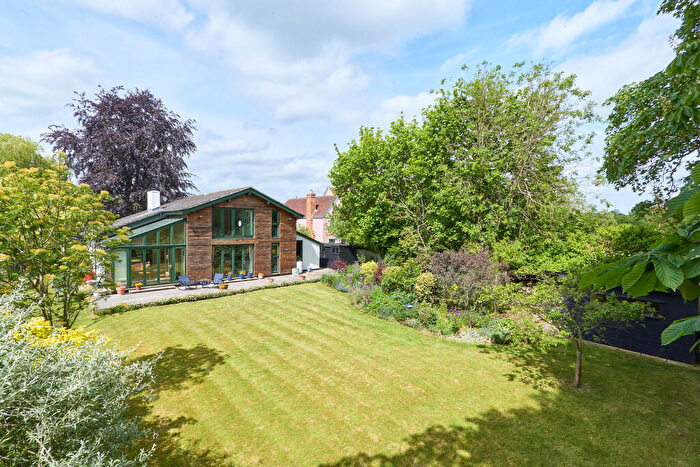


![]()
If you are looking to sell your house, let it out, or receive a property valuation, an expert can help you.
Click the button below to get started.
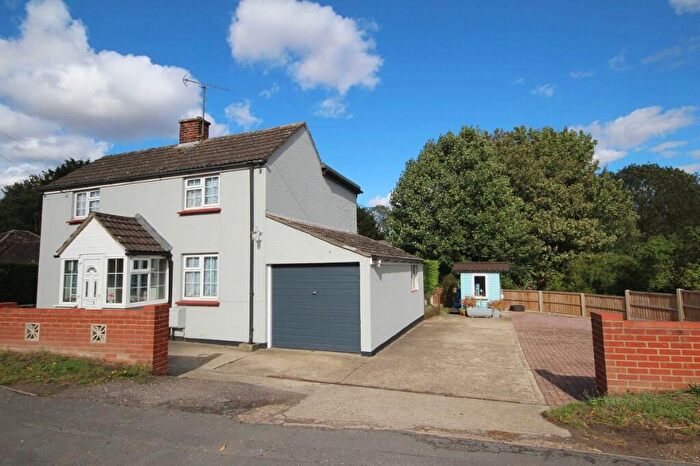
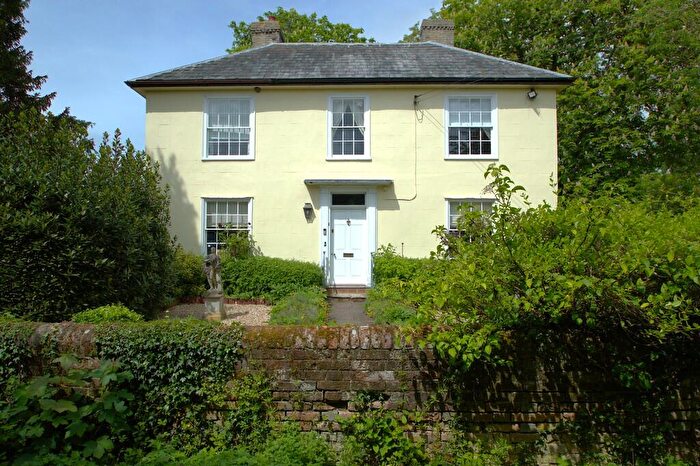
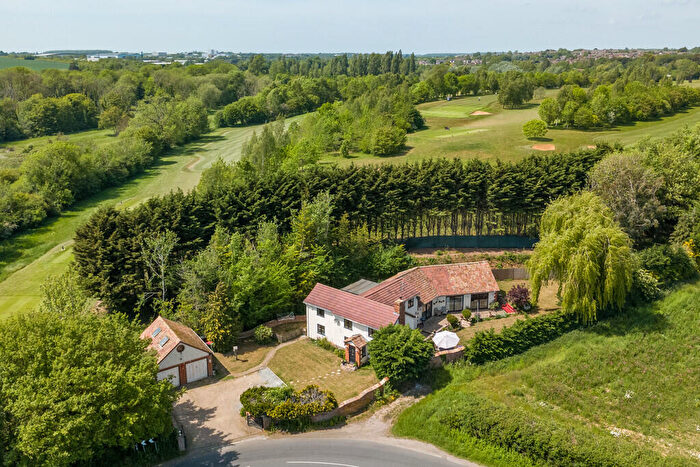
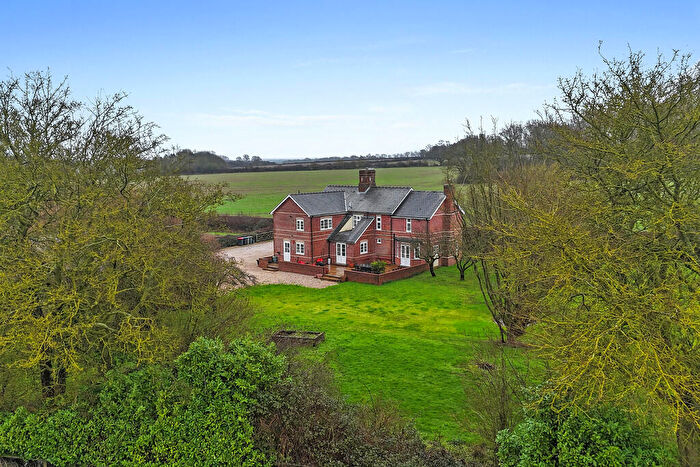
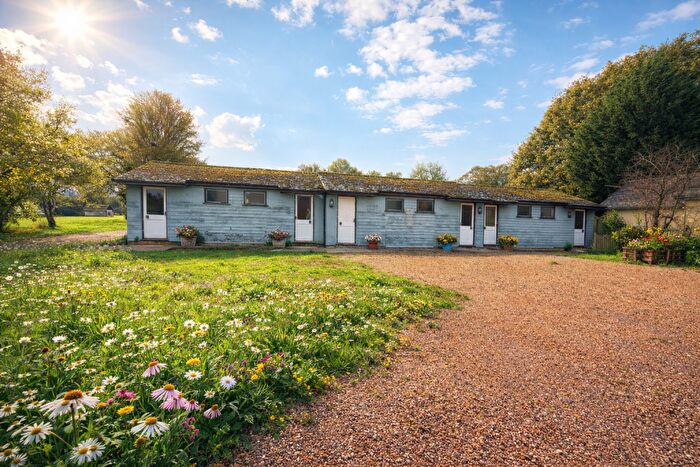
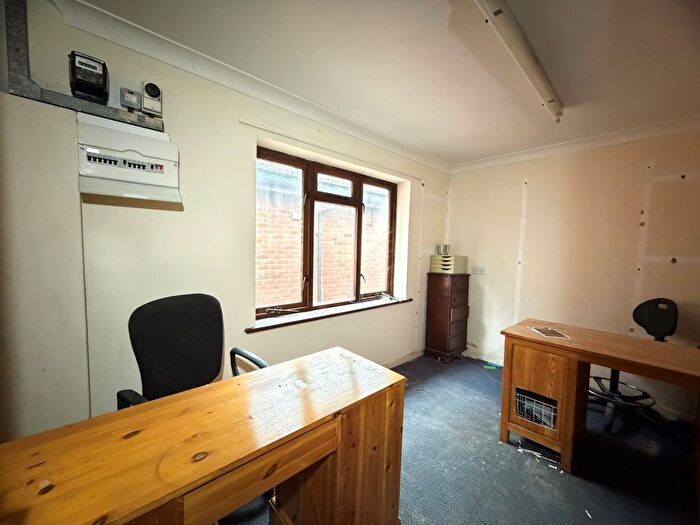
Previously listed properties in Bumpstead

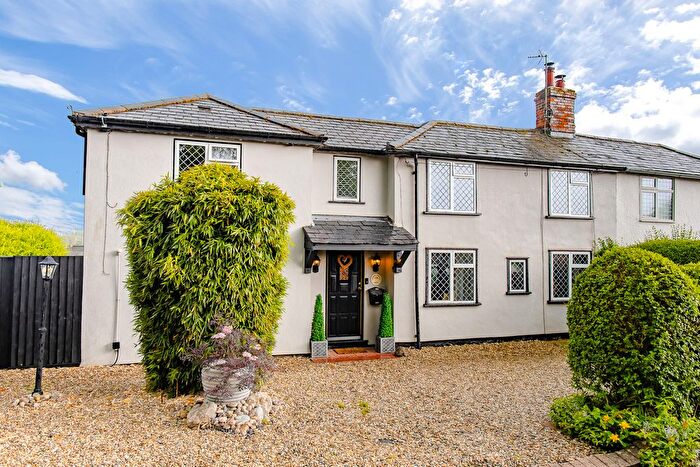
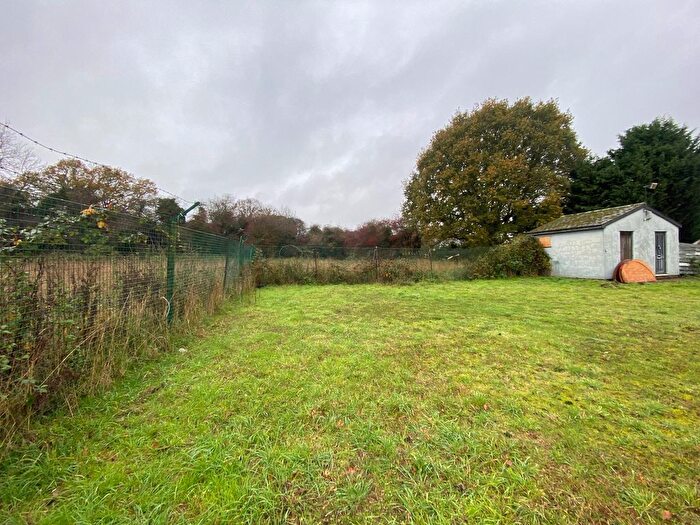
![]()
If you are looking to sell your house, let it out, or receive a property valuation, an expert can help you.
Click the button below to get started.

Roads and Postcodes in Bumpstead
Navigate through our locations to find the location of your next house in Bumpstead, Halstead for sale or to rent.
| Streets | Postcodes |
|---|---|
| Baythorne End | CO9 4AG CO9 4AH |
| Birdbrook Road | CO9 4PA |
| Fordwater Close | CO9 4BS |
| Moyns Park | CO9 4BP |
| The Bungalows | CO9 4AD |
| The Street | CO9 4BL |
| CO9 4BT CO9 4BX |
Property price trends in Bumpstead
According to the latest Land Registry data, the average home in Bumpstead sold for £310,000 in 2024. That figure comes from 7 sales logged over the past 18 years.
Prices have fallen back over the last three years. Compared with 2021, when the typical sale came in around £515,000, that's a fall of roughly 39.8%.
Zoom out to the past decade for the fuller picture. Back in 2013, homes here averaged £163,000, so the typical sold price has climbed about 90.2% since then, roughly 6% a year. Stretch the view to fifteen years and that annual pace eases back to about 4.5%.
Frequently asked questions about Bumpstead
What is the average price for a property for sale in Bumpstead?
The average price for a property for sale in Bumpstead is £310,000. This amount is 14% lower than the average price in Halstead. There are 106 property listings for sale in Bumpstead.
Which train stations are available in or near Bumpstead?
Some of the train stations available in or near Bumpstead are Sudbury, Braintree and Dullingham.
Property Price Paid in Bumpstead by Year
The average sold property price by year was:
| Year | Average Sold Price | Price Change |
Sold Properties
|
|---|---|---|---|
| 2024 | £310,000 | -66% |
1 Property |
| 2021 | £515,000 | 68% |
1 Property |
| 2013 | £163,000 | 8% |
1 Property |
| 2012 | £150,475 | -6% |
2 Properties |
| 2009 | £160,000 | -138% |
1 Property |
| 2006 | £380,000 | - |
1 Property |
Property Price per Property Type in Bumpstead
Here you can find historic sold price data in order to help with your property search.
The average Property Paid Price for specific property types in the last three years are:
| Property Type | Average Sold Price | Sold Properties |
|---|---|---|
| Detached House | £310,000.00 | 1 Detached House |
