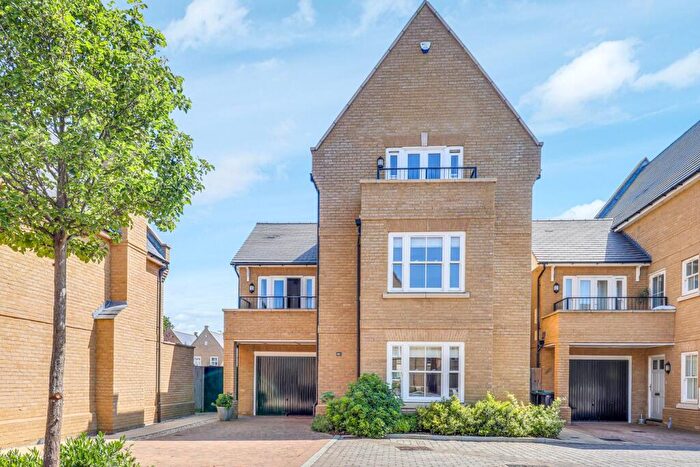
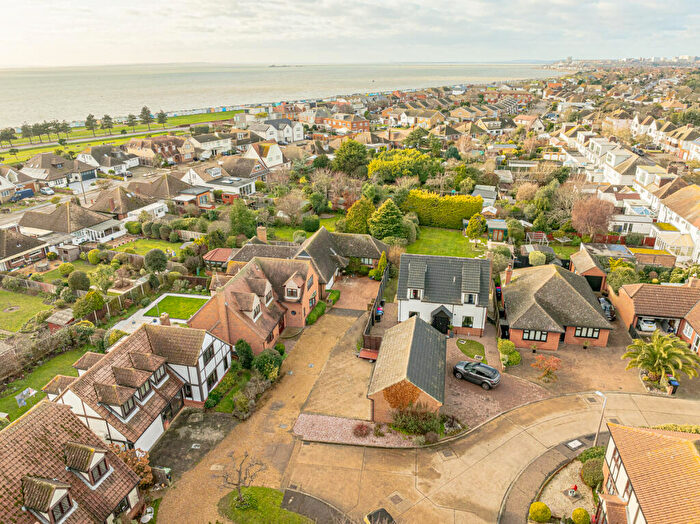
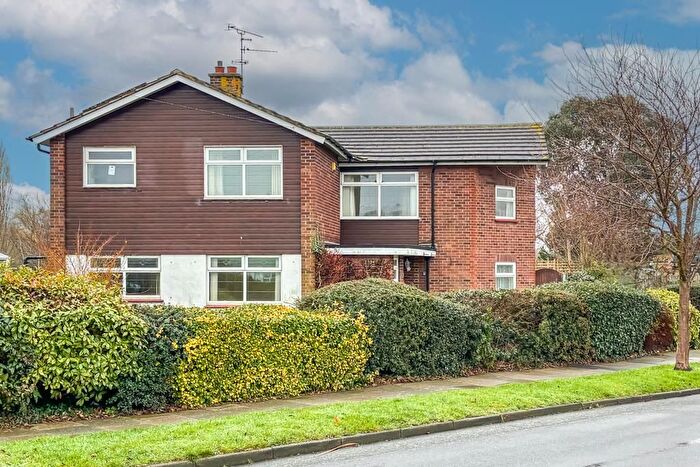
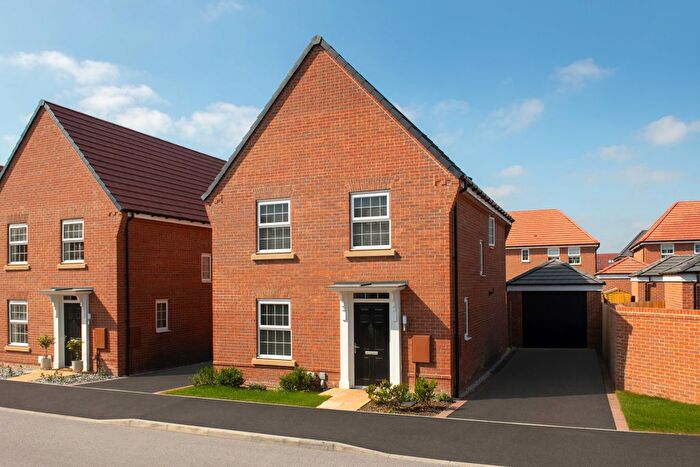
Houses for sale & to rent in Foulness and The Wakerings, Southend-on-sea
House Prices in Foulness and The Wakerings
Properties in Foulness and The Wakerings have an average house price of £361,198.00 and had 53 Property Transactions within the last 3 years¹.
Foulness and The Wakerings is an area in Southend-on-sea, Essex with 135 households², where the most expensive property was sold for £527,000.00.
Properties for sale in Foulness and The Wakerings
Roads and Postcodes in Foulness and The Wakerings
Navigate through our locations to find the location of your next house in Foulness and The Wakerings, Southend-on-sea for sale or to rent.
| Streets | Postcodes |
|---|---|
| Barrow Hall Road | SS3 0QS SS3 0QT |
| Boar Street | SS3 0GH |
| Brick Road | SS3 0FQ |
| Bullmans Wharf | SS3 0DA |
| Churchfields | SS3 9XL |
| Court End | SS3 9XT |
| Crouchmans Avenue | SS3 0DQ |
| Foulness Island | SS3 9XD SS3 9XF SS3 9XG SS3 9XH SS3 9XJ SS3 9XN SS3 9XW SS3 9XE |
| High Street | SS3 0HU SS3 0EG |
| Kiln Way | SS3 0FP |
| Kingfisher Street | SS3 0FS |
| Little Wakering Hall Lane | SS3 0HG SS3 0HH SS3 0HQ |
| Little Wakering Wick Cottages | SS3 0JJ |
| Minnow Lane | SS3 0FU |
| New Road | SS3 0AW SS3 0DJ |
| Nursehound Drive | SS3 0GG |
| Orchard Close | SS3 0EW |
| Potton Island | SS3 0BY |
| Poynters Lane | SS3 9TT SS3 9TU |
| Sandy Crescent | SS3 0FN |
| Shallows Avenue | SS3 0FR |
| Southend Road | SS3 0PS SS3 0PT |
| Star Lane | SS3 0FL |
| Star Lane Industrial Estate | SS3 0FF |
| The Chase | SS3 9XS |
| The Common | SS3 0BP SS3 0BS SS3 0BX |
| The Evergreens | SS3 0JR |
| Turbot Drive | SS3 0GF |
| Waters Grove | SS3 0FT |
| White City | SS3 9XR |
| York Mews | SS3 0FA |
| SS3 0JL |
Transport near Foulness and The Wakerings
- FAQ
- Price Paid By Year
- Property Type Price
Frequently asked questions about Foulness and The Wakerings
What is the average price for a property for sale in Foulness and The Wakerings?
The average price for a property for sale in Foulness and The Wakerings is £361,198. This amount is 1% lower than the average price in Southend-on-sea. There are 7,801 property listings for sale in Foulness and The Wakerings.
What streets have the most expensive properties for sale in Foulness and The Wakerings?
The streets with the most expensive properties for sale in Foulness and The Wakerings are Kingfisher Street at an average of £451,500, Shallows Avenue at an average of £407,748 and York Mews at an average of £350,000.
What streets have the most affordable properties for sale in Foulness and The Wakerings?
The streets with the most affordable properties for sale in Foulness and The Wakerings are Kiln Way at an average of £313,400, Brick Road at an average of £338,500 and Sandy Crescent at an average of £340,900.
Which train stations are available in or near Foulness and The Wakerings?
Some of the train stations available in or near Foulness and The Wakerings are Shoeburyness, Thorpe Bay and Southend East.
Property Price Paid in Foulness and The Wakerings by Year
The average sold property price by year was:
| Year | Average Sold Price | Price Change |
Sold Properties
|
|---|---|---|---|
| 2025 | £394,125 | 3% |
4 Properties |
| 2024 | £381,458 | 8% |
12 Properties |
| 2023 | £350,769 | -0,1% |
13 Properties |
| 2022 | £351,228 | -12% |
24 Properties |
| 2021 | £393,096 | 12% |
61 Properties |
| 2020 | £344,717 | -9% |
25 Properties |
| 2019 | £376,855 | 6% |
32 Properties |
| 2018 | £355,663 | 16% |
18 Properties |
| 2017 | £298,592 | 6% |
67 Properties |
| 2016 | £280,212 | 15% |
23 Properties |
| 2015 | £237,363 | 6% |
11 Properties |
| 2014 | £224,000 | - |
2 Properties |
Property Price per Property Type in Foulness and The Wakerings
Here you can find historic sold price data in order to help with your property search.
The average Property Paid Price for specific property types in the last three years are:
| Property Type | Average Sold Price | Sold Properties |
|---|---|---|
| Semi Detached House | £334,958.00 | 24 Semi Detached Houses |
| Detached House | £444,749.00 | 18 Detached Houses |
| Terraced House | £300,142.00 | 7 Terraced Houses |
| Flat | £249,500.00 | 4 Flats |


