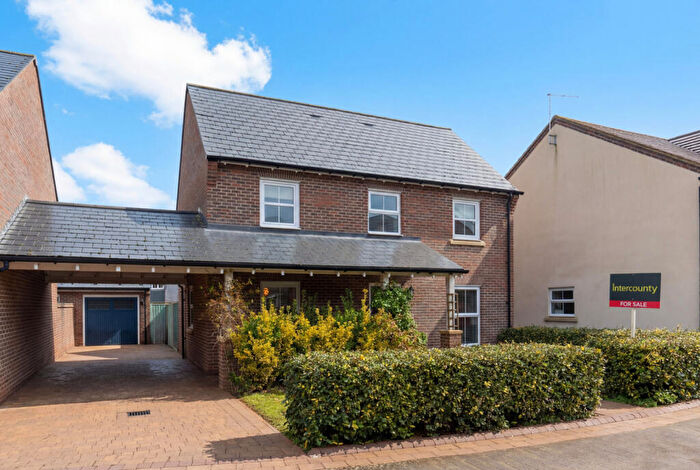
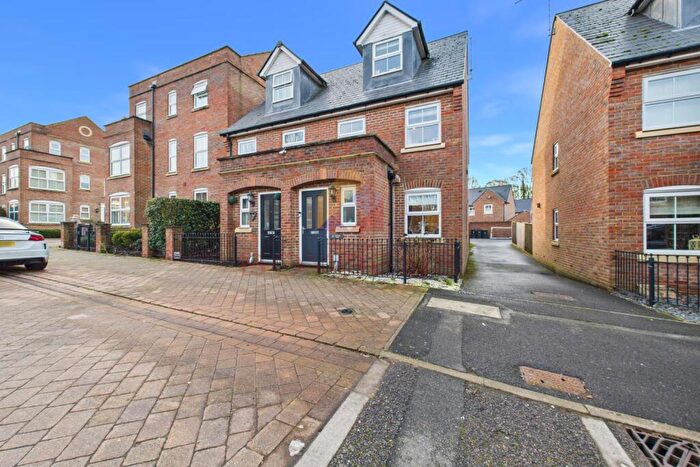
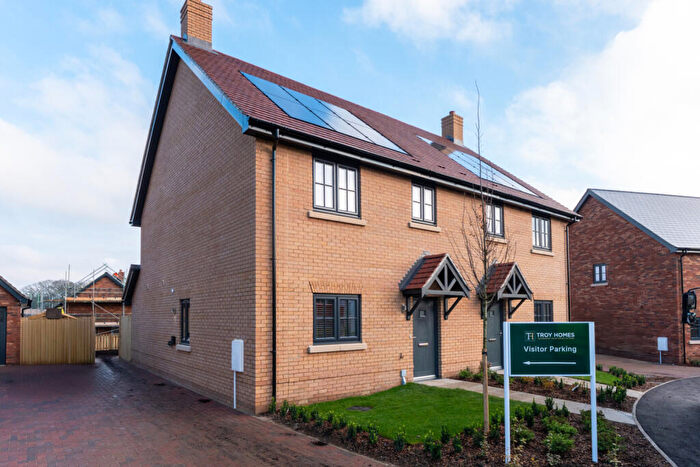
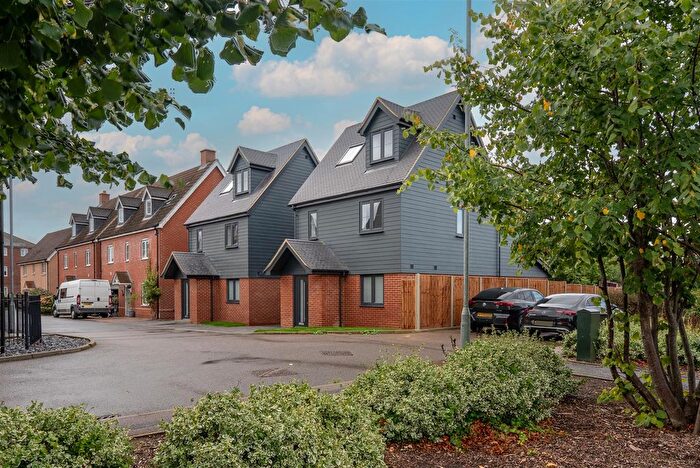
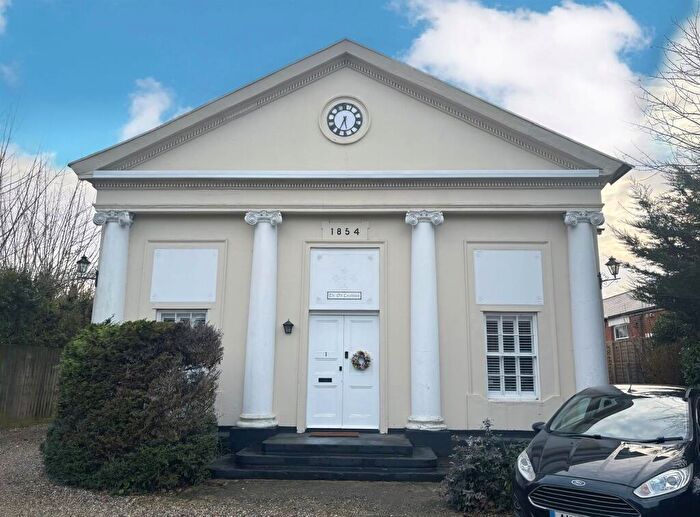
Houses for sale & to rent in Stansted South, Stansted
House Prices in Stansted South
Properties in Stansted South have an average house price of £407,131.00 and had 155 Property Transactions within the last 3 years¹.
Stansted South is an area in Stansted, Essex with 1,261 households², where the most expensive property was sold for £2,000,000.00.
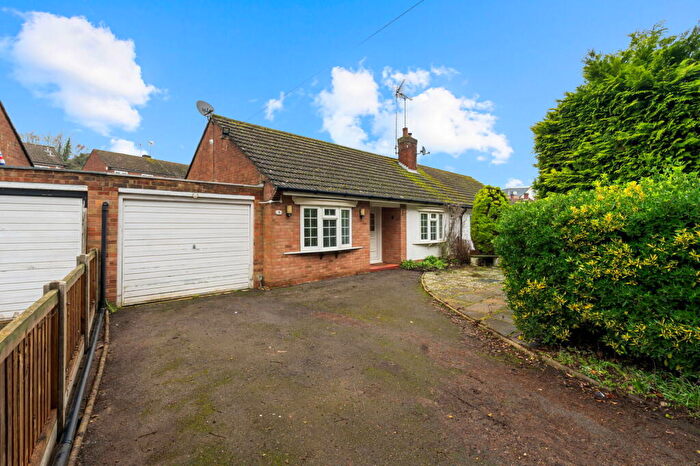
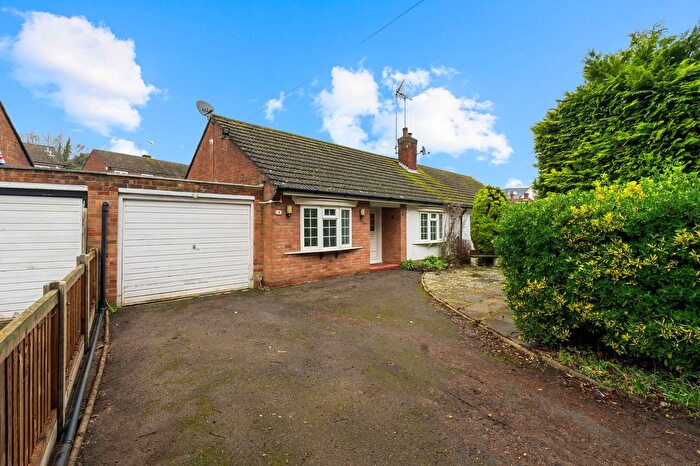
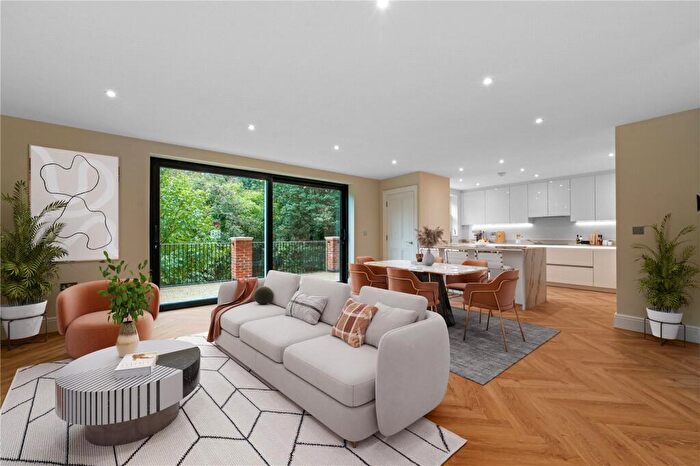
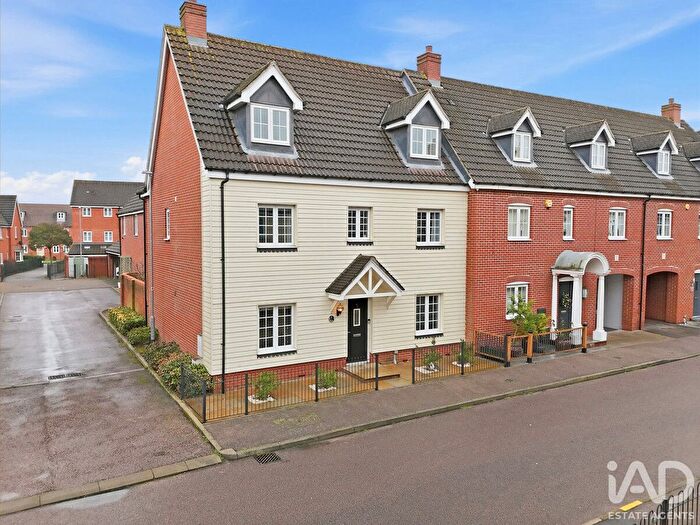
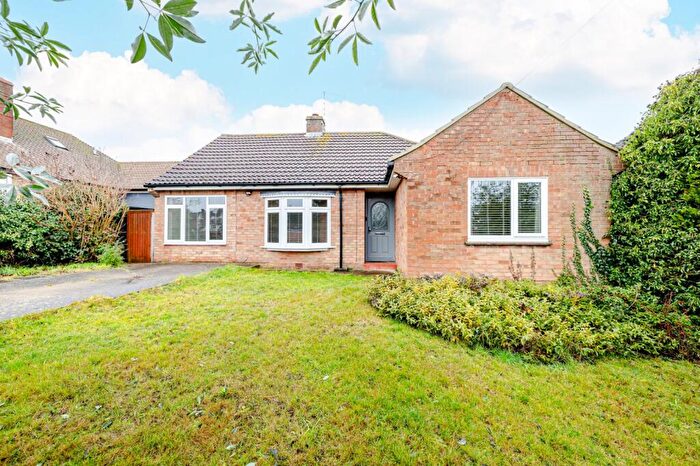
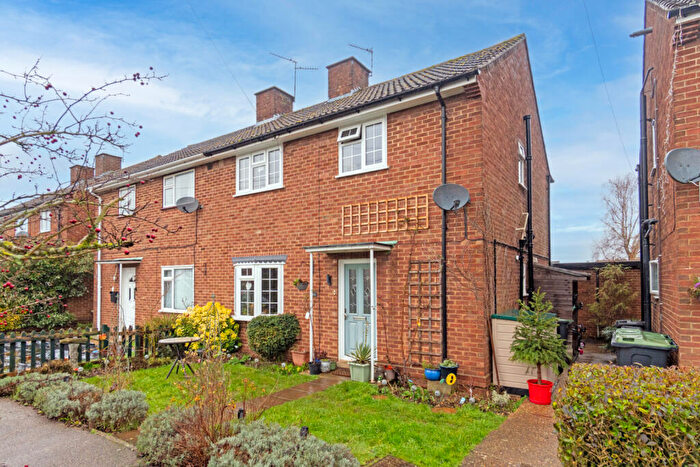
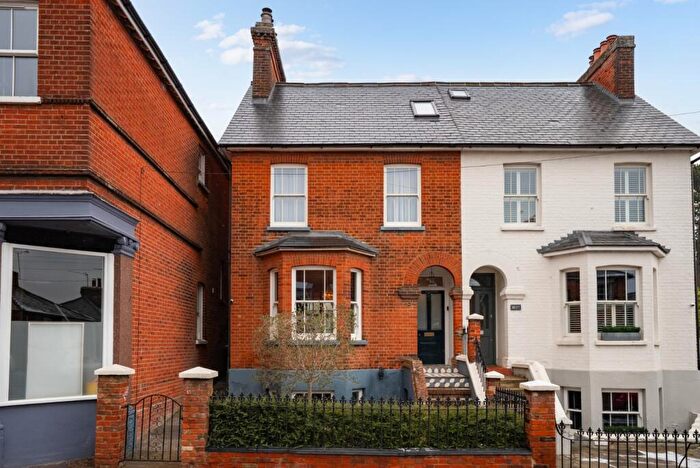
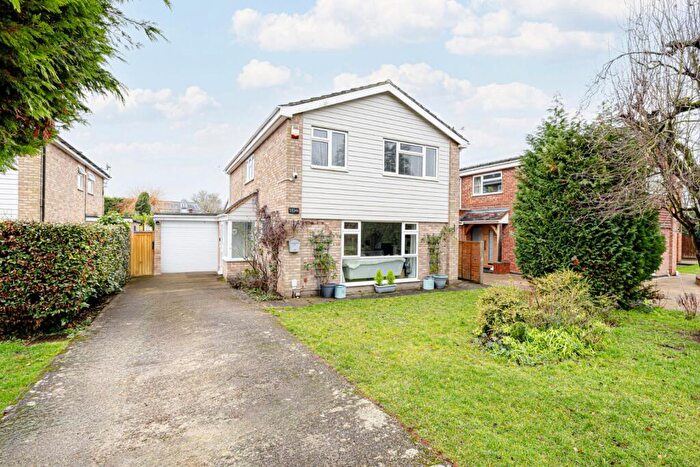
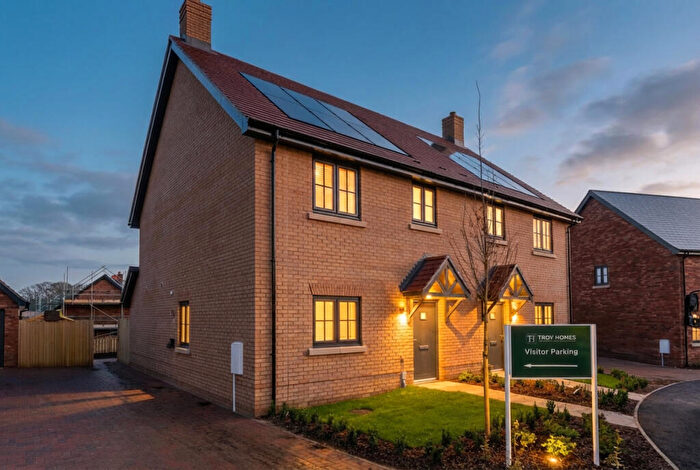
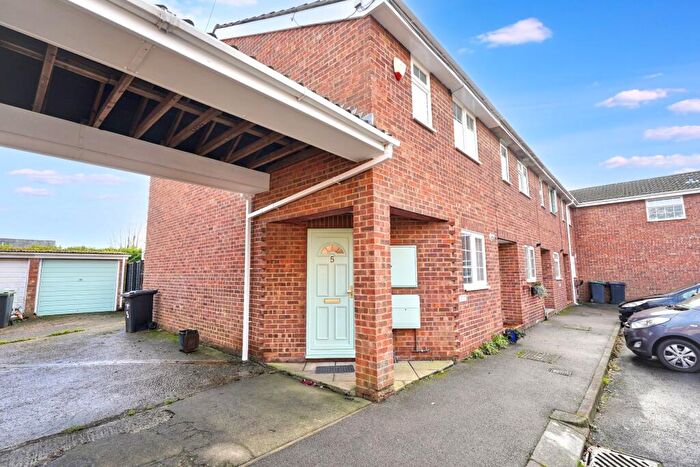
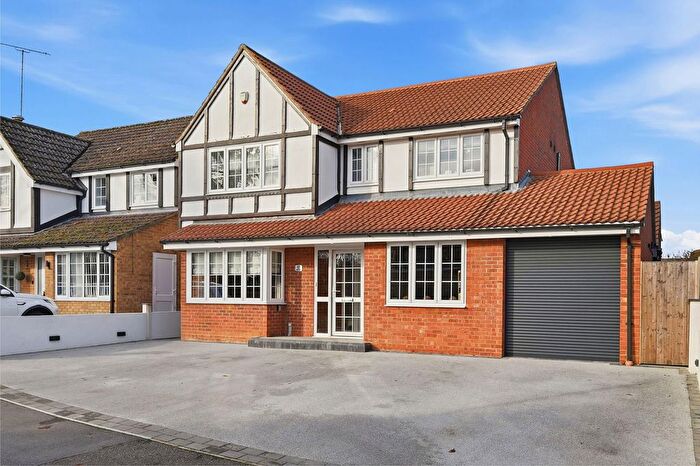
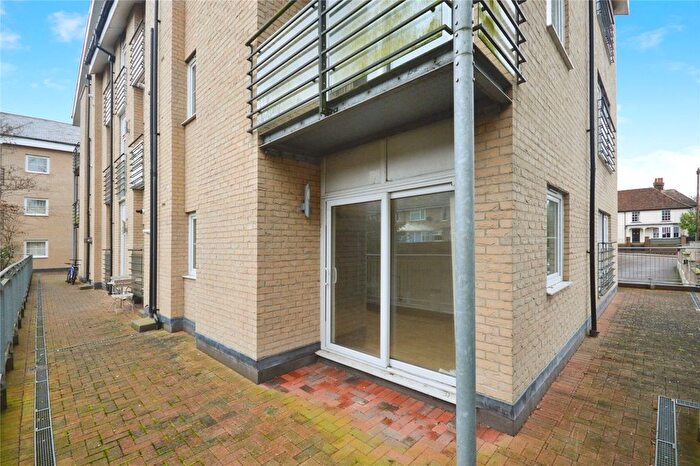
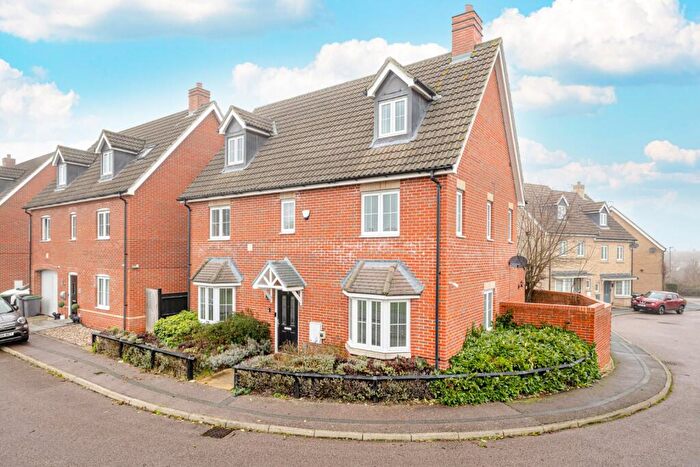
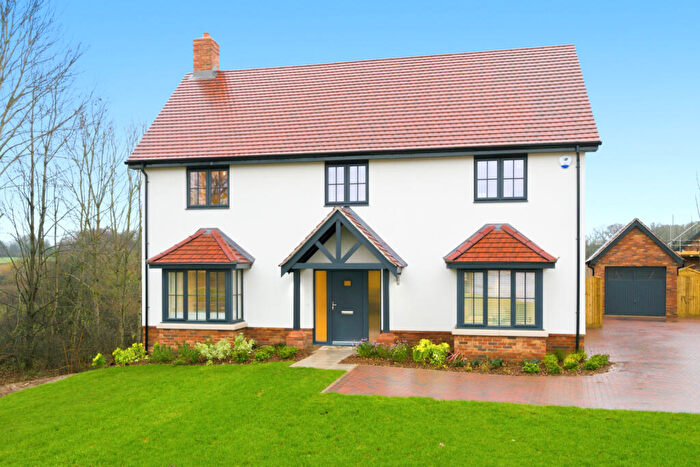
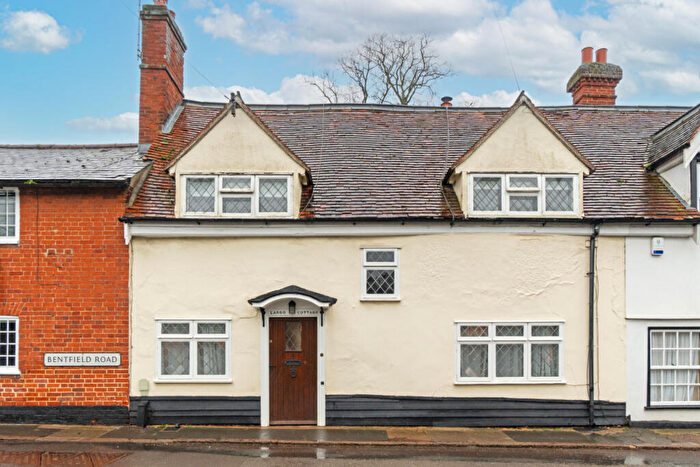
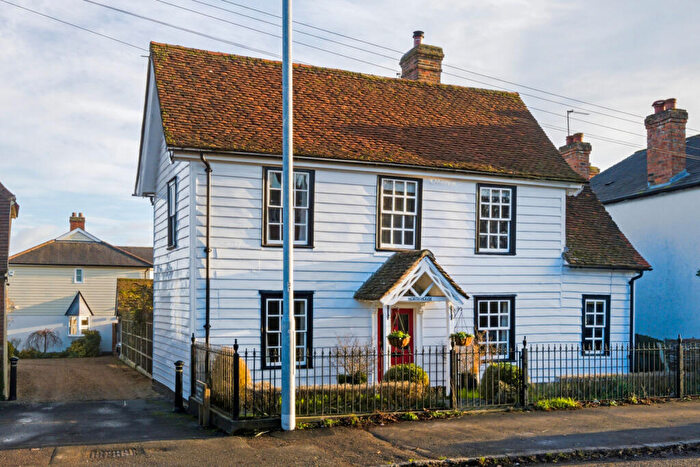
Properties for sale in Stansted South
Roads and Postcodes in Stansted South
Navigate through our locations to find the location of your next house in Stansted South, Stansted for sale or to rent.
| Streets | Postcodes |
|---|---|
| Bakery Court | CM24 8HF |
| Bentfield Road | CM24 8JL CM24 8JN |
| Blythwood Gardens | CM24 8HG CM24 8HH CM24 8HQ |
| Brook Road | CM24 8BB |
| Brook View | CM24 8ES |
| Burton End | CM24 8UD CM24 8UE CM24 8UF CM24 8UL CM24 8UQ |
| Cannons Mead | CM24 8EL |
| Chapel Hill | CM24 8AA CM24 8AB CM24 8AD CM24 8AE |
| Church Road | CM24 8PY CM24 8PZ CM24 8QB |
| Churchfields | CM24 8RJ |
| Churchill Corner | CM24 8UA |
| Dockerell Road | CM24 8FF |
| Forest Hall Road | CM24 8TX |
| Haggerwood Way | CM24 8FY |
| Harbridge Close | CM24 8FD |
| Herrington Avenue | CM24 8FR |
| Jordon Close | CM24 8SH |
| Maitland Road | CM24 8NT CM24 8NU |
| Manor Road | CM24 8NJ CM24 8NL |
| Mill Hill | CM24 8BS |
| Millfields | CM24 8AS |
| Millside | CM24 8BL |
| Mount Drive | CM24 8NY CM24 8NZ |
| Mountfitchet Road | CM24 8NN CM24 8NP CM24 8NW |
| Old Bell Close | CM24 8JJ |
| Palmer Close | CM24 8FB |
| Park Road | CM24 8PB |
| Peachey Walk | CM24 8EZ |
| Pines Hill | CM24 8TB |
| Priory Drive | CM24 8NR |
| Recreation Ground | CM24 8BD |
| Rochford Close | CM24 8LZ |
| Sanders Close | CM24 8GY |
| Sandford Road | CM24 8FQ |
| Silver Street | CM24 8FG CM24 8FH CM24 8GA CM24 8HA CM24 8HB CM24 8HD CM24 8HE |
| Spencer Close | CM24 8AN |
| St Marys Drive | CM24 8NS |
| Station Road | CM24 8BE |
| Stoney Common | CM24 8NE CM24 8NF CM24 8NH |
| Stoney Common Road | CM24 8ND |
| Stoney Place | CM24 8PE |
| Stoneyfield Drive | CM24 8PA |
| Sunnyside | CM24 8AU CM24 8AX |
| The Meads | CM24 8QA |
| Water Lane | CM24 8BJ |
| Waterside | CM24 8BH |
| West Road | CM24 8NG CM24 8NQ |
| Windmill Close | CM24 8GH |
| Woodfield Close | CM24 8BA |
| Woodfield Terrace | CM24 8AJ |
| Woodfields | CM24 8AL CM24 8AR |
Transport near Stansted South
- FAQ
- Price Paid By Year
- Property Type Price
Frequently asked questions about Stansted South
What is the average price for a property for sale in Stansted South?
The average price for a property for sale in Stansted South is £407,131. This amount is 12% lower than the average price in Stansted. There are 391 property listings for sale in Stansted South.
What streets have the most expensive properties for sale in Stansted South?
The streets with the most expensive properties for sale in Stansted South are Church Road at an average of £1,450,000, Forest Hall Road at an average of £810,000 and Old Bell Close at an average of £670,000.
What streets have the most affordable properties for sale in Stansted South?
The streets with the most affordable properties for sale in Stansted South are Bentfield Road at an average of £233,500, Stoney Place at an average of £252,500 and Silver Street at an average of £277,208.
Which train stations are available in or near Stansted South?
Some of the train stations available in or near Stansted South are Stansted Mountfitchet, Elsenham and Bishops Stortford.
Property Price Paid in Stansted South by Year
The average sold property price by year was:
| Year | Average Sold Price | Price Change |
Sold Properties
|
|---|---|---|---|
| 2025 | £478,698 | 27% |
56 Properties |
| 2024 | £350,590 | -11% |
58 Properties |
| 2023 | £389,365 | -13% |
41 Properties |
| 2022 | £441,429 | 8% |
50 Properties |
| 2021 | £406,649 | 16% |
75 Properties |
| 2020 | £342,624 | -1% |
50 Properties |
| 2019 | £347,659 | -13% |
66 Properties |
| 2018 | £394,193 | 4% |
63 Properties |
| 2017 | £379,679 | 17% |
64 Properties |
| 2016 | £314,369 | 1% |
75 Properties |
| 2015 | £311,079 | 13% |
87 Properties |
| 2014 | £272,020 | 1% |
71 Properties |
| 2013 | £268,098 | -6% |
61 Properties |
| 2012 | £284,164 | 10% |
60 Properties |
| 2011 | £255,374 | -1% |
74 Properties |
| 2010 | £256,901 | -4% |
60 Properties |
| 2009 | £266,943 | -4% |
77 Properties |
| 2008 | £278,787 | 9% |
64 Properties |
| 2007 | £254,136 | 20% |
117 Properties |
| 2006 | £203,992 | -5% |
108 Properties |
| 2005 | £214,737 | -3% |
75 Properties |
| 2004 | £220,916 | 9% |
85 Properties |
| 2003 | £201,945 | 8% |
116 Properties |
| 2002 | £186,143 | 24% |
117 Properties |
| 2001 | £141,000 | 19% |
103 Properties |
| 2000 | £114,474 | 20% |
71 Properties |
| 1999 | £91,663 | 9% |
118 Properties |
| 1998 | £83,030 | -9% |
92 Properties |
| 1997 | £90,409 | 26% |
115 Properties |
| 1996 | £66,864 | 2% |
67 Properties |
| 1995 | £65,493 | - |
62 Properties |
Property Price per Property Type in Stansted South
Here you can find historic sold price data in order to help with your property search.
The average Property Paid Price for specific property types in the last three years are:
| Property Type | Average Sold Price | Sold Properties |
|---|---|---|
| Semi Detached House | £414,314.00 | 35 Semi Detached Houses |
| Detached House | £657,348.00 | 33 Detached Houses |
| Terraced House | £338,059.00 | 57 Terraced Houses |
| Flat | £254,750.00 | 30 Flats |

