
Houses for sale & to rent in Whickham North, Gateshead
House Prices in Whickham North
Properties in Whickham North have an average house price of £217k and had 5 Property Transactions within the last 3 years¹.
Whickham North is an area in Gateshead, Gateshead with 45 households², where the most expensive property was sold for £260k.
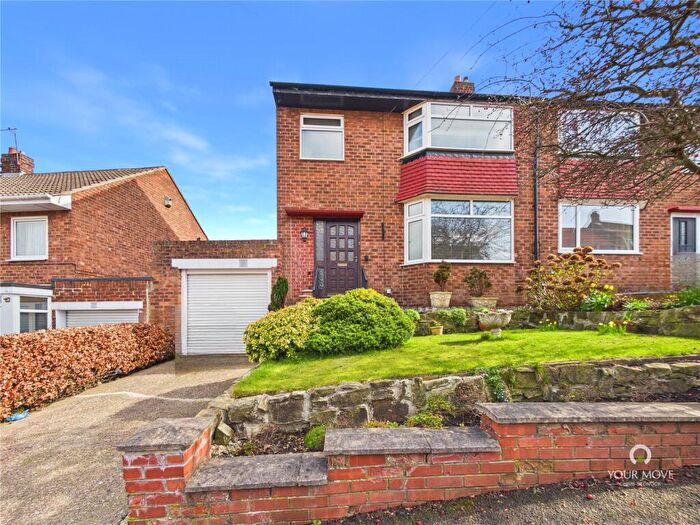
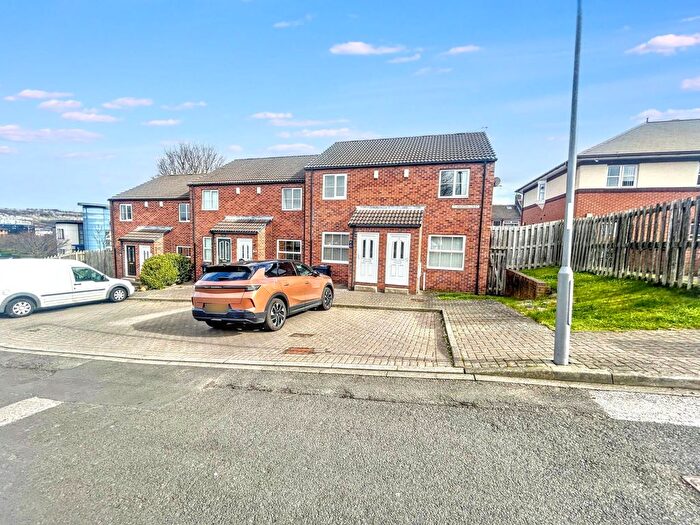
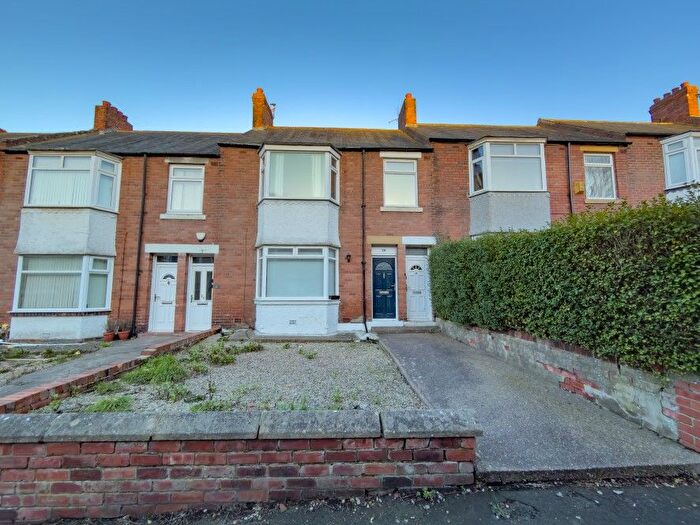
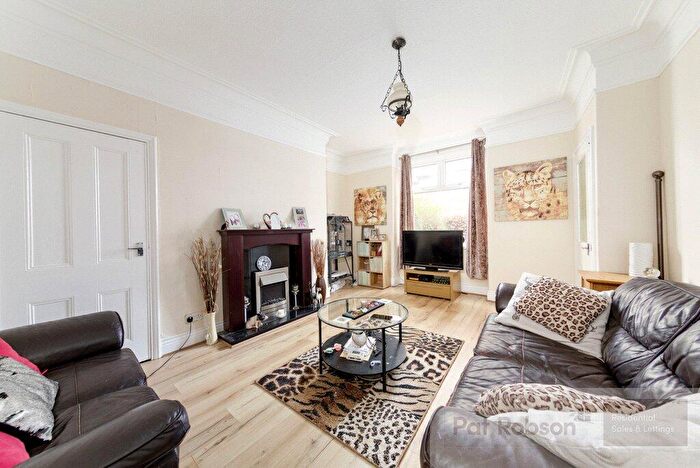
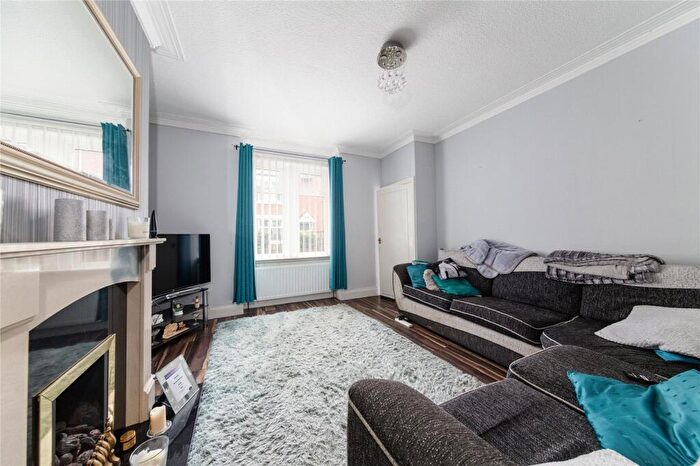
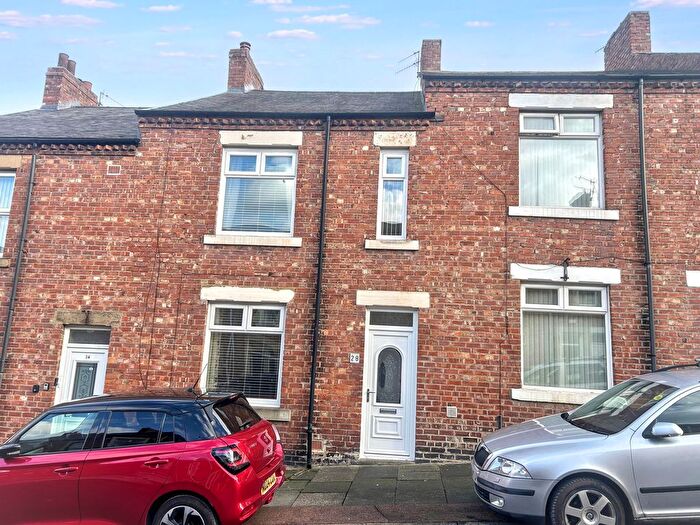
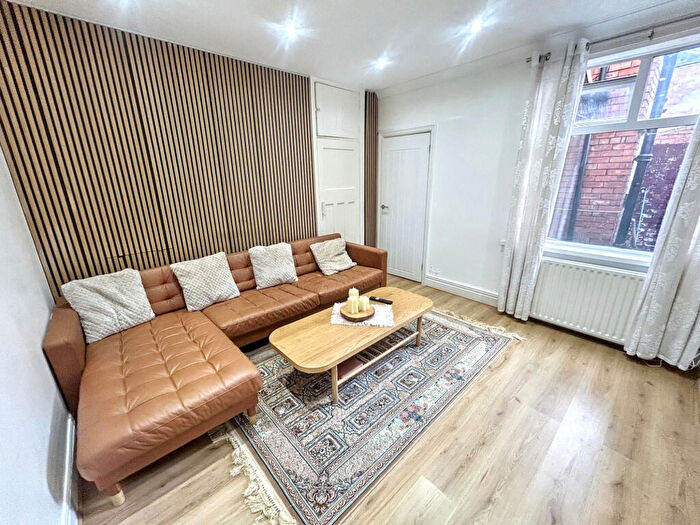
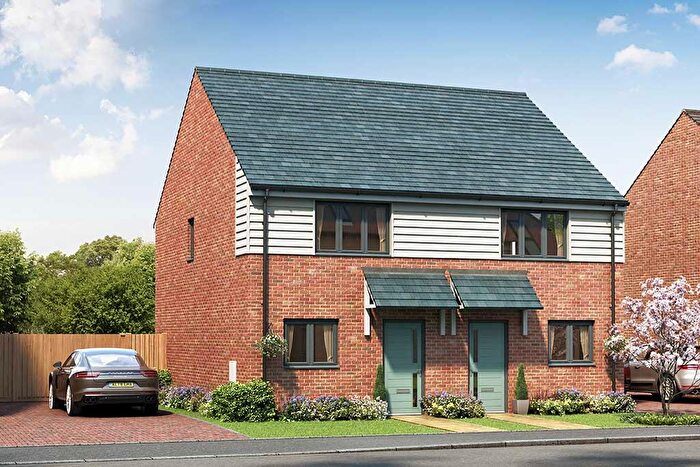
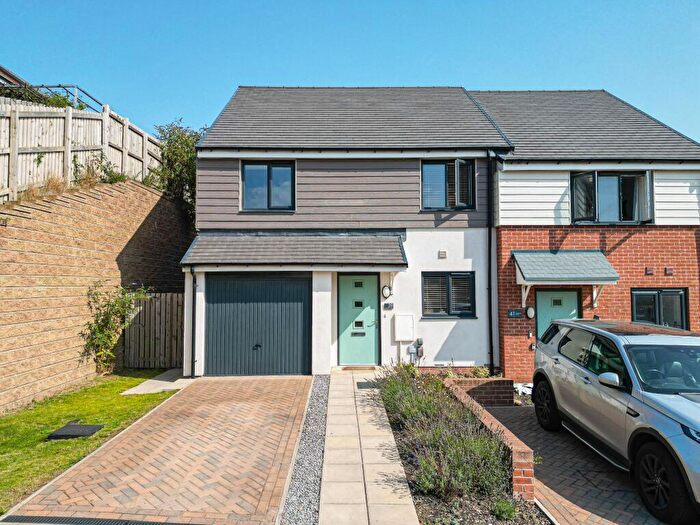
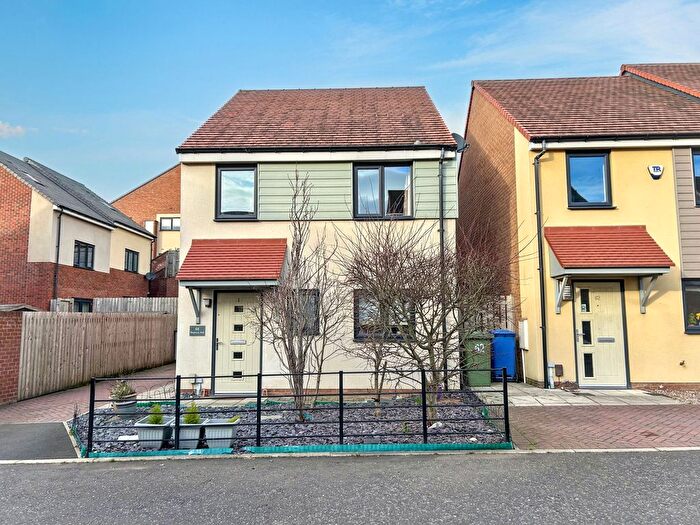
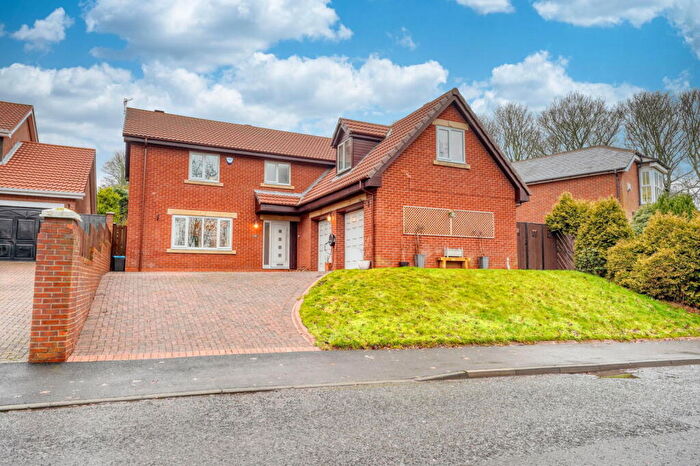
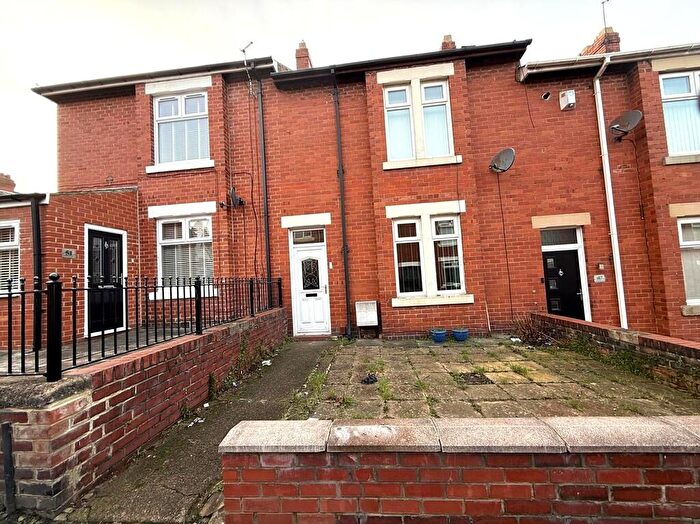
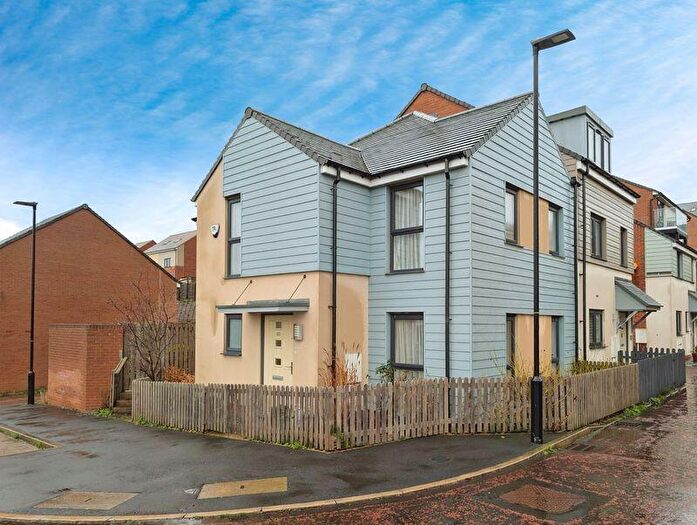
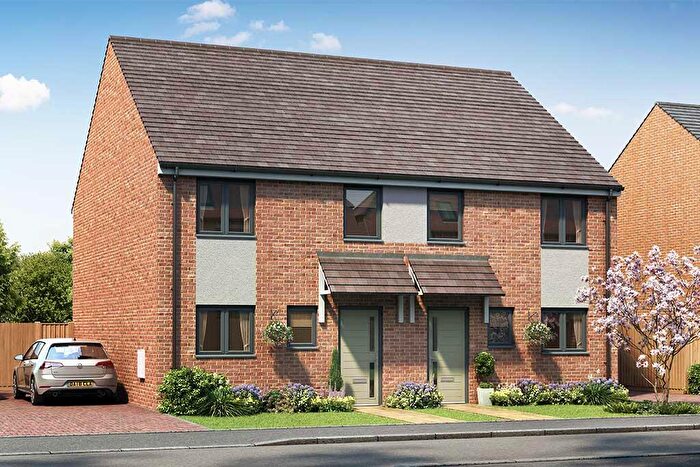
Properties for sale in Whickham North
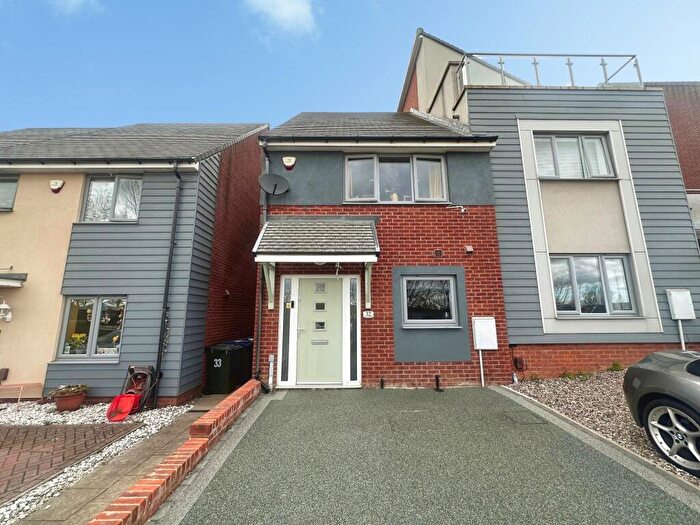
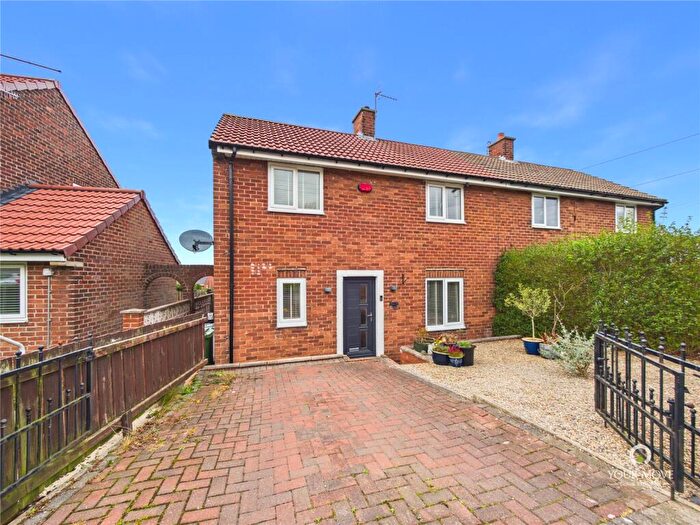
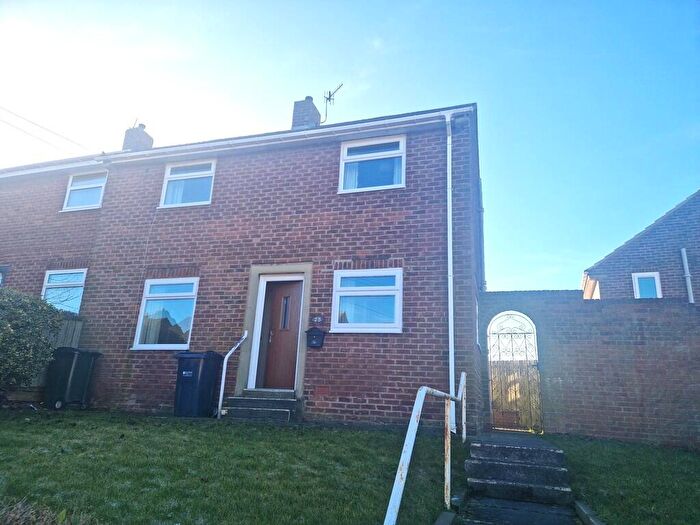

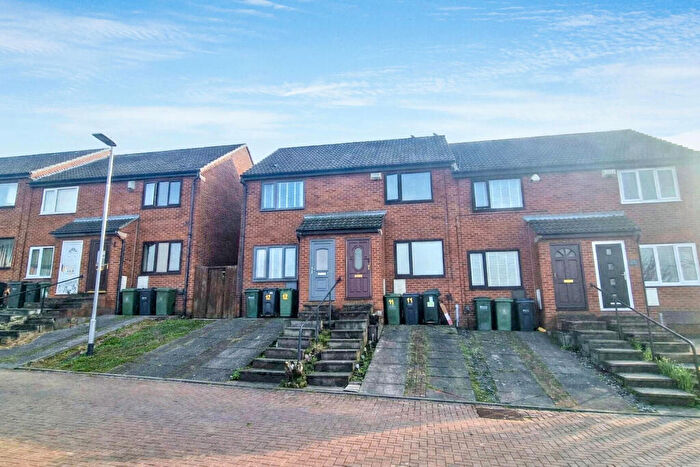
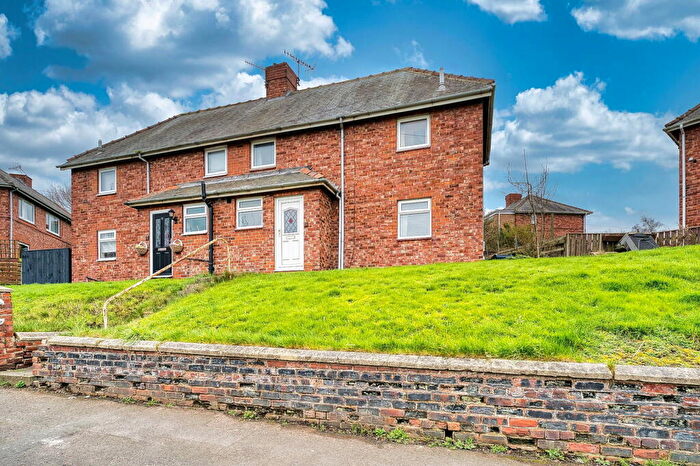
![]()
If you are looking to sell your house, let it out, or receive a property valuation, an expert can help you.
Click the button below to get started.


Roads and Postcodes in Whickham North
Navigate through our locations to find the location of your next house in Whickham North, Gateshead for sale or to rent.
| Streets | Postcodes |
|---|---|
| Allison Court | NE11 9YS |
| Cameron Walk | NE11 9GA NE11 9YD NE11 9YE NE11 9YQ NE11 9YR NE11 9YT NE11 9YW |
| Garden Walk | NE11 9XY NE11 9XZ |
| Gibside Way | NE11 9BT NE11 9YA |
| Grosvenor Avenue | NE16 3ES |
| Mediterranean Village | NE11 9XG |
| Metro Park West | NE11 9XS |
| Metro Retail Park | NE11 9XU |
| Metrocentre | NE11 9NH NE11 9XW |
| Redpath Way | NE11 9HX |
| Roman Forum | NE11 9XR |
| Russell Way | NE11 9XX NE11 9YZ |
| The Arcade | NE11 9YL |
| The Boulevard | NE11 9YN |
| The Galleria | NE11 9YH NE11 9YP |
| The Parade | NE11 9YJ |
| NE11 9XF NE11 9YG NE11 9ZG |
Transport near Whickham North

- FAQ
- Price Paid By Year
- Property Type Price
Frequently asked questions about Whickham North
What is the average price for a property for sale in Whickham North?
The average price for a property for sale in Whickham North is £216,500. This amount is 39% higher than the average price in Gateshead. There are 392 property listings for sale in Whickham North.
Which train stations are available in or near Whickham North?
Some of the train stations available in or near Whickham North are MetroCentre, Dunston and Blaydon.
Property Price Paid in Whickham North by Year
The average sold property price by year was:
| Year | Average Sold Price | Price Change |
Sold Properties
|
|---|---|---|---|
| 2025 | £182,500 | -20% |
1 Property |
| 2024 | £218,333 | -12% |
3 Properties |
| 2023 | £245,000 | 18% |
1 Property |
| 2022 | £201,000 | 8% |
2 Properties |
| 2021 | £185,666 | -4% |
3 Properties |
| 2020 | £193,000 | -1% |
2 Properties |
| 2019 | £195,000 | 34% |
1 Property |
| 2018 | £129,000 | -1% |
1 Property |
| 2017 | £130,833 | -17% |
3 Properties |
| 2016 | £152,875 | -3% |
4 Properties |
| 2015 | £158,000 | 17% |
4 Properties |
| 2011 | £131,250 | -31% |
4 Properties |
| 2008 | £172,345 | -3% |
3 Properties |
| 2007 | £178,000 | 11% |
6 Properties |
| 2006 | £159,250 | 16% |
4 Properties |
| 2005 | £134,000 | 55% |
1 Property |
| 2001 | £59,950 | -10% |
1 Property |
| 2000 | £66,000 | 37% |
4 Properties |
| 1999 | £41,750 | 14% |
4 Properties |
| 1998 | £35,750 | -39% |
2 Properties |
| 1997 | £49,666 | 50% |
3 Properties |
| 1996 | £25,000 | - |
1 Property |
Property Price per Property Type in Whickham North
Here you can find historic sold price data in order to help with your property search.
The average Property Paid Price for specific property types in the last three years are:
| Property Type | Average Sold Price | Sold Properties |
|---|---|---|
| Semi Detached House | £225,625.00 | 4 Semi Detached Houses |
| Terraced House | £180,000.00 | 1 Terraced House |