
Houses for sale in Gateshead, England
House Prices in Gateshead
Properties in Gateshead have
an average house price of
£169k
and had 8,687 Property Transactions
within the last 3 years.¹
Gateshead is a location in
England with
89,325 households², where the most expensive property was sold for £1.48M.
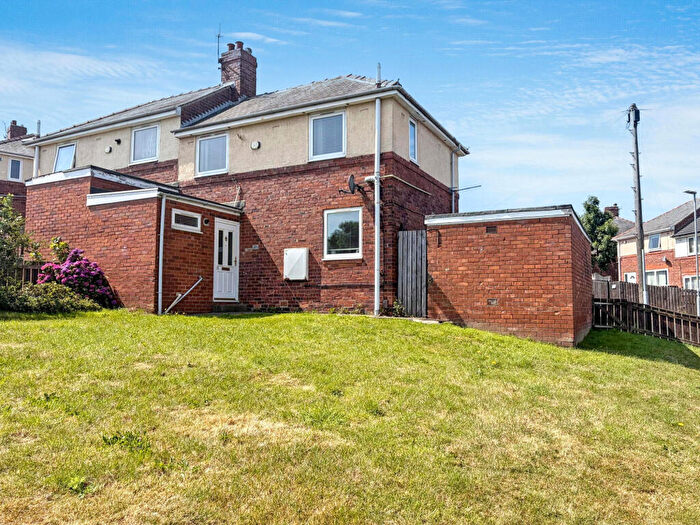
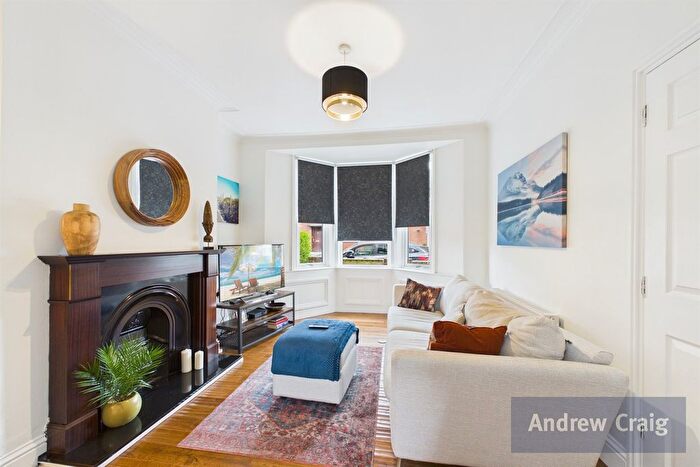
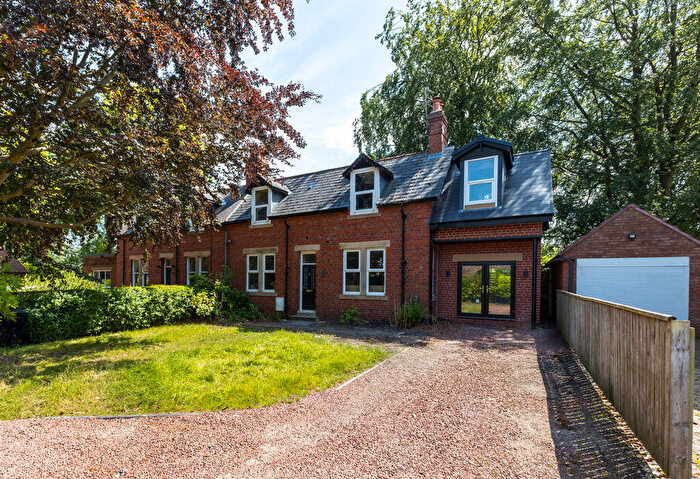
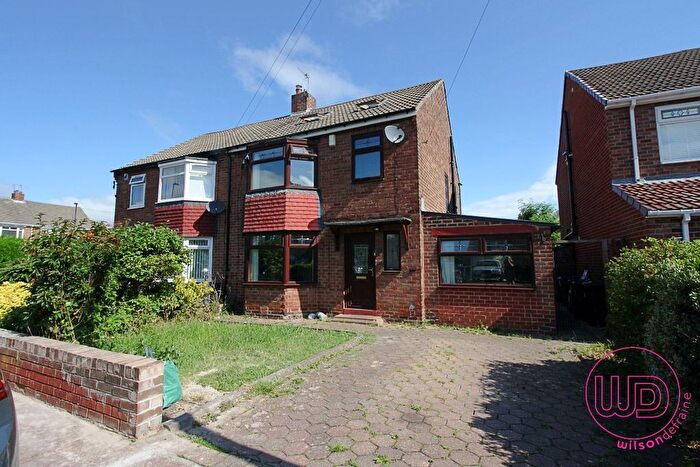
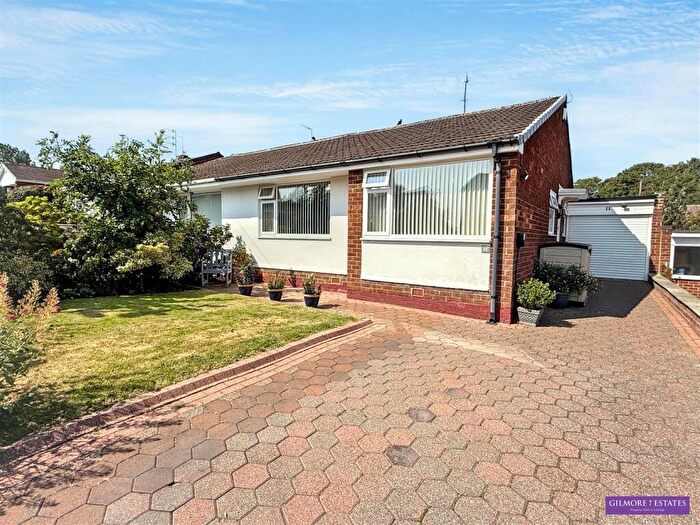
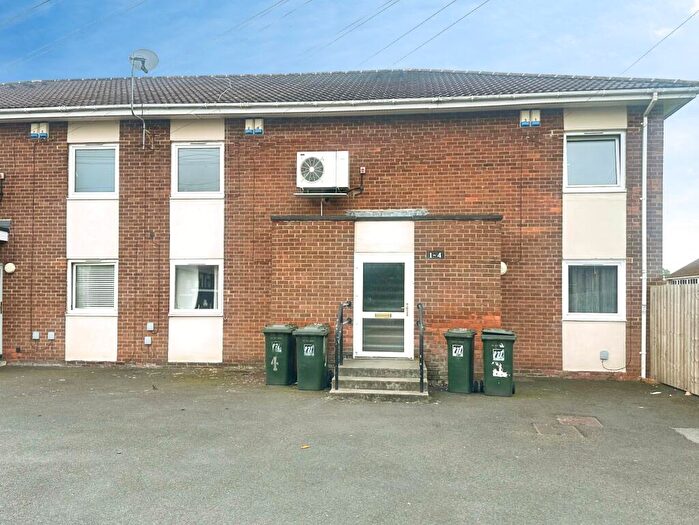
Properties for sale in Gateshead
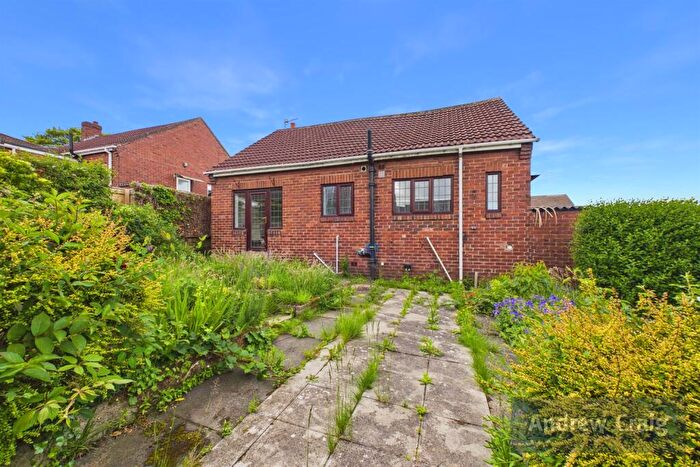
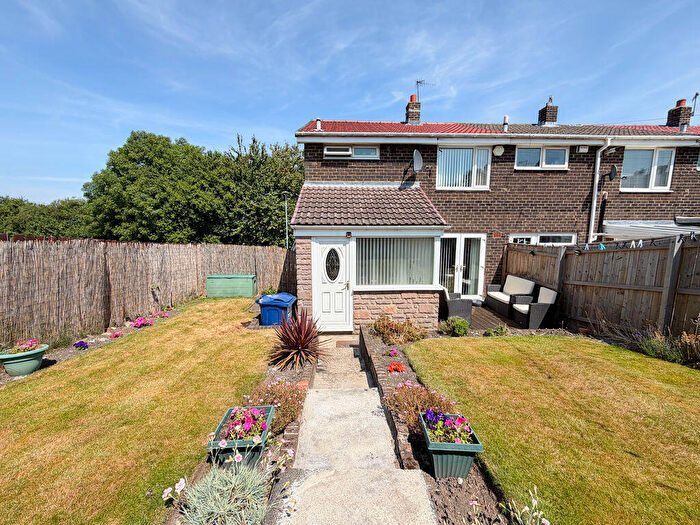
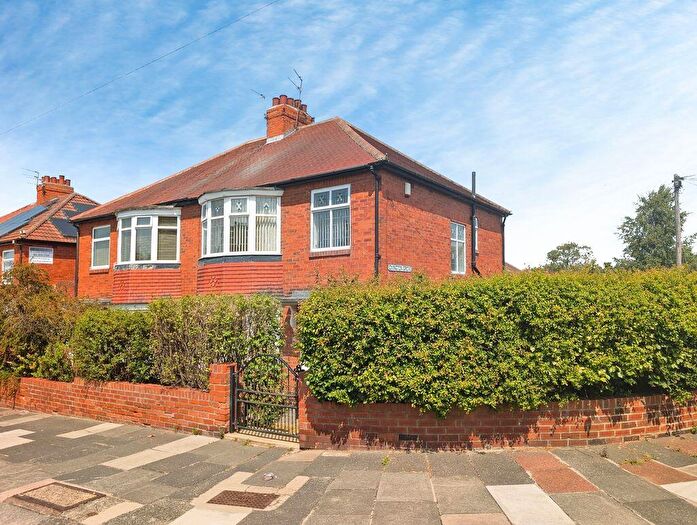
![]()
If you are looking to sell your house, let it out, or receive a property valuation, an expert can help you.
Click the button below to get started.

Towns in Gateshead
Navigate through our locations to find the location of your next house in Gateshead, England for sale or to rent.
Property price trends in Gateshead
According to the latest Land Registry data, the average home in Gateshead sold for £173,366 in 2026. That figure comes from a substantial record of 94,824 sales logged over the past 31 years.
Prices have continued to climb over the last three years. Compared with 2023, when the typical sale came in around £162,809, that's a rise of roughly 6.5%.
Looking back five years, average prices are up about 6.4% since 2021, a gain of around £10,357 in cash terms.
Zoom out to the past decade for the fuller picture. Back in 2016, homes here averaged £139,469, so the typical sold price has climbed about 24.3% since then, roughly 2.2% a year. Stretch the view to fifteen years and that annual pace eases back to about 1.9%.
Frequently asked questions about Gateshead
What is the average price for a property for sale in Gateshead?
The average price for a property for sale in Gateshead is £168,929. This amount is 53% lower than the average price in England. There are more than 10,000 property listings for sale in Gateshead.
What locations have the most expensive properties for sale in Gateshead?
The locations with the most expensive properties for sale in Gateshead are Wylam at an average of £310,772, Newcastle Upon Tyne at an average of £202,253 and Rowlands Gill at an average of £198,764.
What locations have the most affordable properties for sale in Gateshead?
The locations with the most affordable properties for sale in Gateshead are Gateshead at an average of £156,127, Chester Le Street at an average of £164,188 and Blaydon-on-tyne at an average of £166,293.
Which train stations are available in or near Gateshead?
Some of the train stations available in or near Gateshead are Dunston, MetroCentre and Newcastle.
Property Price Paid in Gateshead by Year
The average sold property price by year was:
| Year | Average Sold Price | Price Change |
Sold Properties
|
|---|---|---|---|
| 2026 | £173,366 | -0,2% |
512 Properties |
| 2025 | £173,686 | 3% |
2,719 Properties |
| 2024 | £169,333 | 4% |
2,788 Properties |
| 2023 | £162,809 | 1% |
2,668 Properties |
| 2022 | £161,794 | -1% |
3,105 Properties |
| 2021 | £163,009 | 3% |
3,423 Properties |
| 2020 | £158,148 | 5% |
2,670 Properties |
| 2019 | £150,698 | 2% |
2,841 Properties |
| 2018 | £148,339 | 2% |
3,075 Properties |
| 2017 | £145,554 | 4% |
2,953 Properties |
Property Price per Property Type in Gateshead
Here you can find historic sold price data in order to help with your property search.
The average Property Paid Price for specific property types in the last three years are:
| Property Type | Average Sold Price | Sold Properties |
|---|---|---|
| Semi Detached House | £183,539.00 | 2,919 Semi Detached Houses |
| Terraced House | £147,098.00 | 3,049 Terraced Houses |
| Detached House | £327,809.00 | 923 Detached Houses |
| Flat | £100,595.00 | 1,796 Flats |
Transport in Gateshead
Please see below transportation links in this area:
