
Houses for sale in Cinderford, Gloucestershire
House Prices in Cinderford
Properties in Cinderford have an average house price of £238k and had 439 Property Transactions within the last 3 years.¹
Cinderford is an area in Gloucestershire with 5,644 households², where the most expensive property was sold for £1.18M.
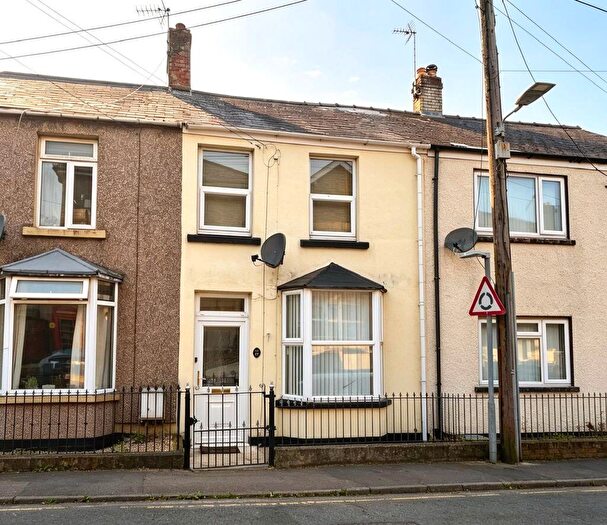
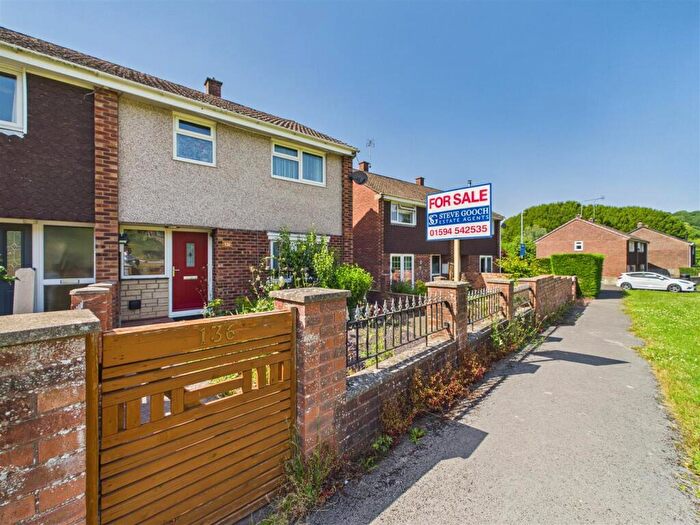
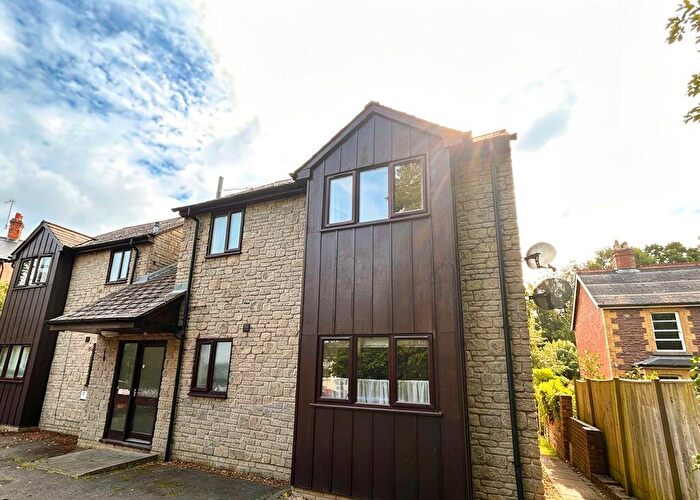
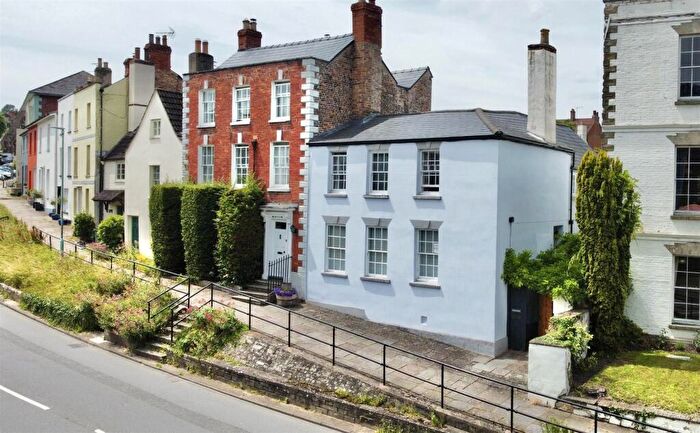
Properties for sale in Cinderford
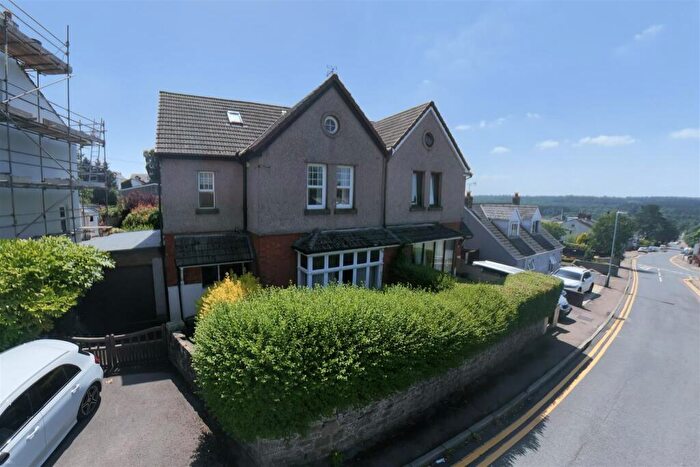
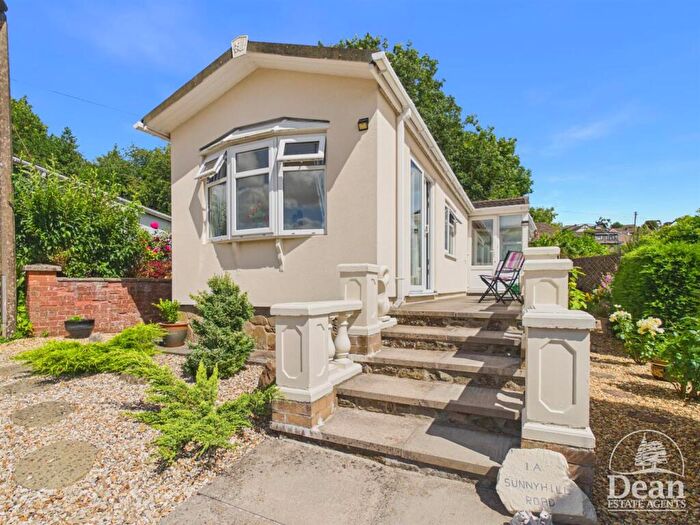
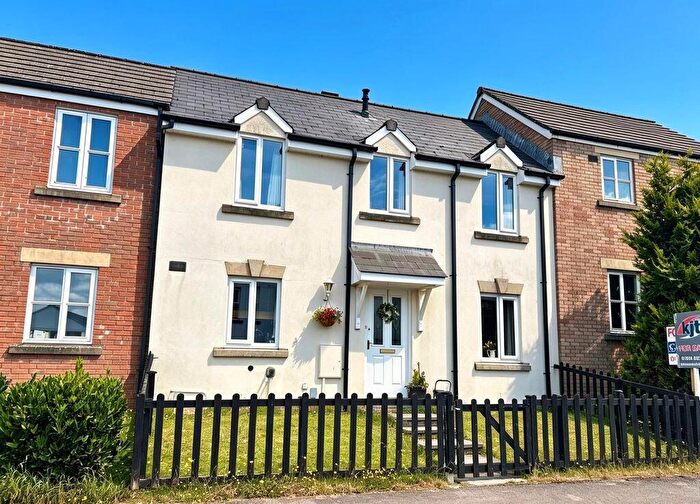
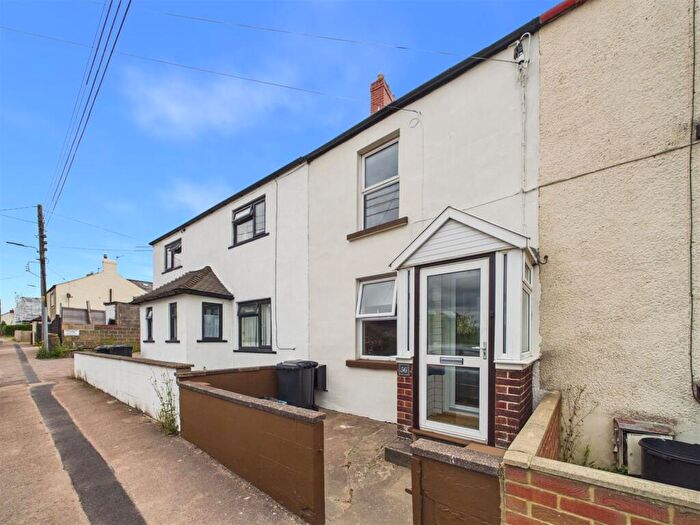
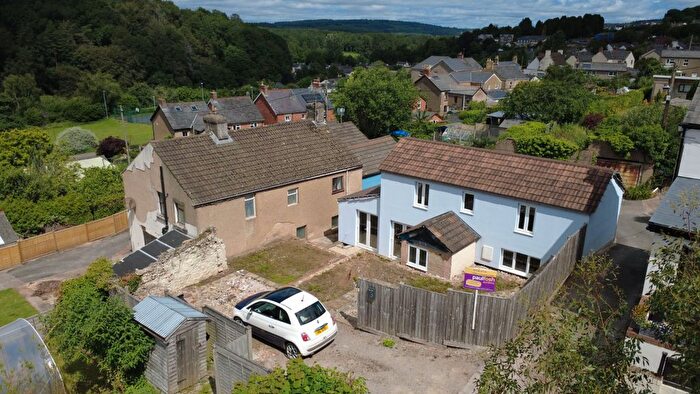
![]()
If you are looking to sell your house, let it out, or receive a property valuation, an expert can help you.
Click the button below to get started.

Neighbourhoods in Cinderford
Navigate through our locations to find the location of your next house in Cinderford, Gloucestershire for sale or to rent.
Property price trends in Cinderford
According to the latest Land Registry data, the average home in Cinderford sold for £249,333 in 2026. That figure comes from a substantial record of 6,378 sales logged over the past 31 years.
Prices have moved up over the last three years. Compared with 2023, when the typical sale came in around £239,906, that's a rise of roughly 3.9%.
Looking back five years, average prices are up about 15.4% since 2021, a gain of around £33,205 in cash terms.
Zoom out to the past decade for the fuller picture. Back in 2016, homes here averaged £165,149, so the typical sold price has climbed about 51% since then, roughly 4.2% a year. Stretch the view to fifteen years and that annual pace eases back to about 3.9%.
Frequently asked questions about Cinderford
What is the average price for a property for sale in Cinderford?
The average price for a property for sale in Cinderford is £237,547. This amount is 37% lower than the average price in Gloucestershire. There are 3,325 property listings for sale in Cinderford.
What locations have the most expensive properties for sale in Cinderford?
The locations with the most expensive properties for sale in Cinderford are Littledean And Ruspidge at an average of £290,402 and Ruspidge at an average of £278,743.
What locations have the most affordable properties for sale in Cinderford?
The locations with the most affordable properties for sale in Cinderford are Cinderford East at an average of £206,051 and Cinderford West at an average of £211,763.
Which train stations are available in or near Cinderford?
Some of the train stations available in or near Cinderford are Lydney, Cam and Dursley and Stonehouse.
Property Price Paid in Cinderford by Year
The average sold property price by year was:
| Year | Average Sold Price | Price Change |
Sold Properties
|
|---|---|---|---|
| 2026 | £249,333 | 6% |
6 Properties |
| 2025 | £233,216 | -3% |
153 Properties |
| 2024 | £239,433 | -0,2% |
145 Properties |
| 2023 | £239,906 | 3% |
135 Properties |
| 2022 | £232,318 | 7% |
177 Properties |
| 2021 | £216,128 | 11% |
260 Properties |
| 2020 | £192,590 | 2% |
150 Properties |
| 2019 | £188,147 | - |
213 Properties |
| 2018 | £188,116 | 9% |
199 Properties |
| 2017 | £170,558 | 3% |
221 Properties |
Property Price per Property Type in Cinderford
Here you can find historic sold price data in order to help with your property search.
The average Property Paid Price for specific property types in the last three years are:
| Property Type | Average Sold Price | Sold Properties |
|---|---|---|
| Semi Detached House | £222,158.00 | 150 Semi Detached Houses |
| Detached House | £321,843.00 | 137 Detached Houses |
| Terraced House | £185,197.00 | 127 Terraced Houses |
| Flat | £133,880.00 | 25 Flats |
Transport in Cinderford
Please see below transportation links in this area:
