
Houses for sale in Gloucestershire, England
House Prices in Gloucestershire
Properties in Gloucestershire have
an average house price of
£376k
and had 30,195 Property Transactions
within the last 3 years.¹
Gloucestershire is a location in
England with
280,305 households², where the most expensive property was sold for £7.83M.
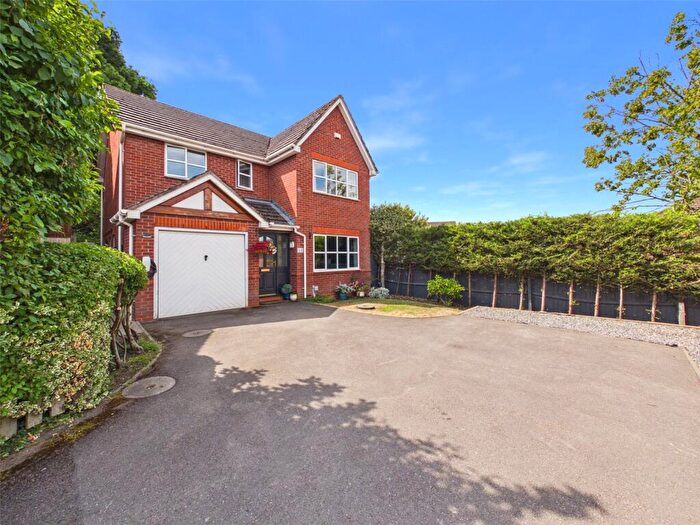
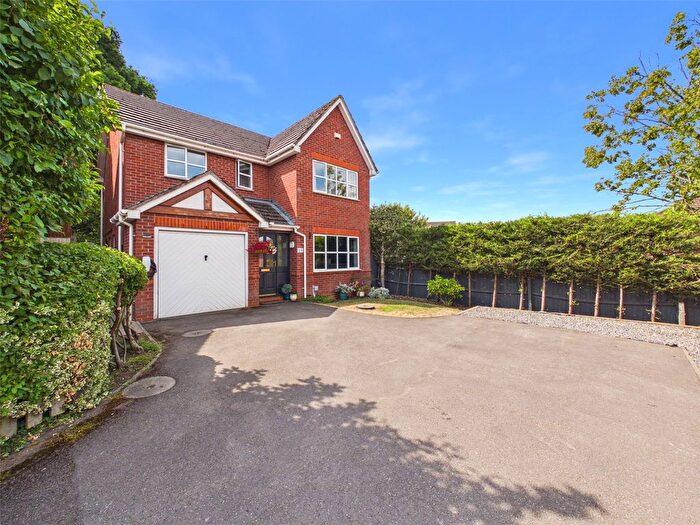
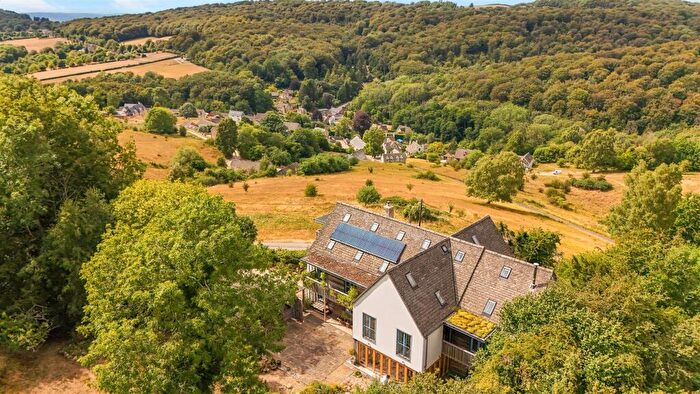
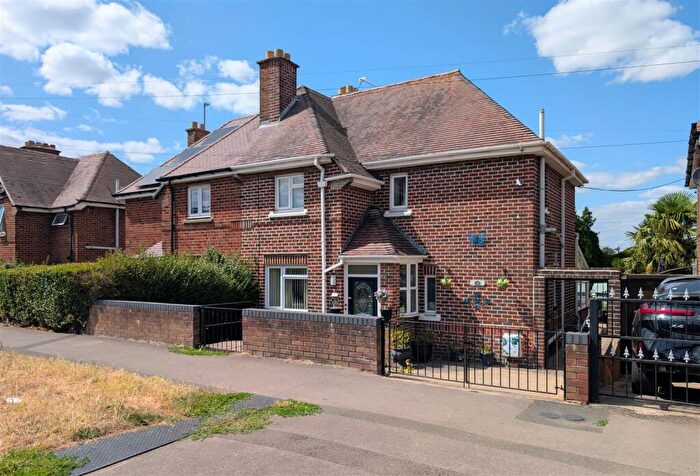
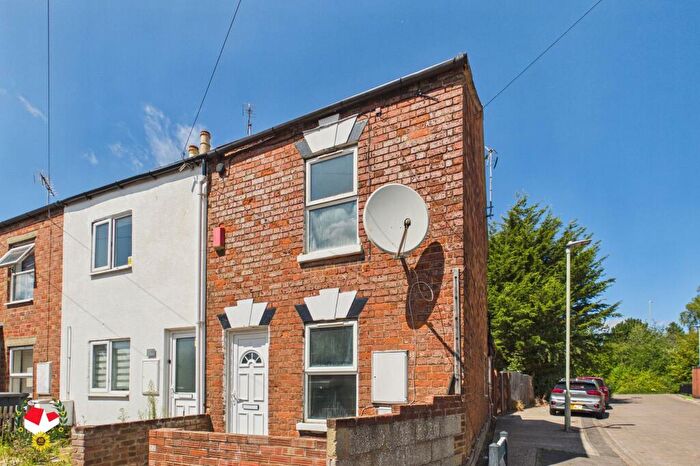
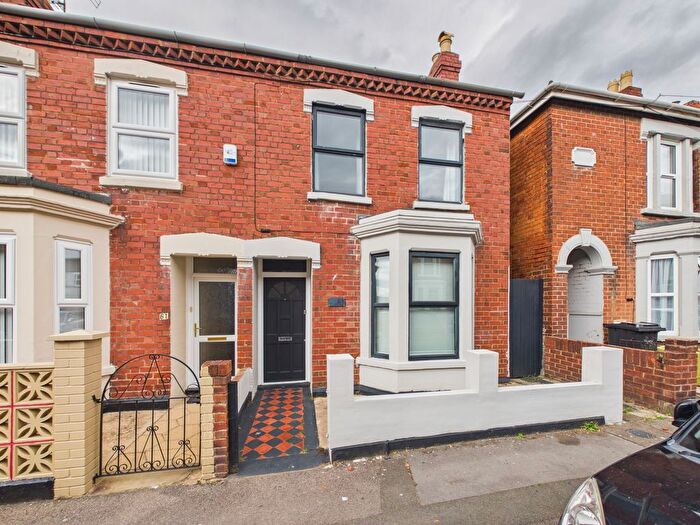
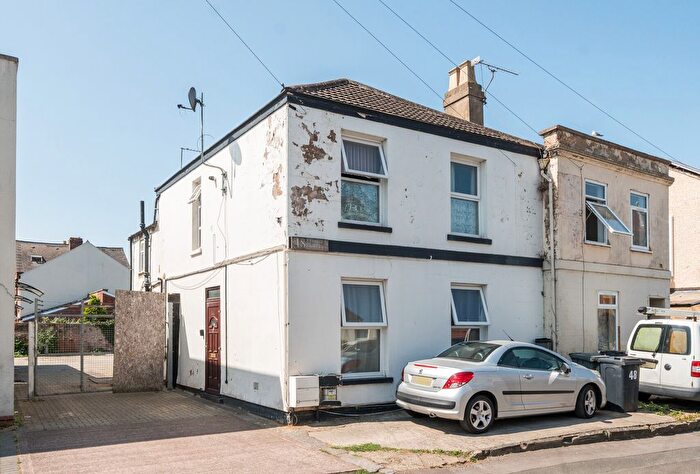
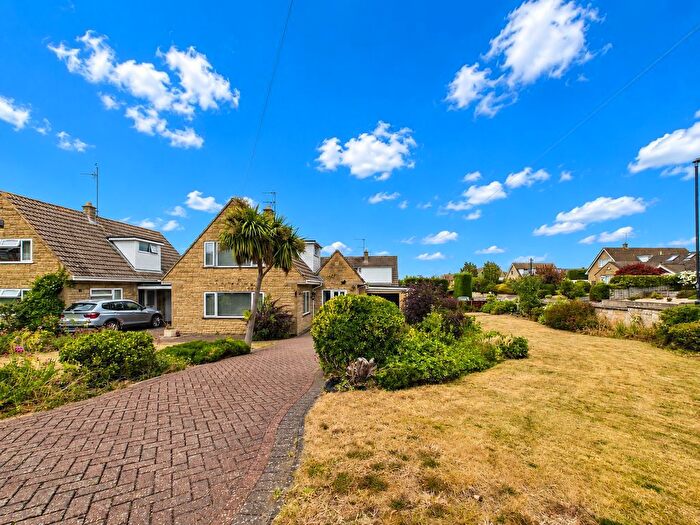
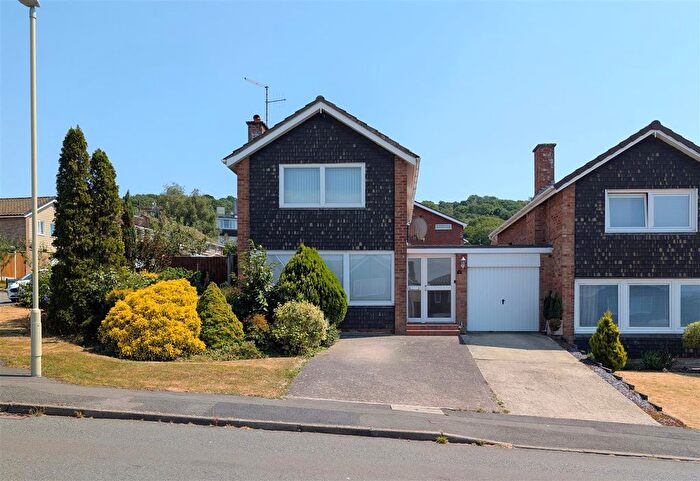
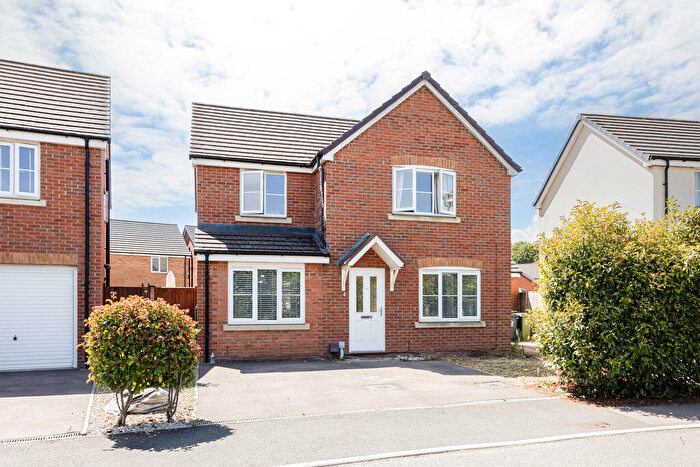
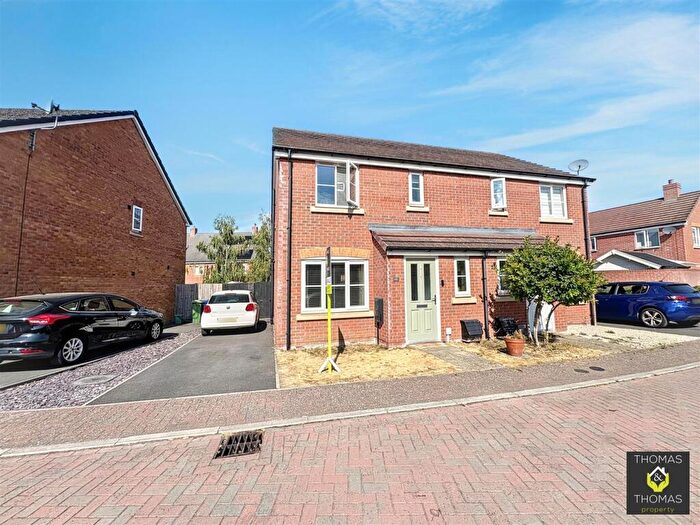
Properties for sale in Gloucestershire

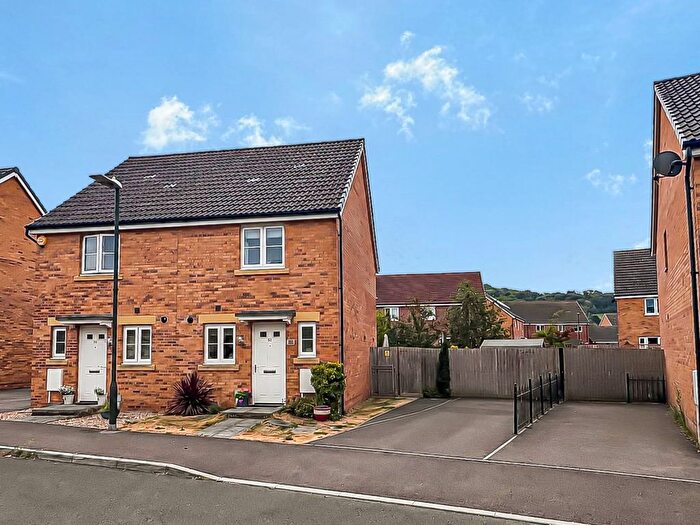
![]()
If you are looking to sell your house, let it out, or receive a property valuation, an expert can help you.
Click the button below to get started.


Towns in Gloucestershire
Navigate through our locations to find the location of your next house in Gloucestershire, England for sale or to rent.
- Monmouth
- Tetbury
- Wotton-under-edge
- Dymock
- Stroud
- Tewkesbury
- Evesham
- Drybrook
- Swindon
- Chippenham
- Stonehouse
- Chepstow
- Mitcheldean
- Worcester
- Ross-on-wye
- Lydbrook
- Badminton
- Malvern
- Lydney
- Ruardean
- Newnham
- Ledbury
- Blakeney
- Burford
- Broadway
- Dursley
- Cirencester
- Gloucester
- Cheltenham
- Berkeley
- Bristol
- Fairford
- Lechlade
- Moreton-in-marsh
- Cinderford
- Chipping Campden
- Newent
- Westbury-on-severn
- Coleford
- Chipping Norton
- Longhope
- Bampton
Property price trends in Gloucestershire
According to the latest Land Registry data, the average home in Gloucestershire sold for £352,856 in 2026. That figure comes from a substantial record of 365,386 sales logged over the past 31 years.
Prices have softened over the last three years. Compared with 2023, when the typical sale came in around £373,983, that's a fall of roughly 5.6%.
Looking back five years, average prices are up about 0.6% since 2021, a gain of around £2,094 in cash terms.
Zoom out to the past decade for the fuller picture. Back in 2016, homes here averaged £270,387, so the typical sold price has climbed about 30.5% since then, roughly 2.7% a year. Stretch the view to fifteen years and that annual pace holds at about 2.9%.
Frequently asked questions about Gloucestershire
What is the average price for a property for sale in Gloucestershire?
The average price for a property for sale in Gloucestershire is £375,740. This amount is 5% higher than the average price in England. There are more than 10,000 property listings for sale in Gloucestershire.
What locations have the most expensive properties for sale in Gloucestershire?
The locations with the most expensive properties for sale in Gloucestershire are Burford at an average of £1,198,562, Chipping Norton at an average of £792,139 and Broadway at an average of £734,692.
What locations have the most affordable properties for sale in Gloucestershire?
The locations with the most affordable properties for sale in Gloucestershire are Cinderford at an average of £237,547, Mitcheldean at an average of £266,694 and Gloucester at an average of £283,716.
Which train stations are available in or near Gloucestershire?
Some of the train stations available in or near Gloucestershire are Gloucester, Cheltenham Spa and Stroud.
Property Price Paid in Gloucestershire by Year
The average sold property price by year was:
| Year | Average Sold Price | Price Change |
Sold Properties
|
|---|---|---|---|
| 2026 | £352,856 | -7% |
1,767 Properties |
| 2025 | £376,626 | -1% |
9,899 Properties |
| 2024 | £380,657 | 2% |
9,623 Properties |
| 2023 | £373,983 | 0,1% |
8,906 Properties |
| 2022 | £373,447 | 6% |
10,749 Properties |
| 2021 | £350,762 | 5% |
14,336 Properties |
| 2020 | £334,776 | 10% |
10,128 Properties |
| 2019 | £301,131 | 1% |
11,571 Properties |
| 2018 | £298,560 | 2% |
12,471 Properties |
| 2017 | £291,781 | 7% |
12,851 Properties |
Property Price per Property Type in Gloucestershire
Here you can find historic sold price data in order to help with your property search.
The average Property Paid Price for specific property types in the last three years are:
| Property Type | Average Sold Price | Sold Properties |
|---|---|---|
| Semi Detached House | £337,423.00 | 9,323 Semi Detached Houses |
| Terraced House | £290,252.00 | 7,885 Terraced Houses |
| Detached House | £591,902.00 | 8,462 Detached Houses |
| Flat | £199,417.00 | 4,525 Flats |
Transport in Gloucestershire
Please see below transportation links in this area:
