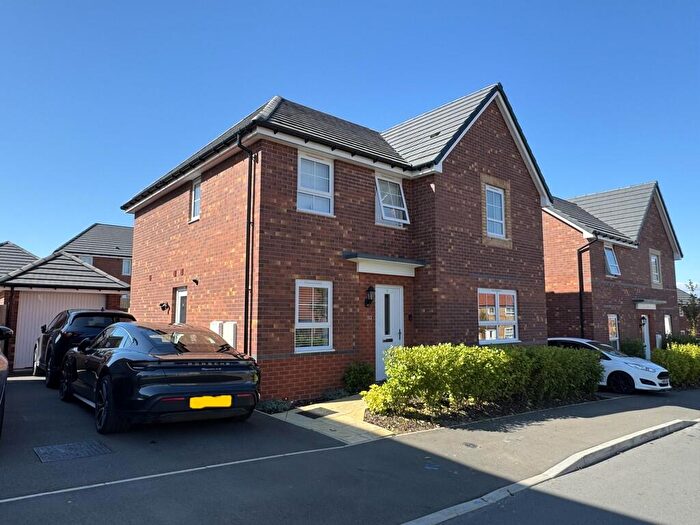
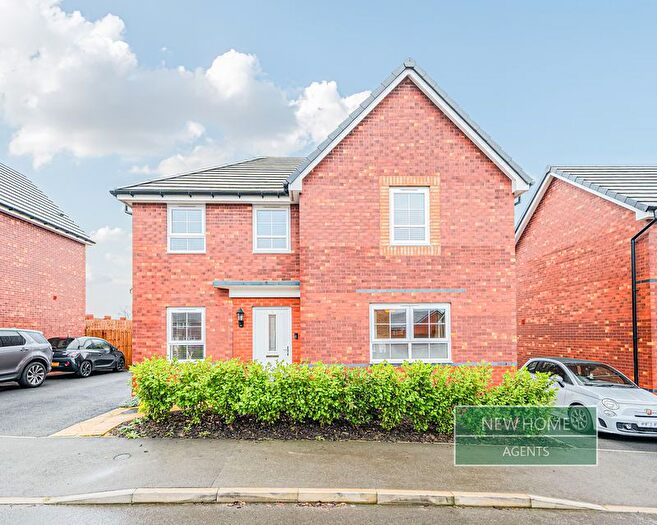
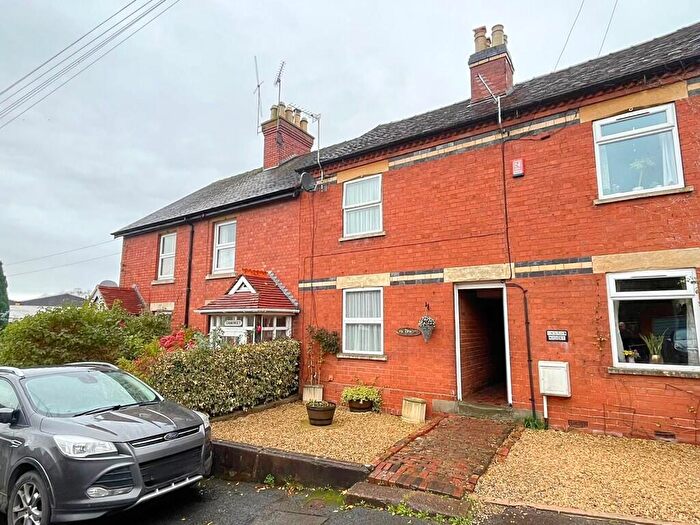
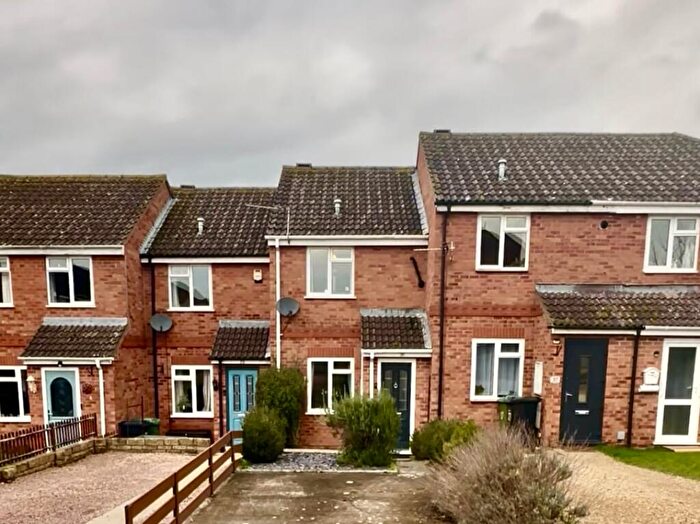
Houses for sale & to rent in Bromesberrow And Dymock, Dymock
House Prices in Bromesberrow And Dymock
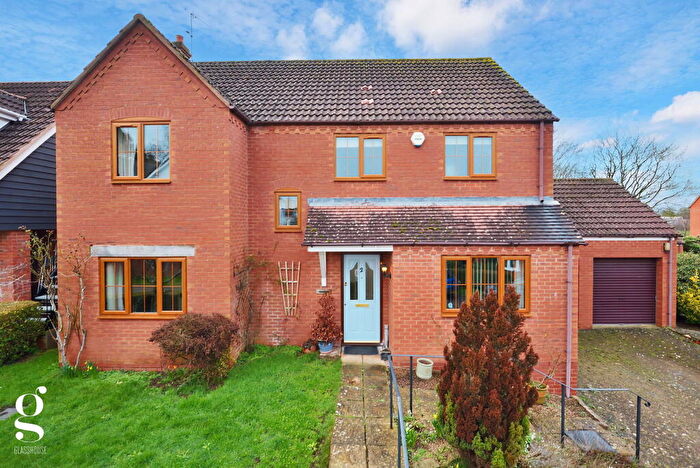
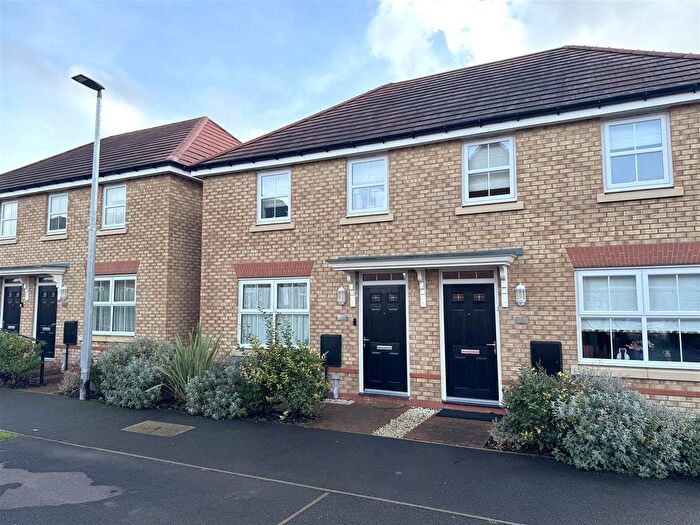
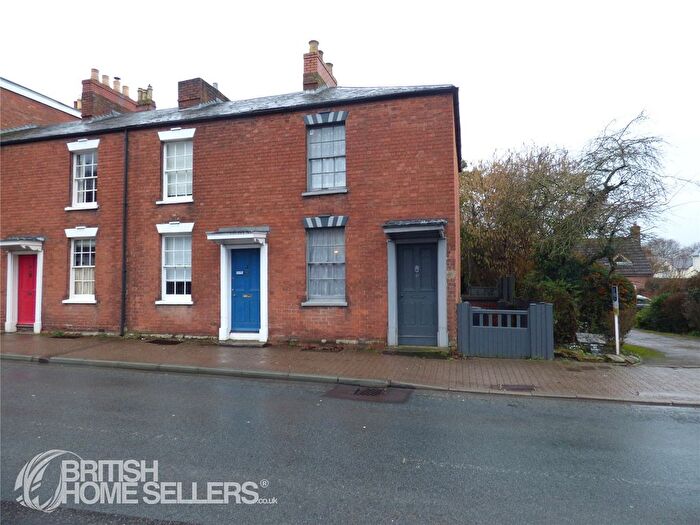
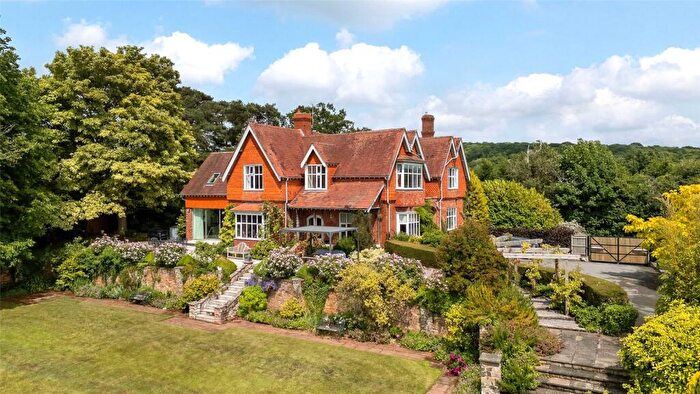
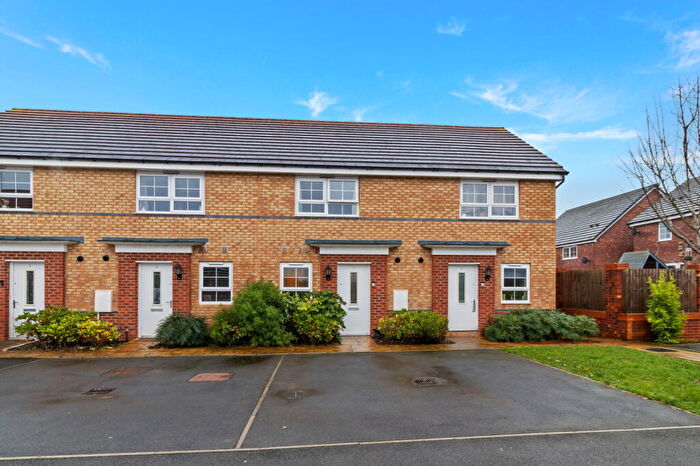
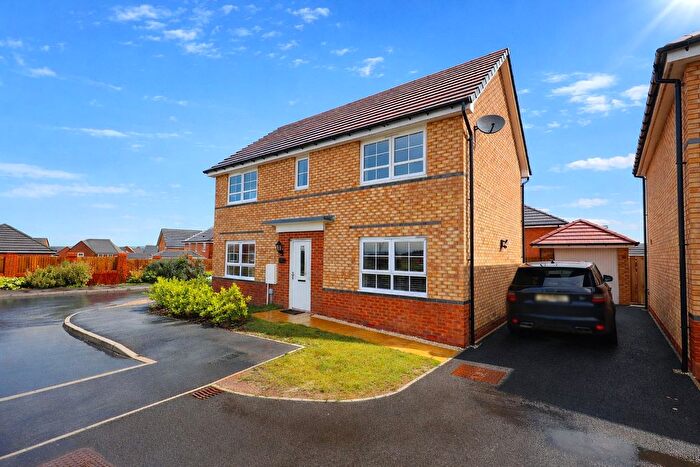
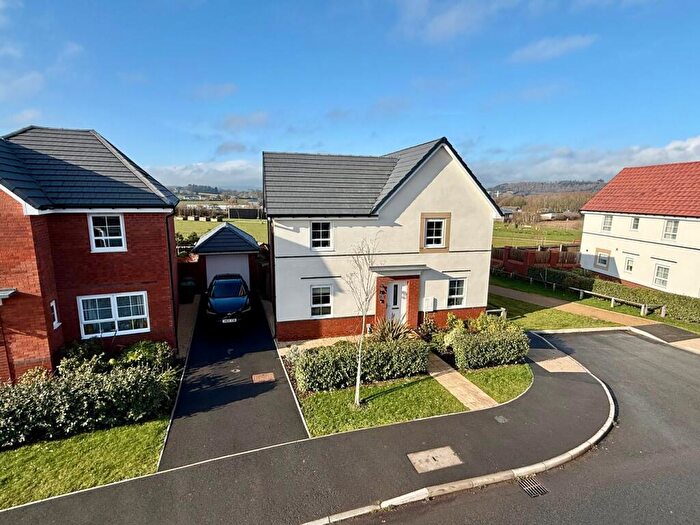
Properties in Bromesberrow And Dymock have an average house price of £420,336.00 and had 37 Property Transactions within the last 3 years¹.
Bromesberrow And Dymock is an area in Dymock, Gloucestershire with 502 households², where the most expensive property was sold for £890,000.00.
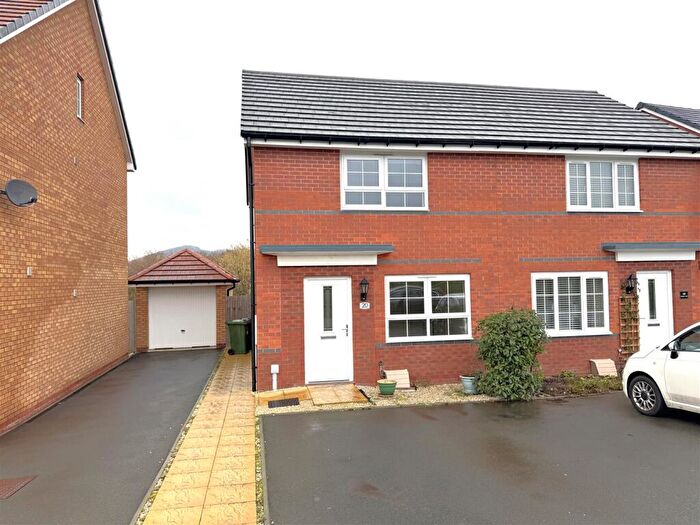
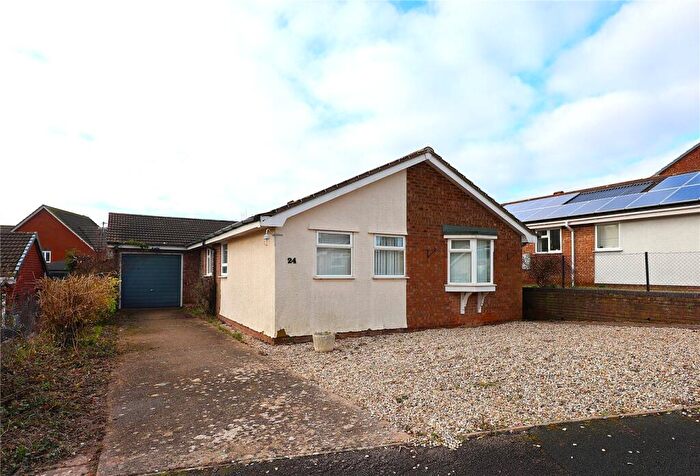
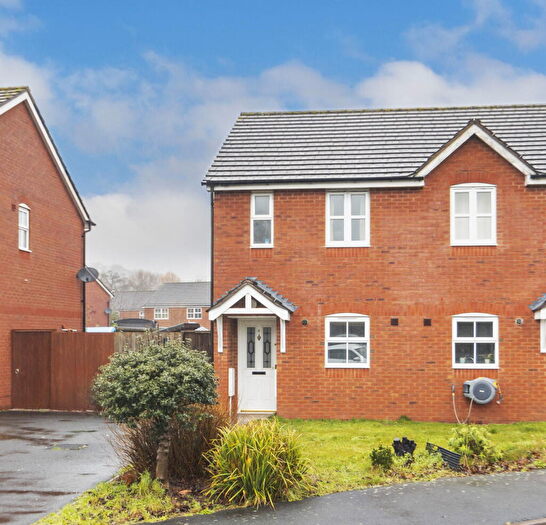
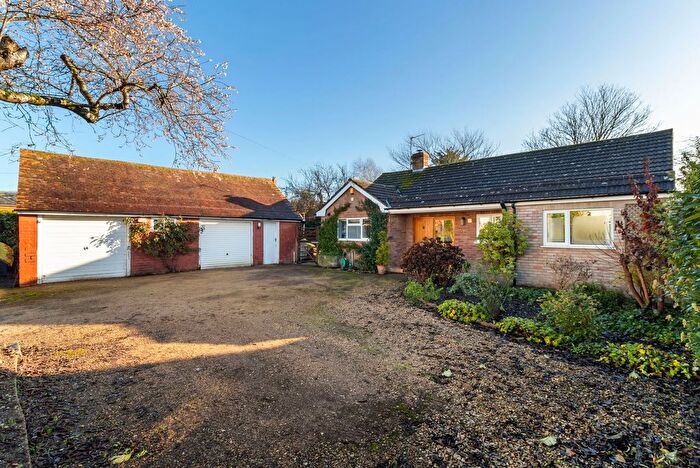
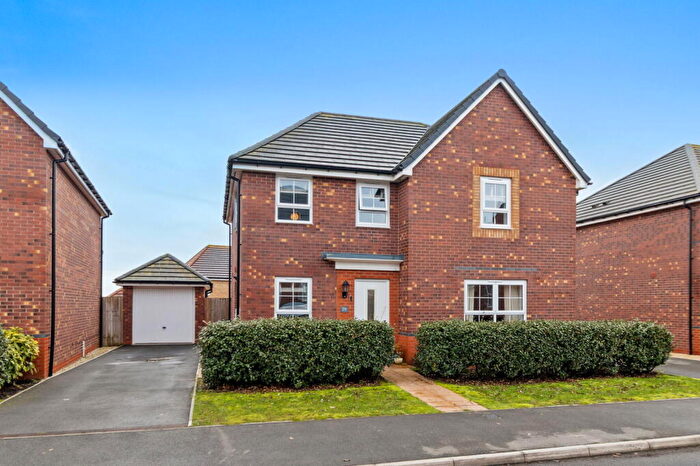
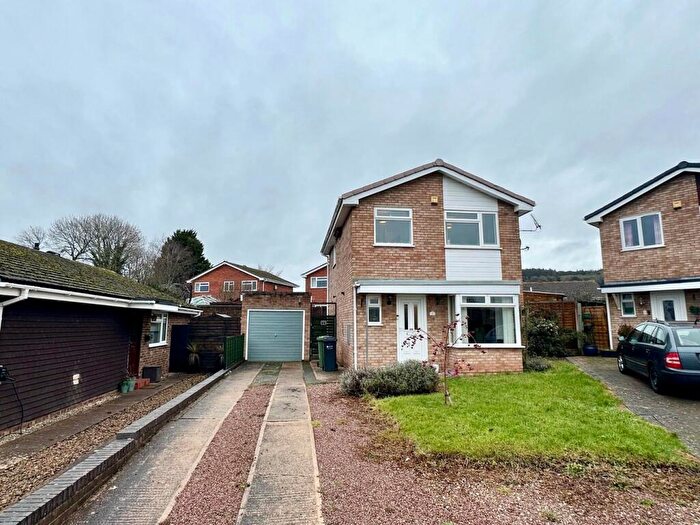
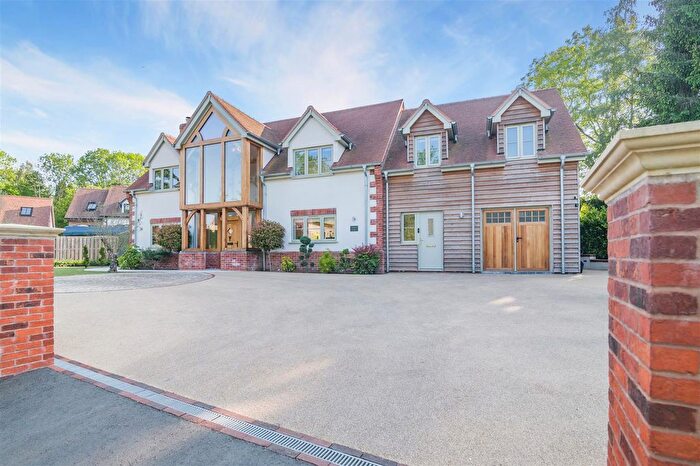
Properties for sale in Bromesberrow And Dymock
Roads and Postcodes in Bromesberrow And Dymock
Navigate through our locations to find the location of your next house in Bromesberrow And Dymock, Dymock for sale or to rent.
| Streets | Postcodes |
|---|---|
| Batchfields | GL18 2AD |
| Bayfield Gardens | GL18 2BH |
| Crown Close | GL18 2AZ |
| Dowles Cottages | GL18 2AF |
| Elmbridge Villas | GL18 2DG |
| Fishpool | GL18 2BT |
| Green Lane | GL18 2ED |
| Greenway | GL18 2DT |
| Hallwood Green | GL18 2EE |
| Horsecroft Lane | GL18 2EJ |
| Kempley Green | GL18 2BW |
| Kempley Road | GL18 2BA GL18 2BB |
| Knights Green | GL18 2DF |
| Kyrle Acre | GL18 2EP |
| Kyrleside | GL18 2EN |
| Ledbury Road | GL18 2AG GL18 2DA GL18 2DB GL18 2DD |
| Leominster Road | GL18 2AN GL18 2AW |
| Marcle Road | GL18 2AR |
| Normansland Road | GL18 2BE |
| St Marys Close | GL18 2AX |
| Station Terrace | GL18 2BD |
| Stonehouse Cottages | GL18 2AT |
| The Crypt Estate | GL18 2AL |
| The Village | GL18 2AH GL18 2AJ GL18 2AQ GL18 2DS |
| The Willows | GL18 2AY |
| Tillers Green | GL18 2AP |
| Tilputs End | GL18 2DY |
| Wantridge | GL18 2BP |
| Western Way | GL18 2AU |
| GL18 2AB GL18 2BG GL18 2BN GL18 2BS GL18 2BU GL18 2DH GL18 2DJ GL18 2DL GL18 2DP GL18 2EF GL18 2EG |
Transport near Bromesberrow And Dymock
-
Ledbury Station
-
Colwall Station
-
Great Malvern Station
-
Malvern Link Station
-
Gloucester Station
-
Hereford Station
-
Ashchurch Station
- FAQ
- Price Paid By Year
- Property Type Price
Frequently asked questions about Bromesberrow And Dymock
What is the average price for a property for sale in Bromesberrow And Dymock?
The average price for a property for sale in Bromesberrow And Dymock is £420,336. This amount is 0.98% higher than the average price in Dymock. There are 454 property listings for sale in Bromesberrow And Dymock.
What streets have the most expensive properties for sale in Bromesberrow And Dymock?
The streets with the most expensive properties for sale in Bromesberrow And Dymock are Kempley Green at an average of £560,000, Hallwood Green at an average of £540,000 and Leominster Road at an average of £525,000.
What streets have the most affordable properties for sale in Bromesberrow And Dymock?
The streets with the most affordable properties for sale in Bromesberrow And Dymock are The Crypt Estate at an average of £225,000, Bayfield Gardens at an average of £256,250 and Wantridge at an average of £285,000.
Which train stations are available in or near Bromesberrow And Dymock?
Some of the train stations available in or near Bromesberrow And Dymock are Ledbury, Colwall and Great Malvern.
Property Price Paid in Bromesberrow And Dymock by Year
The average sold property price by year was:
| Year | Average Sold Price | Price Change |
Sold Properties
|
|---|---|---|---|
| 2025 | £394,375 | 0,2% |
8 Properties |
| 2024 | £393,688 | -16% |
13 Properties |
| 2023 | £454,968 | 6% |
16 Properties |
| 2022 | £428,961 | -1% |
13 Properties |
| 2021 | £431,850 | 21% |
30 Properties |
| 2020 | £341,300 | 0,1% |
15 Properties |
| 2019 | £341,000 | 8% |
13 Properties |
| 2018 | £313,500 | -4% |
20 Properties |
| 2017 | £326,480 | 10% |
18 Properties |
| 2016 | £293,839 | 12% |
19 Properties |
| 2015 | £259,892 | -21% |
14 Properties |
| 2014 | £313,797 | 18% |
17 Properties |
| 2013 | £258,714 | -10% |
14 Properties |
| 2012 | £285,700 | 6% |
5 Properties |
| 2011 | £268,000 | 9% |
11 Properties |
| 2010 | £242,600 | -5% |
14 Properties |
| 2009 | £254,579 | -29% |
12 Properties |
| 2008 | £328,277 | 14% |
18 Properties |
| 2007 | £281,113 | 6% |
15 Properties |
| 2006 | £265,588 | 19% |
17 Properties |
| 2005 | £216,133 | -2% |
9 Properties |
| 2004 | £219,907 | -0,4% |
19 Properties |
| 2003 | £220,882 | 11% |
17 Properties |
| 2002 | £195,595 | -1% |
21 Properties |
| 2001 | £196,853 | 30% |
24 Properties |
| 2000 | £137,216 | -9% |
28 Properties |
| 1999 | £150,194 | 19% |
29 Properties |
| 1998 | £122,058 | 4% |
17 Properties |
| 1997 | £117,736 | 22% |
26 Properties |
| 1996 | £91,569 | 5% |
13 Properties |
| 1995 | £86,920 | - |
12 Properties |
Property Price per Property Type in Bromesberrow And Dymock
Here you can find historic sold price data in order to help with your property search.
The average Property Paid Price for specific property types in the last three years are:
| Property Type | Average Sold Price | Sold Properties |
|---|---|---|
| Semi Detached House | £351,428.00 | 7 Semi Detached Houses |
| Detached House | £503,119.00 | 21 Detached Houses |
| Terraced House | £286,166.00 | 6 Terraced Houses |
| Flat | £269,983.00 | 3 Flats |

