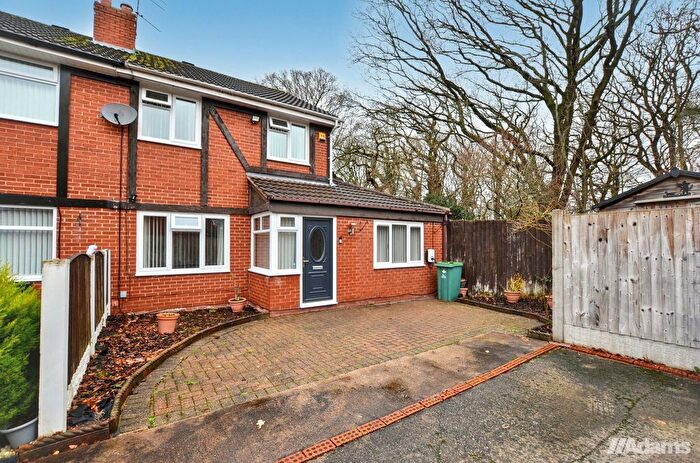
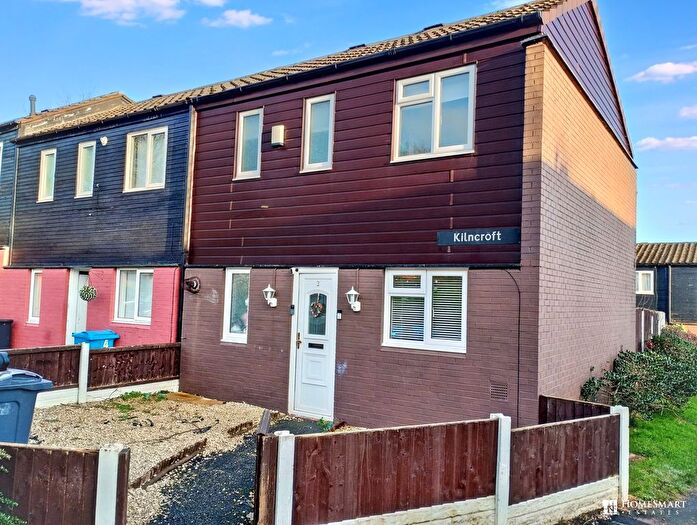
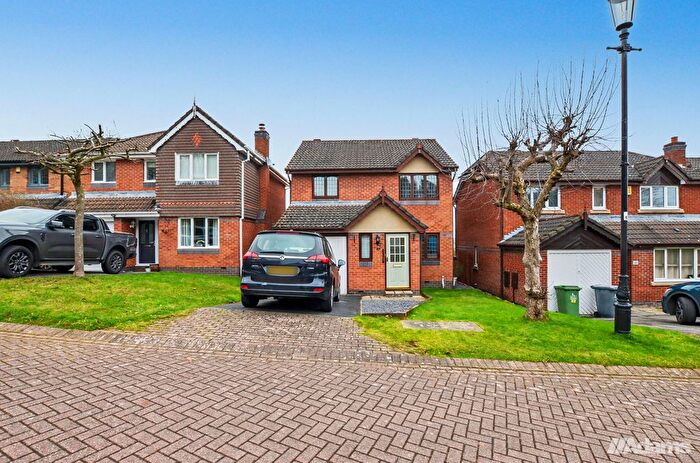
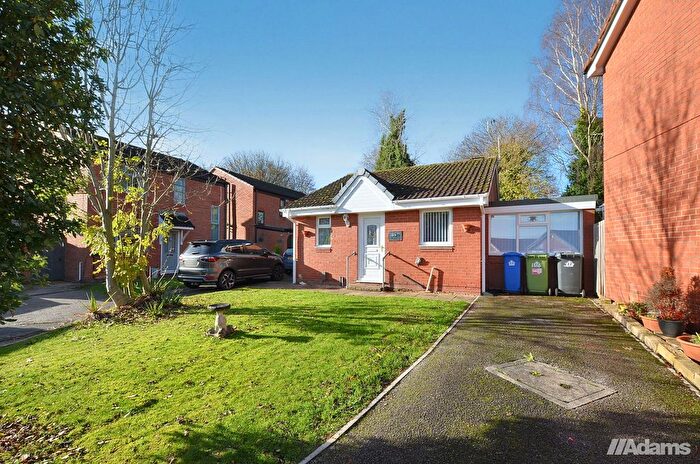
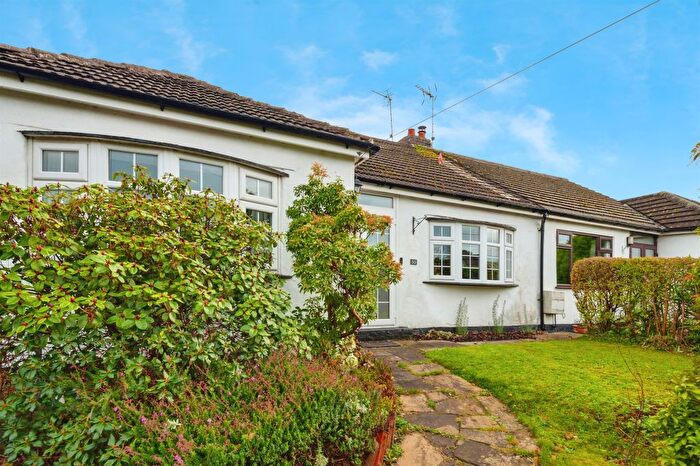
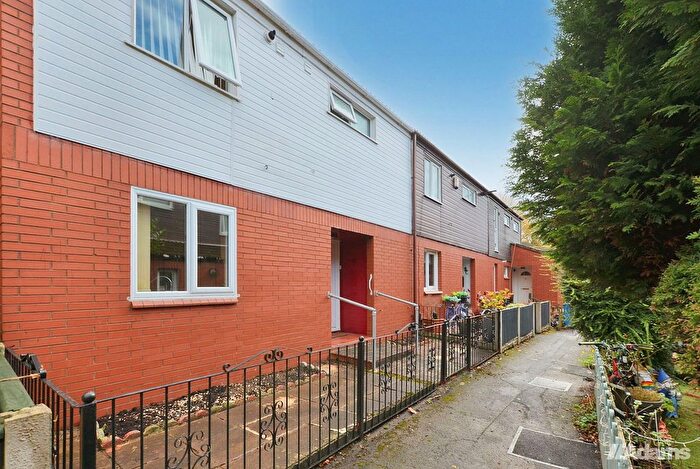
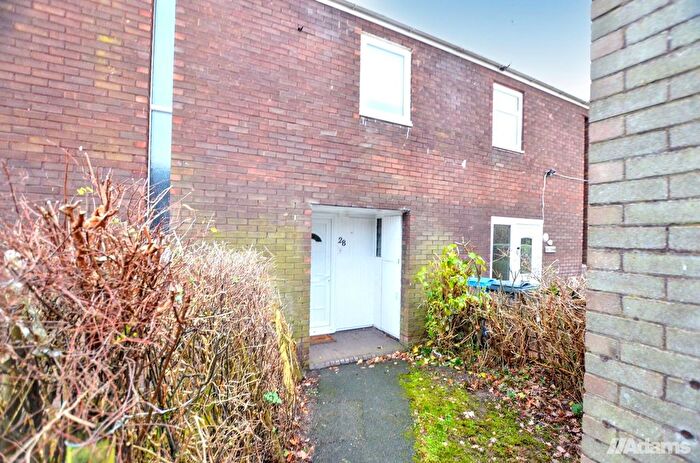
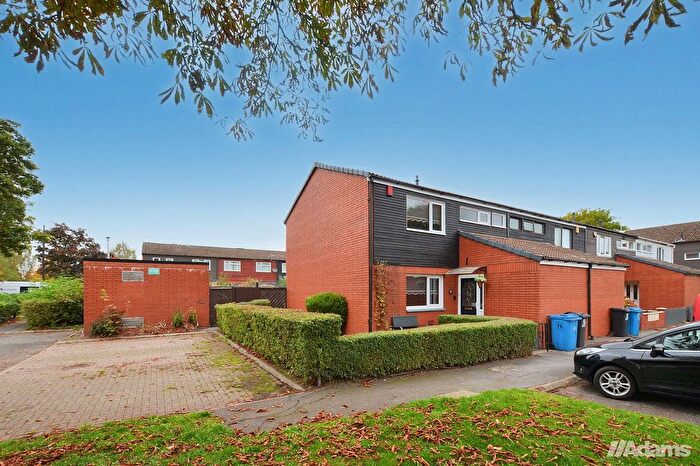
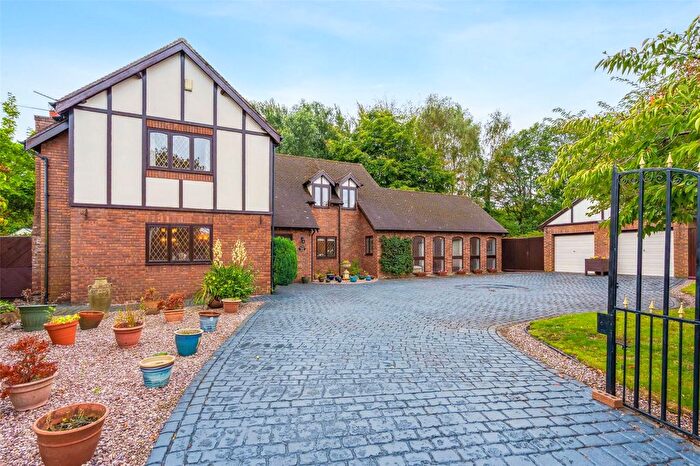
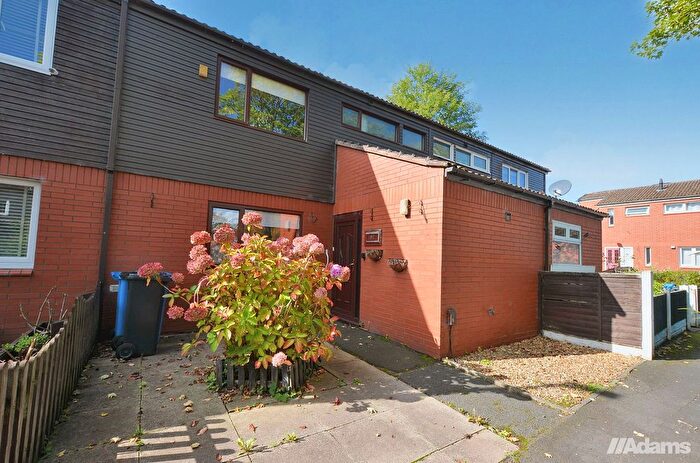
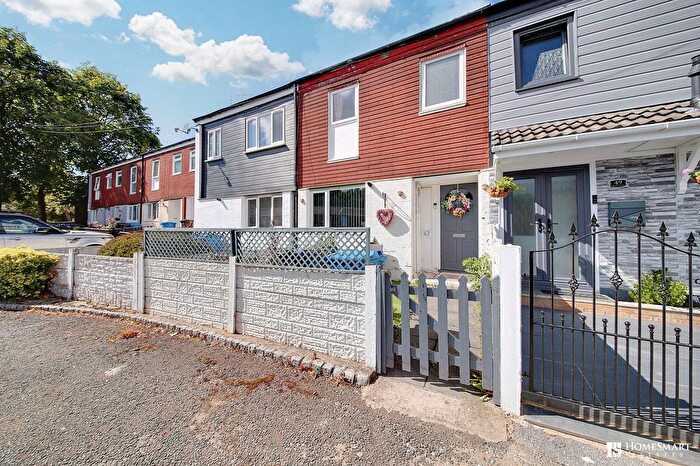
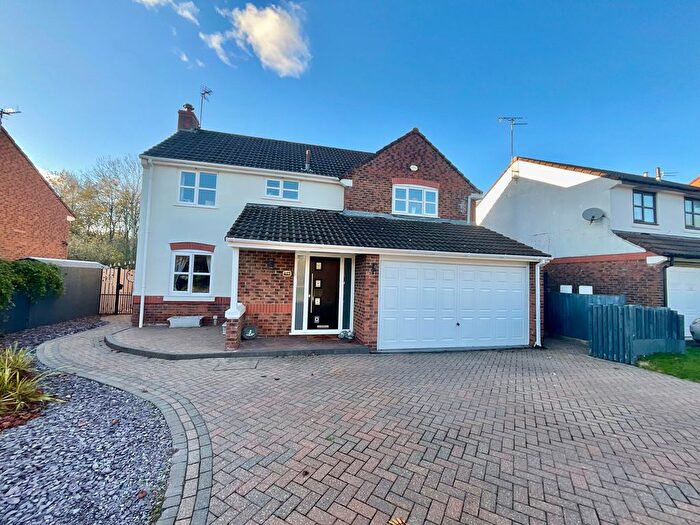
Houses for sale & to rent in Norton South, Runcorn
House Prices in Norton South
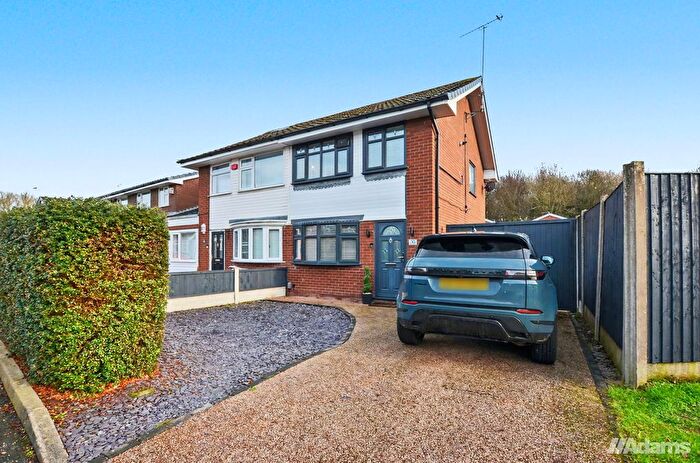
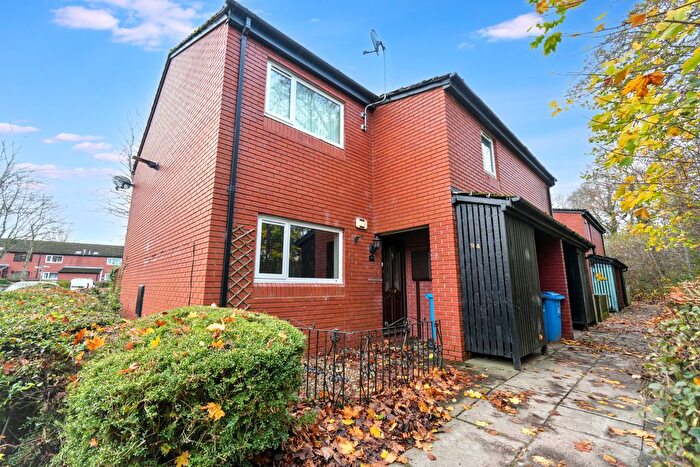
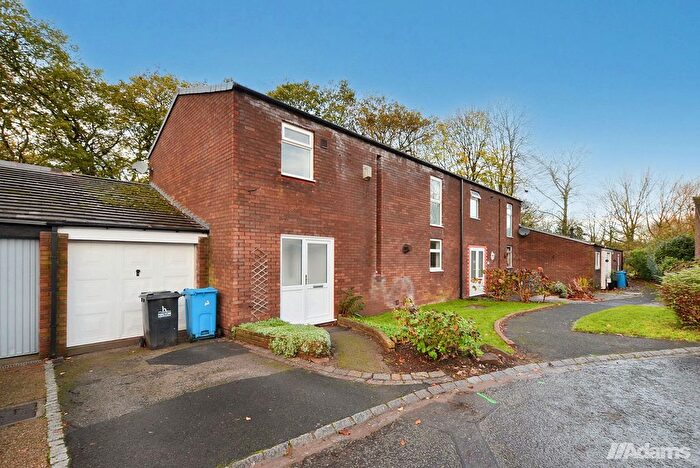
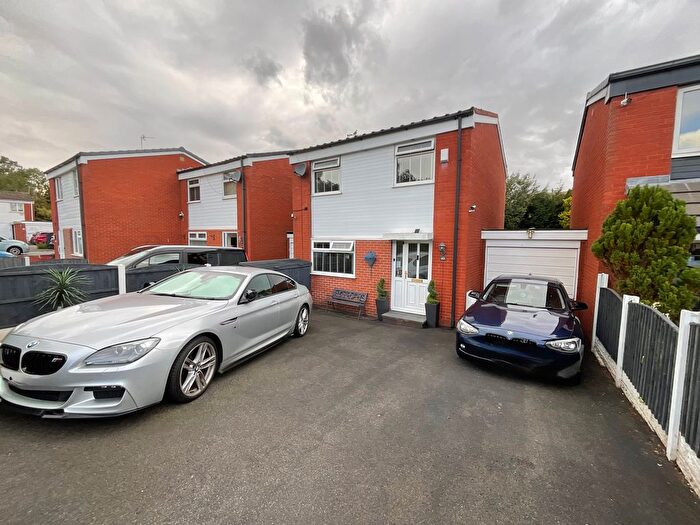
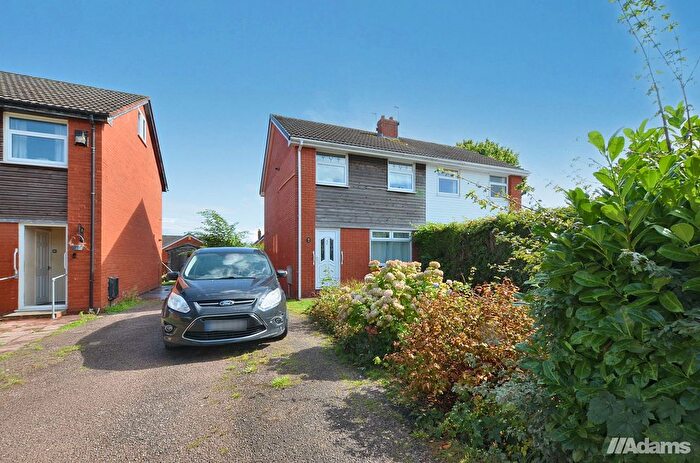
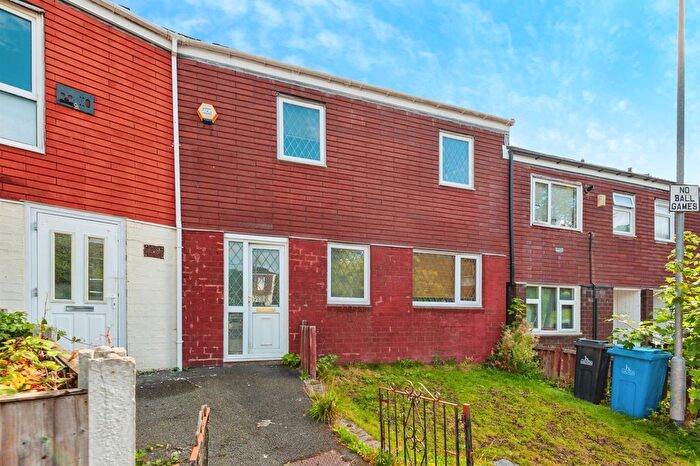
Properties in Norton South have an average house price of £131,904.00 and had 132 Property Transactions within the last 3 years¹.
Norton South is an area in Runcorn, Halton with 2,596 households², where the most expensive property was sold for £256,000.00.
Properties for sale in Norton South
Previously listed properties in Norton South
Roads and Postcodes in Norton South
Navigate through our locations to find the location of your next house in Norton South, Runcorn for sale or to rent.
| Streets | Postcodes |
|---|---|
| Abington Walk | WA7 6HF |
| Ainley Close | WA7 6BS |
| Anchor Close | WA7 6DF |
| Backford Close | WA7 6LR |
| Bartlegate Close | WA7 6BX |
| Bodmin Close | WA7 6AP WA7 6AR |
| Bournemouth Close | WA7 6DS |
| Calverley Close | WA7 6HG |
| Camborne Close | WA7 6AZ |
| Chichester Close | WA7 6DQ |
| Clovelly Grove | WA7 6EL WA7 6EQ |
| Clover Court | WA7 6BU |
| Compass Close | WA7 6DL |
| Coney Grove | WA7 6BT |
| Fleetwood Walk | WA7 6DZ WA7 6EA |
| Folkestone Way | WA7 6EB |
| Fountains Close | WA7 6HE |
| Gillan Close | WA7 6EW |
| Goulders Court | WA7 6BY |
| Granby Close | WA7 6LS |
| Halsall Close | WA7 6LT |
| Helston Close | WA7 6AA |
| Heysham Close | WA7 6DT |
| Hoylake Close | WA7 6DU |
| Kilncroft | WA7 6BH WA7 6BQ |
| Launceston Close | WA7 6BA |
| Linwood Close | WA7 6HD |
| Liskeard Close | WA7 6AH WA7 6AJ |
| Masseyfield Road | WA7 6AB WA7 6AD WA7 6AE |
| Mevagissey Road | WA7 6BD |
| Mooring Close | WA7 6DA |
| Mullion Close | WA7 6AQ |
| Navigation Close | WA7 6DD WA7 6DE |
| Newbridge Close | WA7 6AU |
| Newlyn Close | WA7 6AS |
| Newquay Close | WA7 6AY |
| Northwich Road | WA7 6PE |
| Oxmoor Close | WA7 6BW |
| Parkgate Way | WA7 6DX |
| Peckfield Close | WA7 6BP |
| Pickmere Drive | WA7 6HA WA7 6HB |
| Porthleven Road | WA7 6BE WA7 6BG |
| Redruth Close | WA7 6AX |
| Rose Close | WA7 6DJ |
| Rushfield Crescent | WA7 6BN |
| Saltash Close | WA7 6AG |
| Saltwood Drive | WA7 6LU |
| Sanders Hey Close | WA7 6BL |
| Schooner Close | WA7 6DB |
| Sennen Close | WA7 6EN |
| Spinnaker Close | WA7 6DH |
| St Austell Close | WA7 6AN WA7 6AW |
| Stratton Close | WA7 6AL |
| The Hove | WA7 6ED WA7 6EE |
| Tintagel Close | WA7 6AT |
| Trenance Close | WA7 6EG |
| Truro Close | WA7 6BB |
| Waterford Way | WA7 6DY |
| Wellbrook Close | WA7 6LX |
| Woodhatch Road | WA7 6BJ |
Transport near Norton South
- FAQ
- Price Paid By Year
- Property Type Price
Frequently asked questions about Norton South
What is the average price for a property for sale in Norton South?
The average price for a property for sale in Norton South is £131,904. This amount is 24% lower than the average price in Runcorn. There are 115 property listings for sale in Norton South.
What streets have the most expensive properties for sale in Norton South?
The streets with the most expensive properties for sale in Norton South are Helston Close at an average of £221,000, Saltwood Drive at an average of £215,333 and Fountains Close at an average of £194,000.
What streets have the most affordable properties for sale in Norton South?
The streets with the most affordable properties for sale in Norton South are Tintagel Close at an average of £75,000, St Austell Close at an average of £86,737 and Compass Close at an average of £96,000.
Which train stations are available in or near Norton South?
Some of the train stations available in or near Norton South are Runcorn East, Frodsham and Runcorn.
Property Price Paid in Norton South by Year
The average sold property price by year was:
| Year | Average Sold Price | Price Change |
Sold Properties
|
|---|---|---|---|
| 2025 | £148,777 | 12% |
35 Properties |
| 2024 | £131,622 | 8% |
43 Properties |
| 2023 | £121,193 | -5% |
54 Properties |
| 2022 | £126,815 | 10% |
54 Properties |
| 2021 | £113,610 | 13% |
55 Properties |
| 2020 | £98,278 | 1% |
37 Properties |
| 2019 | £96,828 | 1% |
59 Properties |
| 2018 | £95,588 | 6% |
44 Properties |
| 2017 | £90,294 | 8% |
49 Properties |
| 2016 | £82,647 | -9% |
43 Properties |
| 2015 | £90,145 | 11% |
40 Properties |
| 2014 | £79,890 | -8% |
42 Properties |
| 2013 | £85,976 | 10% |
30 Properties |
| 2012 | £77,724 | -7% |
37 Properties |
| 2011 | £82,885 | 4% |
35 Properties |
| 2010 | £79,223 | -6% |
21 Properties |
| 2009 | £83,879 | -11% |
24 Properties |
| 2008 | £93,519 | -6% |
39 Properties |
| 2007 | £99,516 | 10% |
93 Properties |
| 2006 | £89,083 | 6% |
82 Properties |
| 2005 | £83,486 | 14% |
76 Properties |
| 2004 | £71,961 | 22% |
91 Properties |
| 2003 | £56,465 | 26% |
103 Properties |
| 2002 | £41,931 | 8% |
80 Properties |
| 2001 | £38,609 | 9% |
68 Properties |
| 2000 | £35,005 | -1% |
68 Properties |
| 1999 | £35,288 | 0,3% |
67 Properties |
| 1998 | £35,170 | 4% |
42 Properties |
| 1997 | £33,733 | -1% |
37 Properties |
| 1996 | £33,907 | -2% |
50 Properties |
| 1995 | £34,673 | - |
58 Properties |
Property Price per Property Type in Norton South
Here you can find historic sold price data in order to help with your property search.
The average Property Paid Price for specific property types in the last three years are:
| Property Type | Average Sold Price | Sold Properties |
|---|---|---|
| Semi Detached House | £167,732.00 | 28 Semi Detached Houses |
| Detached House | £188,399.00 | 10 Detached Houses |
| Terraced House | £115,859.00 | 93 Terraced Houses |
| Flat | £56,000.00 | 1 Flat |

