
Houses for sale & to rent in Kingsley, Runcorn
House Prices in Kingsley
Properties in Kingsley have an average house price of £316k and had 12 Property Transactions within the last 3 years¹.
Kingsley is an area in Runcorn, Cheshire with 203 households², where the most expensive property was sold for £620k.
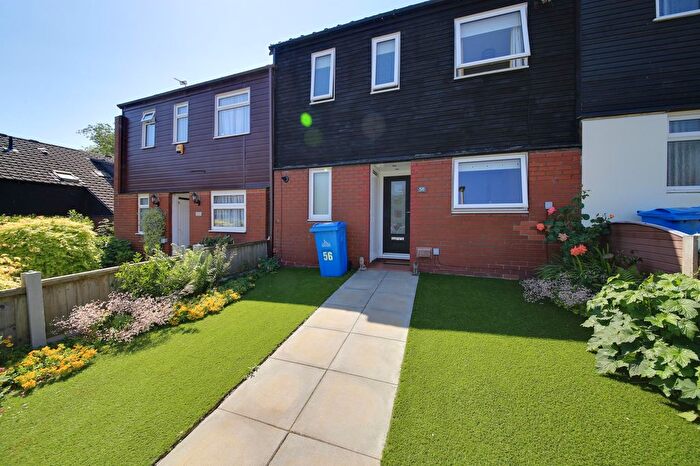
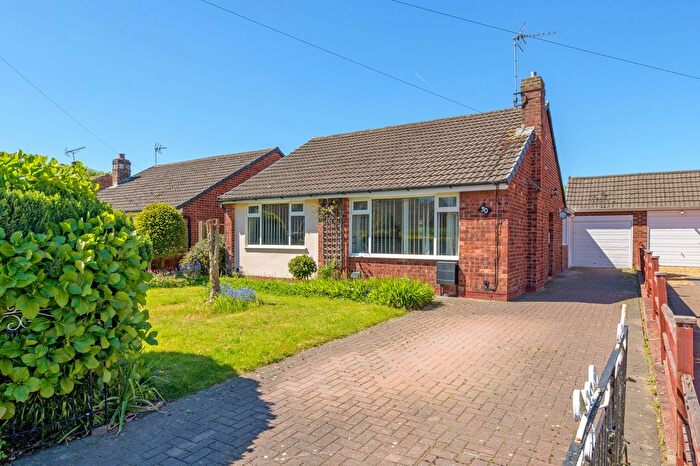
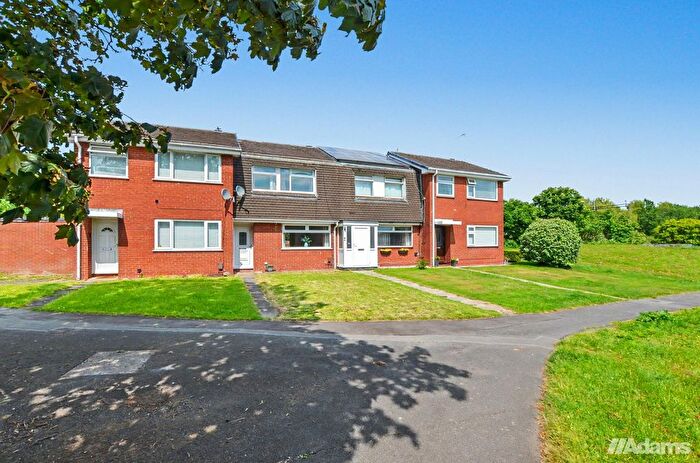
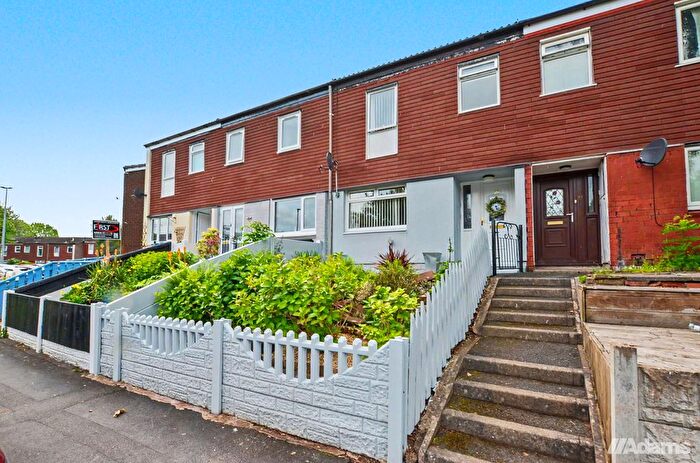
Properties for sale in Kingsley
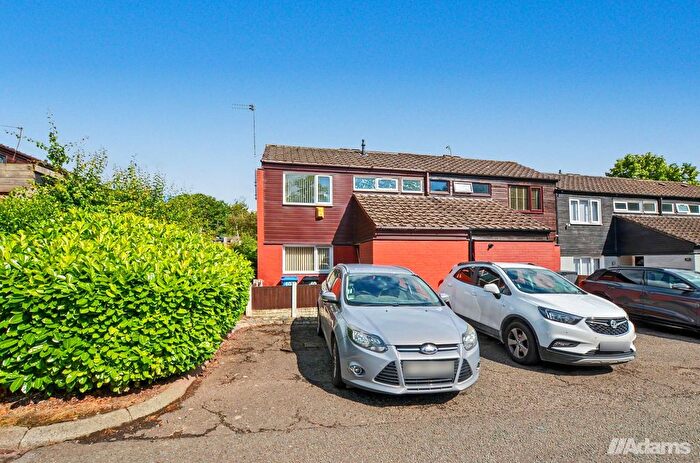
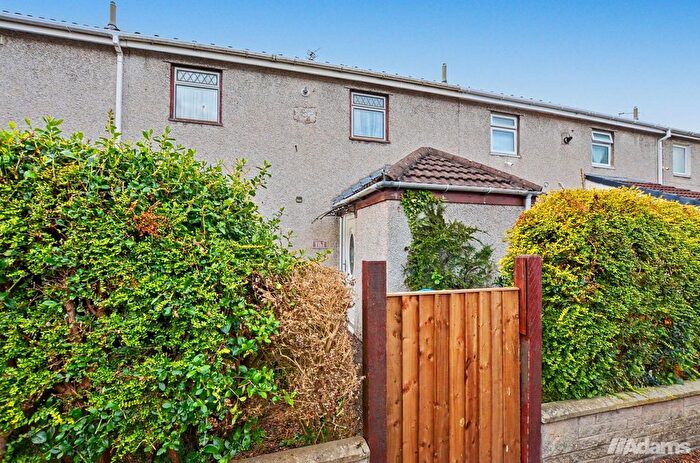
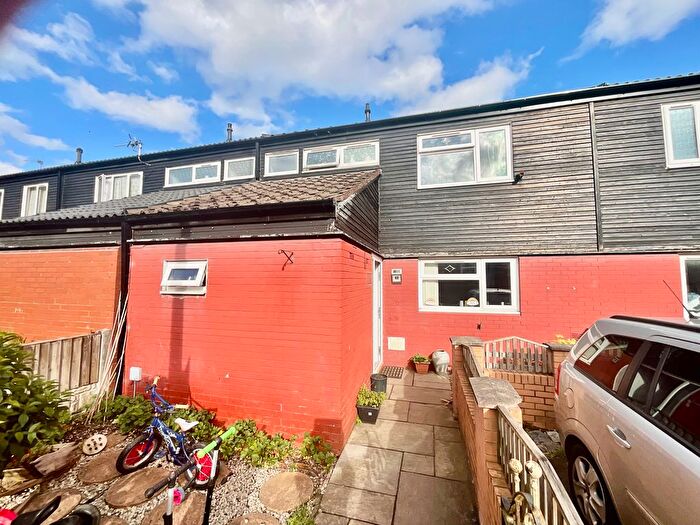
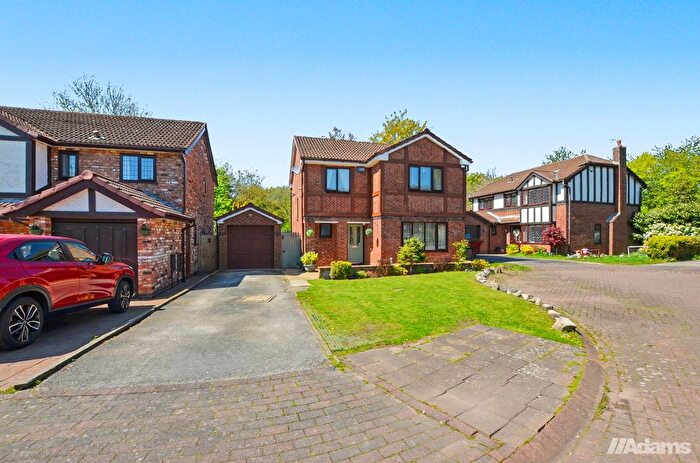
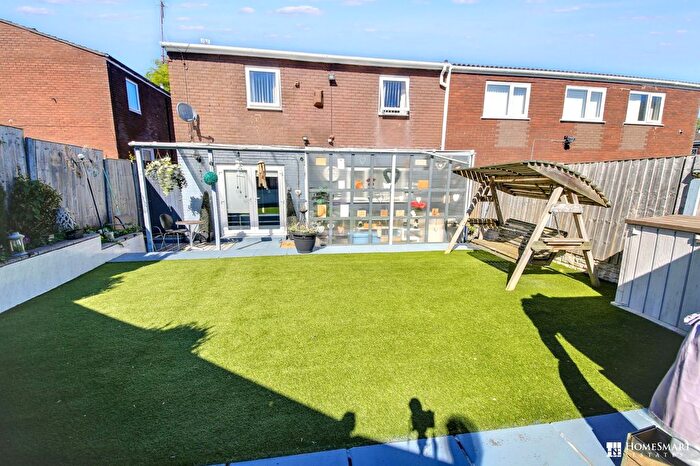
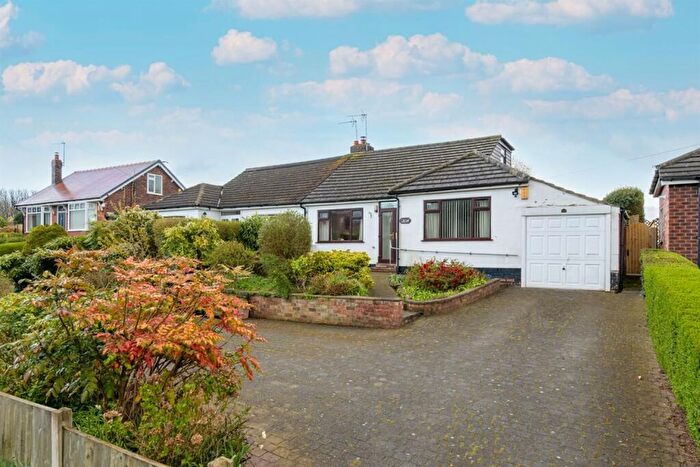
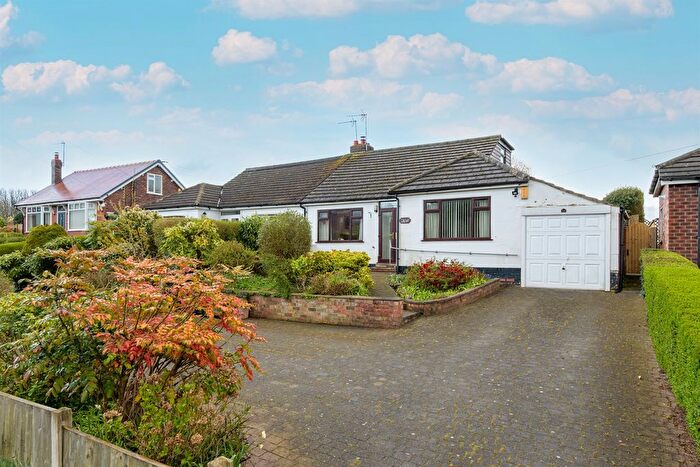
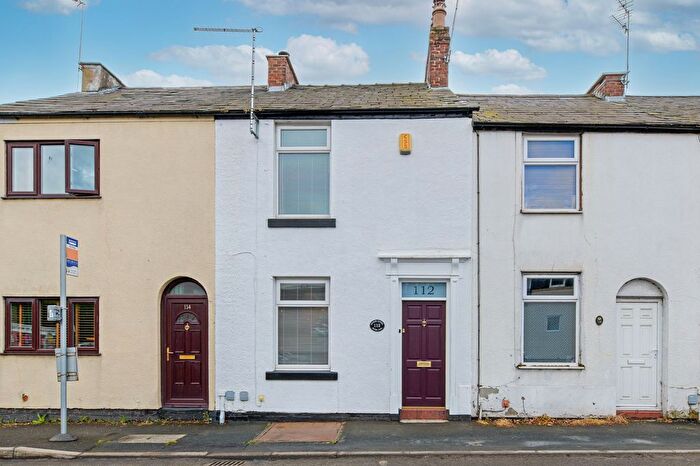
Previously listed properties in Kingsley

![]()
If you are looking to sell your house, let it out, or receive a property valuation, an expert can help you.
Click the button below to get started.
Roads and Postcodes in Kingsley
Navigate through our locations to find the location of your next house in Kingsley, Runcorn for sale or to rent.
| Streets | Postcodes |
|---|---|
| Aston Lane | WA7 3BU WA7 3DE WA7 3DH WA7 3ED WA7 3FX |
| Beech Road | WA7 3ER |
| Cedar Avenue | WA7 3ET |
| Chester Road | WA7 3DY WA7 3DZ WA7 3EA WA7 3EB WA7 3EE WA7 3EG WA7 3EX WA7 3GF |
| Halton Station Road | WA7 3EW |
| Station Road | WA7 3EP |
| Sycamore Drive | WA7 3EU |
Transport near Kingsley

- FAQ
- Price Paid By Year
- Property Type Price
Frequently asked questions about Kingsley
What is the average price for a property for sale in Kingsley?
The average price for a property for sale in Kingsley is £315,833. There are 390 property listings for sale in Kingsley.
What streets have the most expensive properties for sale in Kingsley?
The streets with the most expensive properties for sale in Kingsley are Aston Lane at an average of £423,500, Chester Road at an average of £358,333 and Cedar Avenue at an average of £260,000.
What streets have the most affordable properties for sale in Kingsley?
The streets with the most affordable properties for sale in Kingsley are Beech Road at an average of £228,333 and Sycamore Drive at an average of £239,500.
Which train stations are available in or near Kingsley?
Some of the train stations available in or near Kingsley are Runcorn East, Frodsham and Runcorn.
Property Price Paid in Kingsley by Year
The average sold property price by year was:
| Year | Average Sold Price | Price Change |
Sold Properties
|
|---|---|---|---|
| 2025 | £253,625 | -38% |
4 Properties |
| 2024 | £349,583 | 3% |
6 Properties |
| 2023 | £339,000 | -8% |
2 Properties |
| 2022 | £364,444 | 30% |
9 Properties |
| 2021 | £256,458 | -23% |
6 Properties |
| 2020 | £316,500 | 13% |
8 Properties |
| 2019 | £274,204 | 1% |
11 Properties |
| 2018 | £271,285 | 14% |
7 Properties |
| 2017 | £234,166 | -10% |
9 Properties |
| 2016 | £257,611 | 0,4% |
9 Properties |
| 2015 | £256,571 | 35% |
7 Properties |
| 2014 | £165,899 | -2% |
5 Properties |
| 2013 | £168,461 | 4% |
13 Properties |
| 2012 | £162,333 | -99% |
3 Properties |
| 2011 | £322,500 | 32% |
4 Properties |
| 2010 | £218,666 | 9% |
3 Properties |
| 2009 | £199,625 | 1% |
4 Properties |
| 2008 | £198,006 | -20% |
5 Properties |
| 2007 | £236,835 | 37% |
14 Properties |
| 2006 | £148,618 | -41% |
8 Properties |
| 2005 | £209,750 | 2% |
10 Properties |
| 2004 | £205,884 | -16% |
13 Properties |
| 2003 | £239,716 | 35% |
9 Properties |
| 2002 | £154,972 | 30% |
11 Properties |
| 2001 | £107,726 | -1% |
13 Properties |
| 2000 | £109,281 | 6% |
14 Properties |
| 1999 | £102,750 | 38% |
6 Properties |
| 1998 | £63,345 | -14% |
10 Properties |
| 1997 | £72,100 | 24% |
5 Properties |
| 1996 | £55,077 | -10% |
9 Properties |
| 1995 | £60,350 | - |
4 Properties |
Property Price per Property Type in Kingsley
Here you can find historic sold price data in order to help with your property search.
The average Property Paid Price for specific property types in the last three years are:
| Property Type | Average Sold Price | Sold Properties |
|---|---|---|
| Semi Detached House | £265,500.00 | 5 Semi Detached Houses |
| Terraced House | £480,000.00 | 2 Terraced Houses |
| Detached House | £300,500.00 | 5 Detached Houses |