
Houses for sale & to rent in Town, London
House Prices in Town
Properties in this part of Town within London have an average house price of £1,047,881.00 and had 392 Property Transactions within the last 3 years¹. This area has 4,927 households² , where the most expensive property was sold for £4,115,000.00.
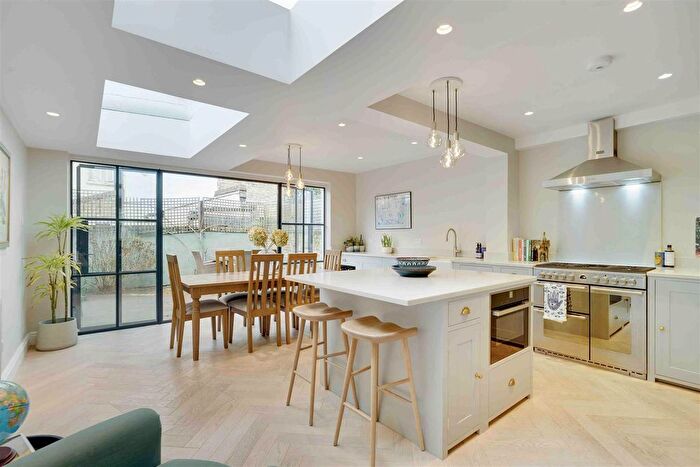
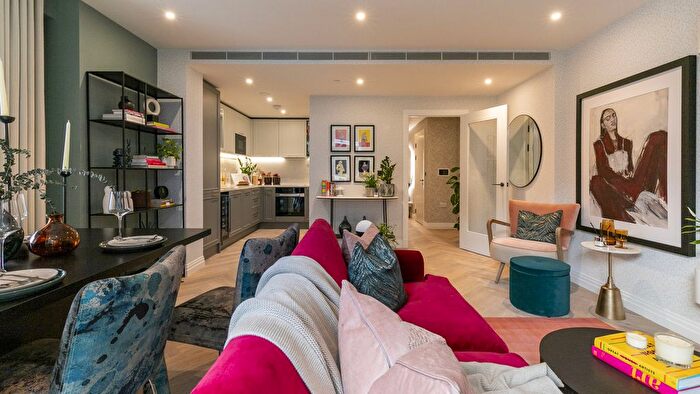
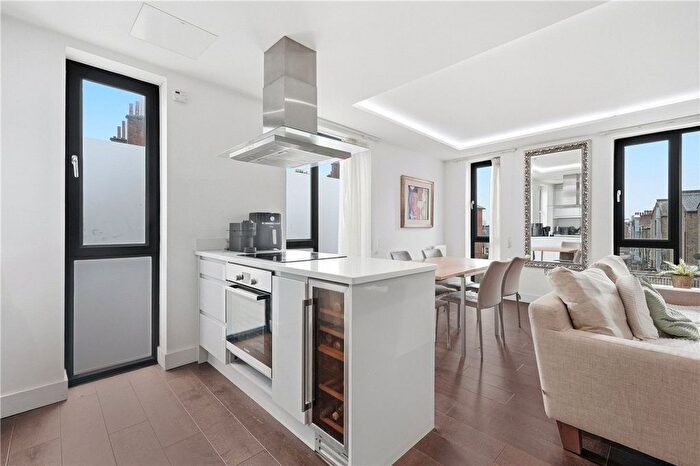
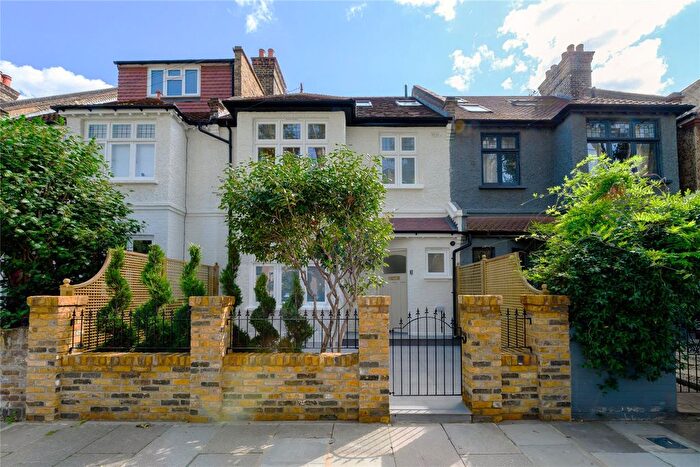
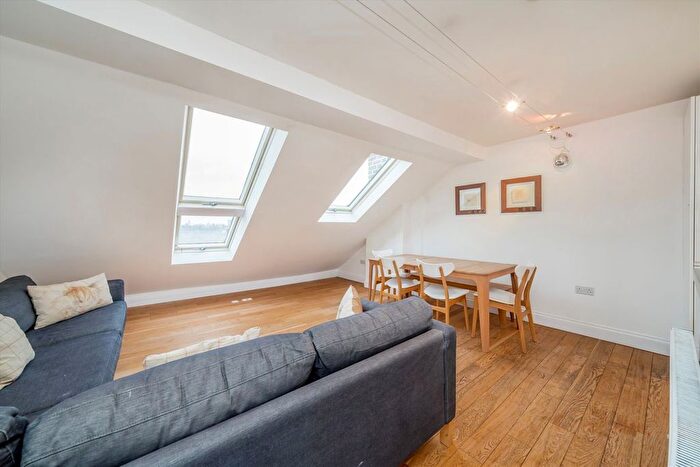
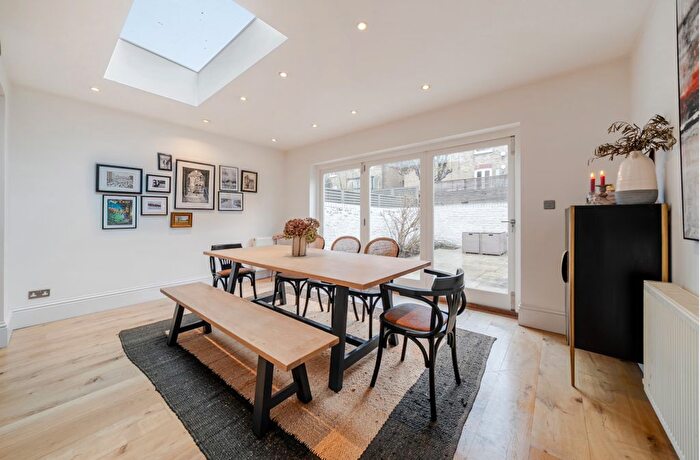
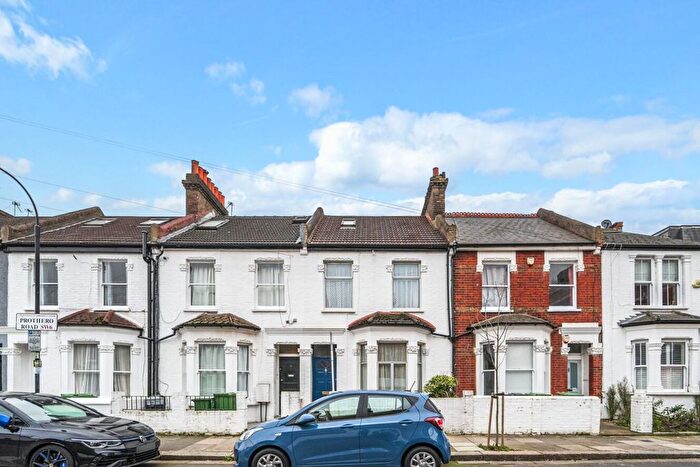
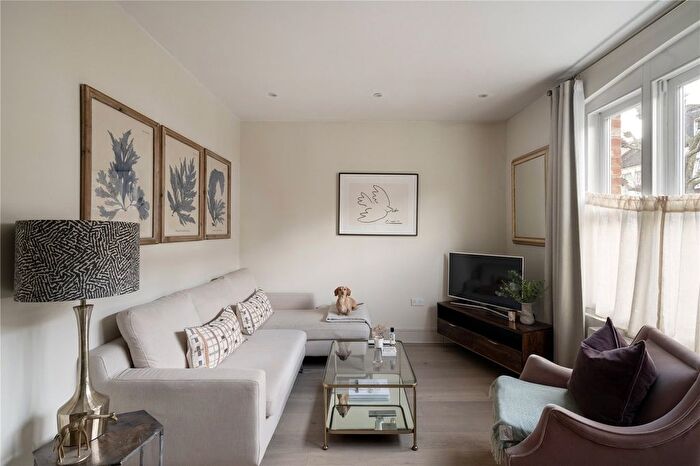
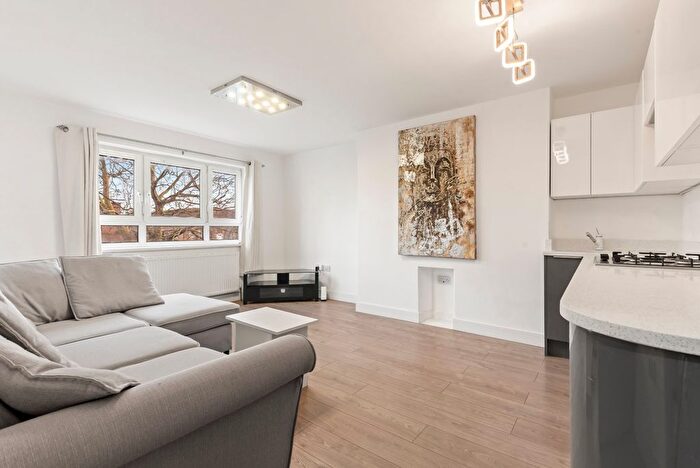
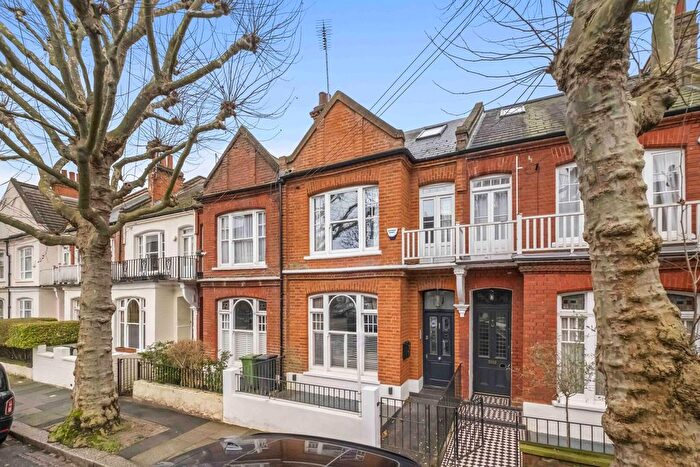
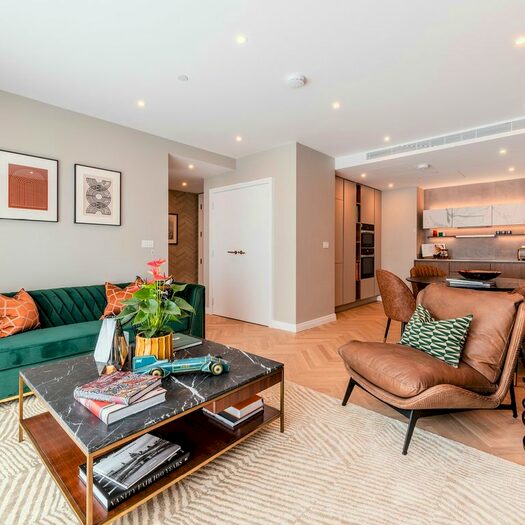
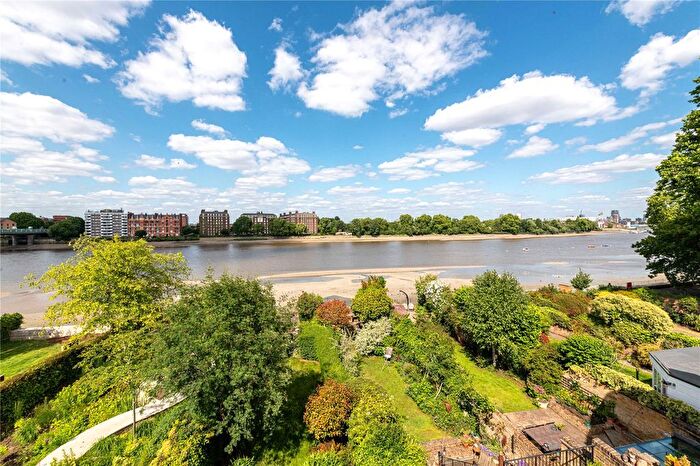
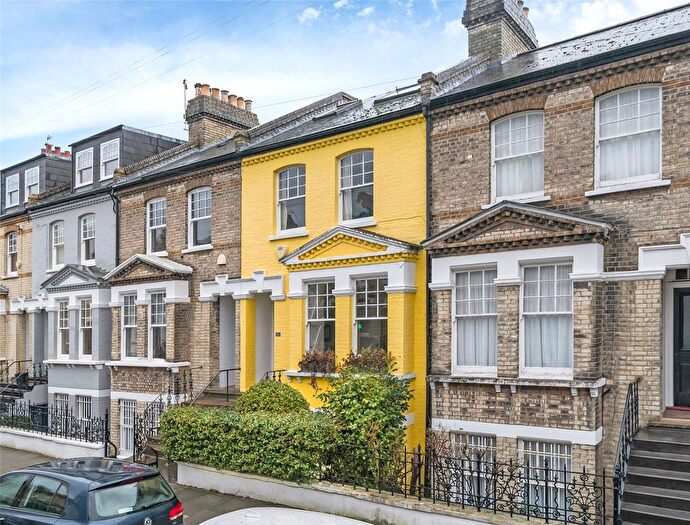
Properties for sale in Town
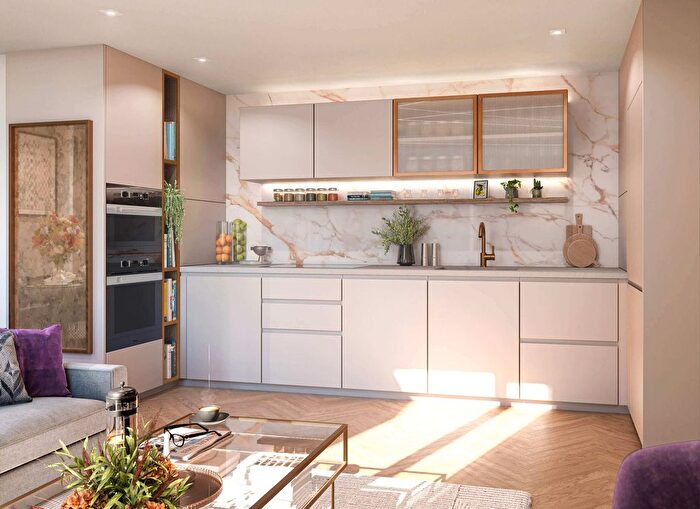
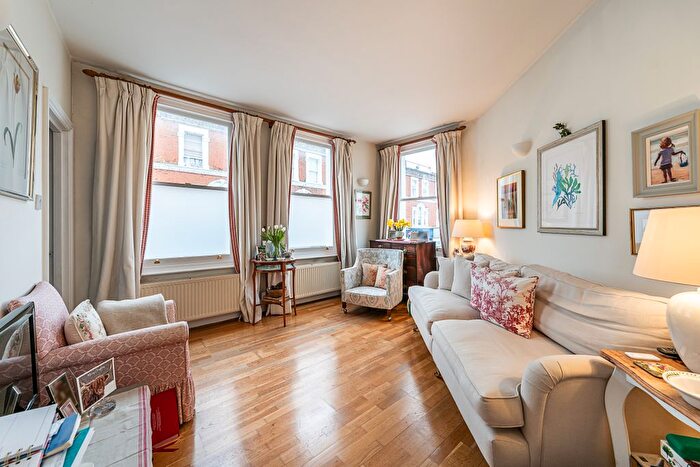
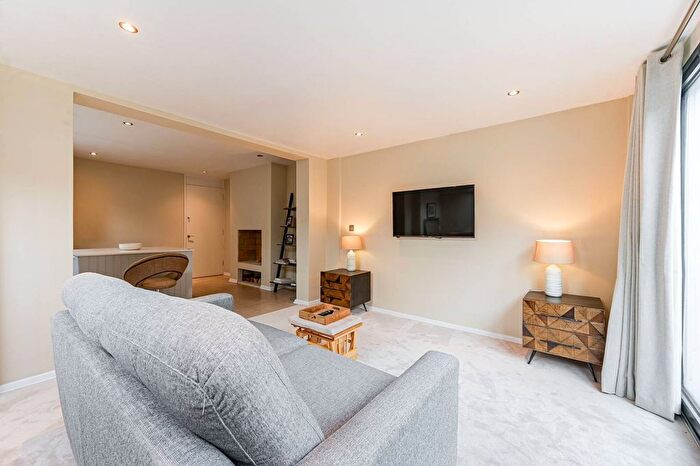
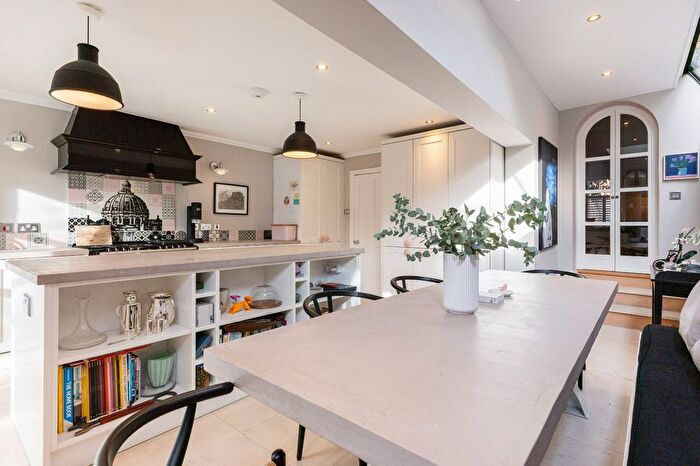
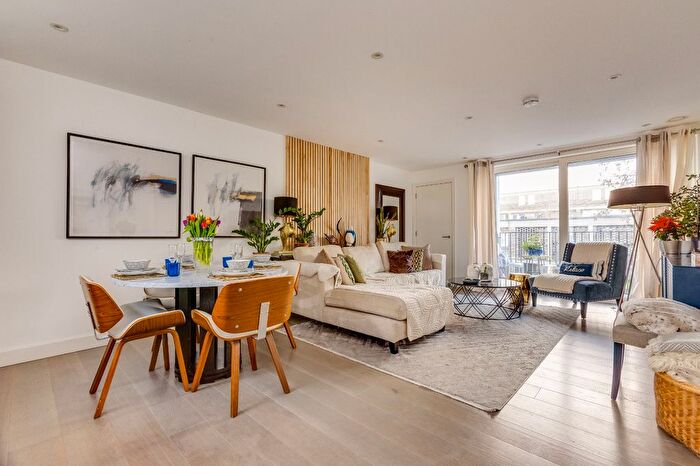
![]()
If you are looking to sell your house, let it out, or receive a property valuation, an expert can help you.
Click the button below to get started.
Roads and Postcodes in Town
Navigate through our locations to find the location of your next house in Town, London for sale or to rent.
Transport near Town
-
 Parsons Green Station
 -
Fulham Broadway Station
-
Putney Bridge Station
-

 West Brompton Station
 -
Imperial Wharf Station
-
West Kensington Station
-
Barons Court Station
-
Earls Court Station
-
Putney Station
-
Wandsworth Town Station
- FAQ
- Price Paid By Year
- Property Type Price
Frequently asked questions about Town
What is the average price for a property for sale in Town?
The average price for a property for sale in Town is £1,047,881. This amount is 9% higher than the average price in London. There are 6,504 property listings for sale in Town.
What streets have the most expensive properties for sale in Town?
The streets with the most expensive properties for sale in Town are Doria Road at an average of £2,865,000, Guion Road at an average of £2,696,250 and St Maur Road at an average of £2,659,500.
What streets have the most affordable properties for sale in Town?
The streets with the most affordable properties for sale in Town are Landridge Road at an average of £408,289, Barclay Close at an average of £408,500 and Burlington Gardens at an average of £429,583.
Which train stations are available in or near Town?
Some of the train stations available in or near Town are West Brompton, Imperial Wharf and Putney.
Which tube stations are available in or near Town?
Some of the tube stations available in or near Town are Parsons Green, Fulham Broadway and Putney Bridge.
Property Price Paid in Town by Year
The average sold property price by year was:
| Year | Average Sold Price | Price Change |
Sold Properties
|
|---|---|---|---|
| 2025 | £1,066,768 | 7% |
99 Properties |
| 2024 | £988,148 | -12% |
160 Properties |
| 2023 | £1,105,682 | -5% |
133 Properties |
| 2022 | £1,160,696 | 1% |
184 Properties |
| 2021 | £1,147,552 | 4% |
203 Properties |
| 2020 | £1,104,394 | 13% |
122 Properties |
| 2019 | £964,291 | -9% |
135 Properties |
| 2018 | £1,046,575 | -2% |
142 Properties |
| 2017 | £1,067,680 | -4% |
128 Properties |
| 2016 | £1,114,337 | 5% |
151 Properties |
| 2015 | £1,055,454 | 7% |
180 Properties |
| 2014 | £981,638 | -3% |
183 Properties |
| 2013 | £1,010,486 | 16% |
209 Properties |
| 2012 | £847,713 | 15% |
192 Properties |
| 2011 | £717,225 | -12% |
203 Properties |
| 2010 | £804,705 | 18% |
181 Properties |
| 2009 | £657,430 | 16% |
143 Properties |
| 2008 | £552,301 | -10% |
104 Properties |
| 2007 | £605,742 | 11% |
263 Properties |
| 2006 | £537,076 | 13% |
315 Properties |
| 2005 | £464,917 | 8% |
221 Properties |
| 2004 | £425,753 | 6% |
266 Properties |
| 2003 | £401,393 | 1% |
241 Properties |
| 2002 | £395,480 | 8% |
313 Properties |
| 2001 | £364,627 | 14% |
282 Properties |
| 2000 | £312,077 | 11% |
278 Properties |
| 1999 | £278,411 | 15% |
366 Properties |
| 1998 | £237,541 | 10% |
273 Properties |
| 1997 | £212,917 | 22% |
309 Properties |
| 1996 | £166,358 | 4% |
320 Properties |
| 1995 | £160,402 | - |
266 Properties |
Property Price per Property Type in Town
Here you can find historic sold price data in order to help with your property search.
The average Property Paid Price for specific property types in the last three years are:
| Property Type | Average Sold Price | Sold Properties |
|---|---|---|
| Flat | £671,926.00 | 271 Flats |
| Detached House | £2,221,666.00 | 3 Detached Houses |
| Terraced House | £1,881,127.00 | 113 Terraced Houses |
| Semi Detached House | £1,889,000.00 | 5 Semi Detached Houses |