Houses for sale & to rent in London, Hammersmith and Fulham London Borough
House Prices in London, Hammersmith and Fulham London Borough
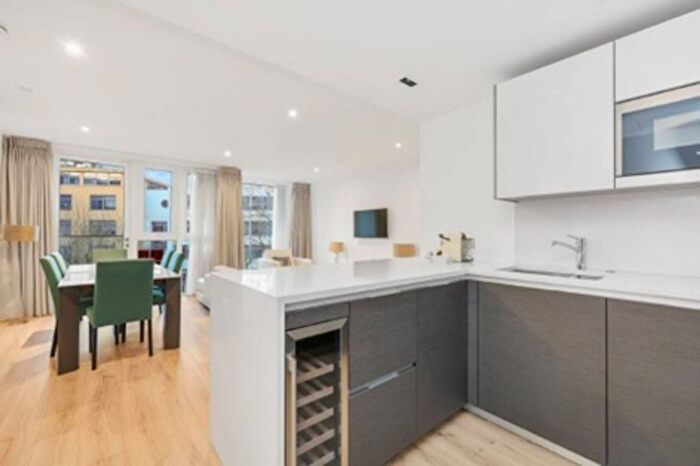
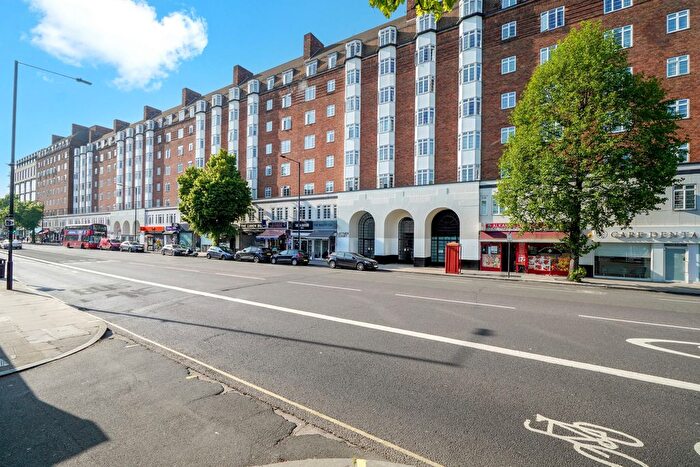
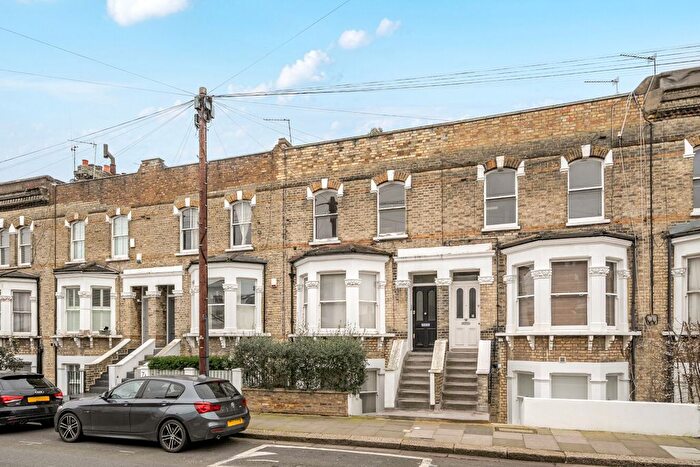
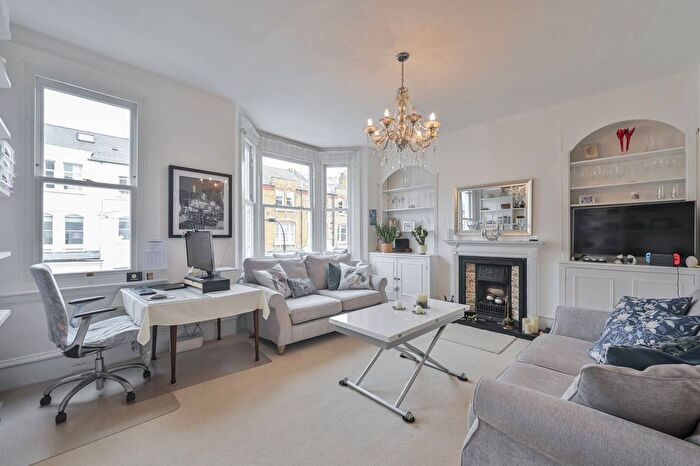
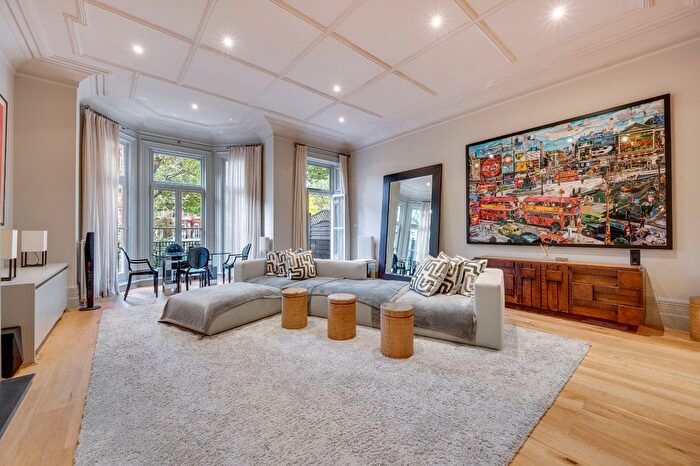
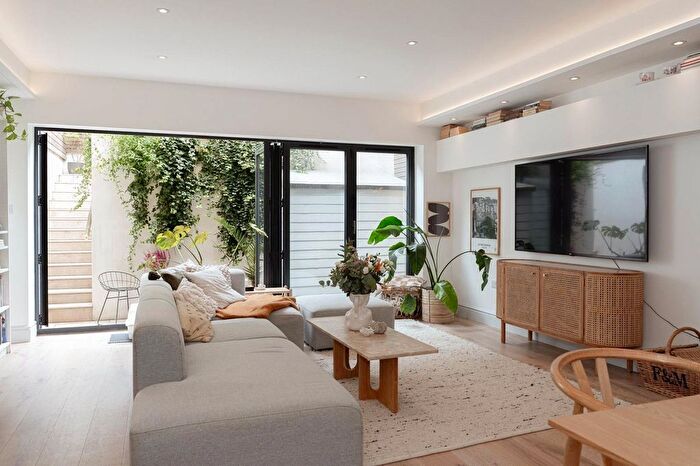
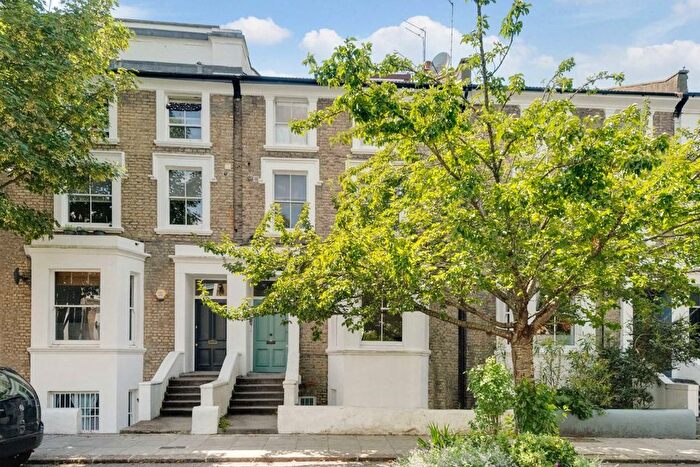
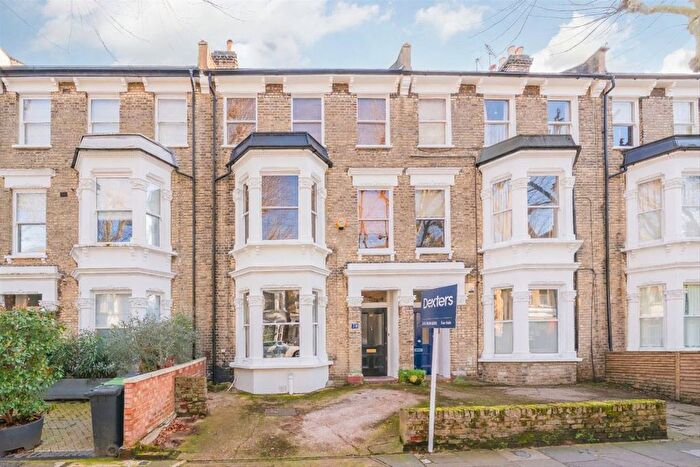
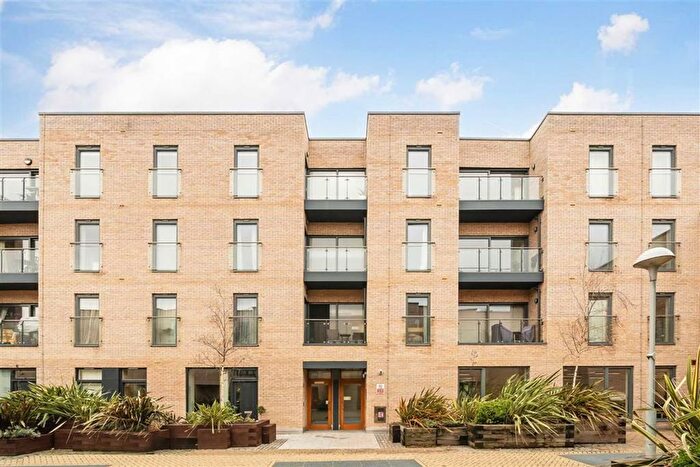
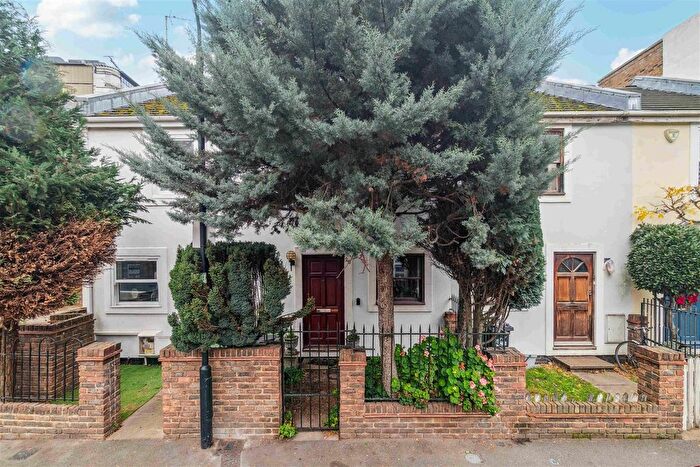
Properties in this part of London within the Hammersmith and Fulham London Borough have an average house price of £966,443.00 and had 6,054 Property Transactions within the last 3 years.¹ This area has 80,543 households² , where the most expensive property was sold for £11,180,000.00.
Properties for sale in London, Hammersmith and Fulham London Borough
Neighbourhoods in London, Hammersmith and Fulham London Borough
Navigate through our locations to find the location of your next house in London, Hammersmith and Fulham London Borough for sale or to rent.
- Munster
- Addison
- Askew
- Avonmore And Brook Green
- College Park And Old Oak
- Fulham Broadway
- Fulham Reach
- Hammersmith Broadway
- North End
- Palace Riverside
- Parsons Green And Walham
- Ravenscourt Park
- Sands End
- Shepherds Bush Green
- Town
- Wormholt And White City
- Fulham Town
- Coningham
- Wendell Park
- Brook Green
- College Park & Old Oak
- Walham Green
- Lillie
- Parsons Green & Sandford
- White City
- Avonmore
- Grove
- Ravenscourt
Transport in London, Hammersmith and Fulham London Borough
Please see below transportation links in this area:
-
Barons Court Station
-
Hammersmith (District) Station
-
West Kensington Station
-
Hammersmith (Met.) Station
-
Kensington (Olympia) Station
-
West Brompton Station
-
Ravenscourt Park Station
-
Earls Court Station
-
Goldhawk Road Station
-
Shepherds Bush Station
- FAQ
- Price Paid By Year
- Property Type Price
Frequently asked questions about London, Hammersmith and Fulham London Borough
What is the average price for a property for sale in London, Hammersmith and Fulham London Borough?
The average price for a property for sale in London, Hammersmith and Fulham London Borough is £966,443. There are more than 10,000 property listings for sale in London, Hammersmith and Fulham London Borough.
What locations have the most expensive properties for sale in London, Hammersmith and Fulham London Borough?
The locations with the most expensive properties for sale in London, Hammersmith and Fulham London Borough are Parsons Green And Walham at an average of £1,615,082, Palace Riverside at an average of £1,463,628 and Sands End at an average of £1,101,410.
What locations have the most affordable properties for sale in London, Hammersmith and Fulham London Borough?
The locations with the most affordable properties for sale in London, Hammersmith and Fulham London Borough are Wormholt And White City at an average of £623,576, College Park And Old Oak at an average of £626,248 and North End at an average of £642,236.
Which train stations are available in or near London, Hammersmith and Fulham London Borough?
Some of the train stations available in or near London, Hammersmith and Fulham London Borough are Kensington (Olympia), West Brompton and Shepherds Bush.
Which tube stations are available in or near London, Hammersmith and Fulham London Borough?
Some of the tube stations available in or near London, Hammersmith and Fulham London Borough are Barons Court, Hammersmith (District) and West Kensington.
Property Price Paid in London, Hammersmith and Fulham London Borough by Year
The average sold property price by year was:
| Year | Average Sold Price | Price Change |
Sold Properties
|
|---|---|---|---|
| 2025 | £915,919 | -9% |
1,644 Properties |
| 2024 | £997,107 | 3% |
2,348 Properties |
| 2023 | £971,807 | -2% |
2,062 Properties |
| 2022 | £989,694 | 2% |
2,597 Properties |
| 2021 | £971,892 | -1% |
2,954 Properties |
| 2020 | £980,799 | 7% |
2,280 Properties |
| 2019 | £914,639 | -8% |
2,199 Properties |
| 2018 | £985,717 | -0,5% |
2,512 Properties |
| 2017 | £990,452 | 6% |
2,432 Properties |
| 2016 | £930,722 | -1% |
2,490 Properties |
| 2015 | £938,886 | 6% |
2,744 Properties |
| 2014 | £881,237 | 13% |
3,038 Properties |
| 2013 | £763,318 | 12% |
3,077 Properties |
| 2012 | £674,507 | 5% |
2,640 Properties |
| 2011 | £637,573 | 3% |
2,725 Properties |
| 2010 | £621,415 | 11% |
2,520 Properties |
| 2009 | £554,177 | -2% |
1,955 Properties |
| 2008 | £564,568 | 5% |
1,670 Properties |
| 2007 | £534,691 | 15% |
3,874 Properties |
| 2006 | £452,864 | 8% |
4,196 Properties |
| 2005 | £417,991 | 7% |
3,261 Properties |
| 2004 | £386,745 | 8% |
3,676 Properties |
| 2003 | £357,022 | 3% |
3,373 Properties |
| 2002 | £345,552 | 11% |
4,092 Properties |
| 2001 | £306,695 | 8% |
3,706 Properties |
| 2000 | £281,024 | 14% |
3,674 Properties |
| 1999 | £240,615 | 18% |
4,365 Properties |
| 1998 | £196,922 | 11% |
3,617 Properties |
| 1997 | £176,146 | 15% |
4,276 Properties |
| 1996 | £150,175 | 8% |
4,022 Properties |
| 1995 | £138,082 | - |
3,050 Properties |
Property Price per Property Type in London, Hammersmith and Fulham London Borough
Here you can find historic sold price data in order to help with your property search.
The average Property Paid Price for specific property types in the last three years are:
| Property Type | Average Sold Price | Sold Properties |
|---|---|---|
| Semi Detached House | £2,004,679.00 | 121 Semi Detached Houses |
| Terraced House | £1,579,798.00 | 1,725 Terraced Houses |
| Detached House | £2,339,675.00 | 25 Detached Houses |
| Flat | £675,265.00 | 4,183 Flats |

