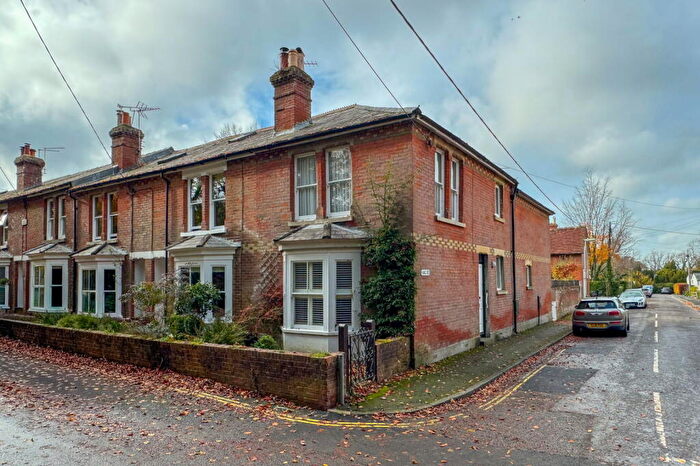
Houses for sale & to rent in Cheriton And Bishops Sutton, Alresford
House Prices in Cheriton And Bishops Sutton
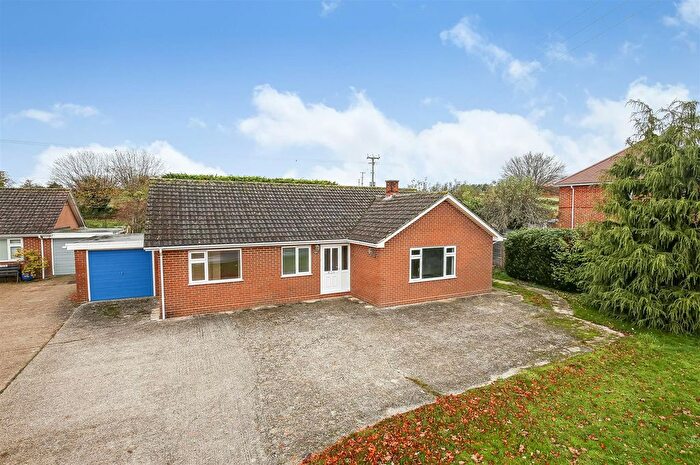
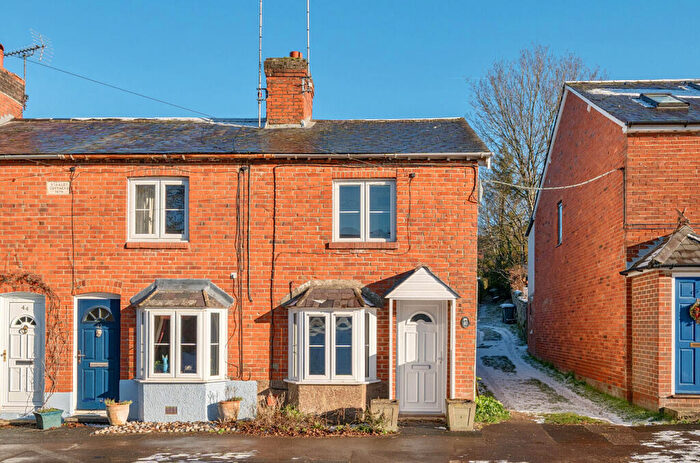
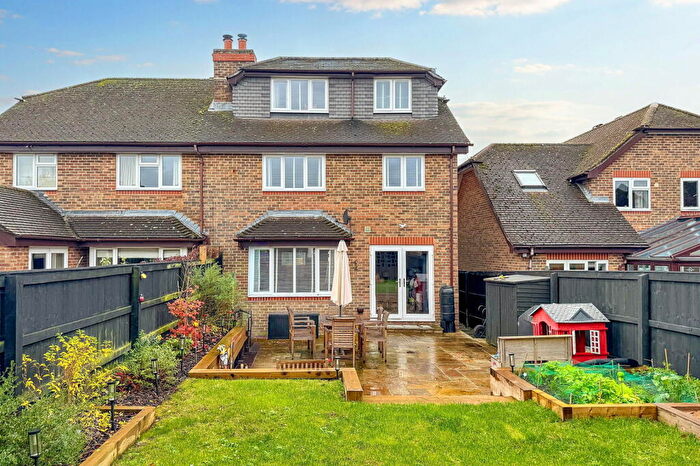
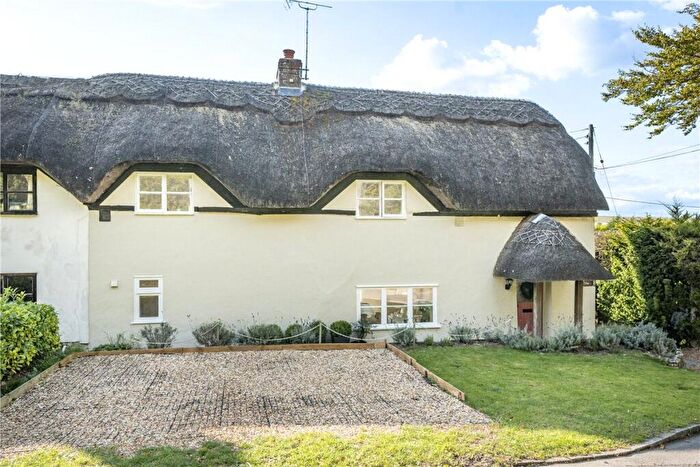
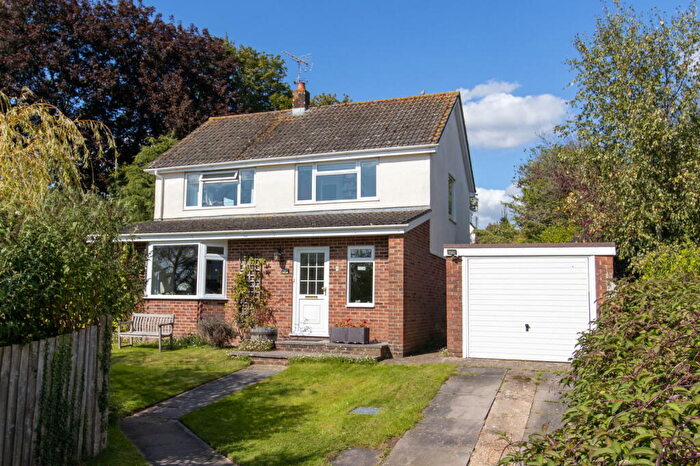
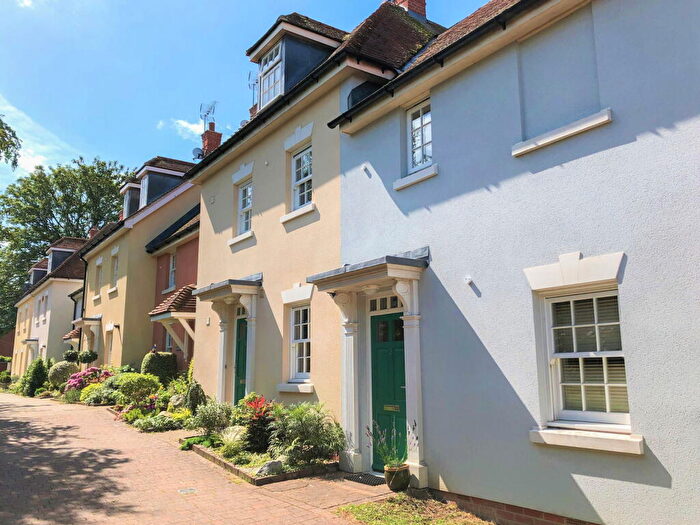
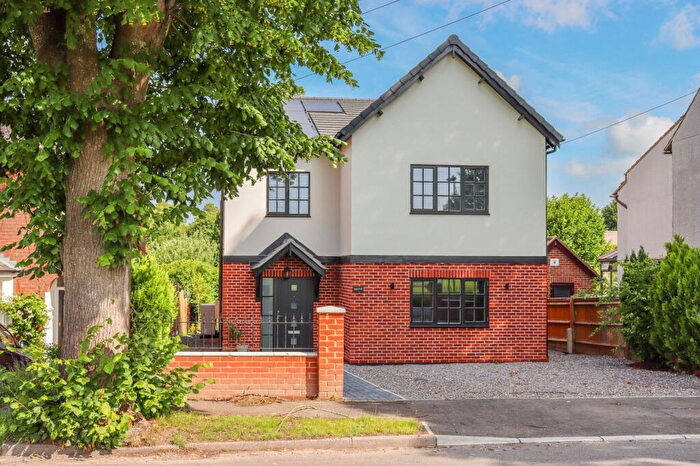
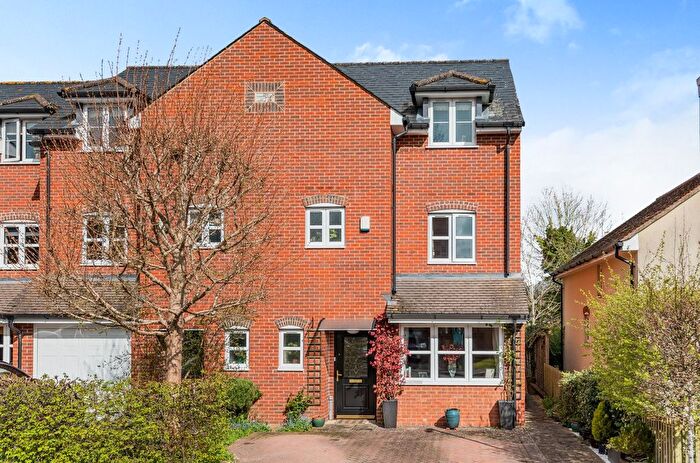
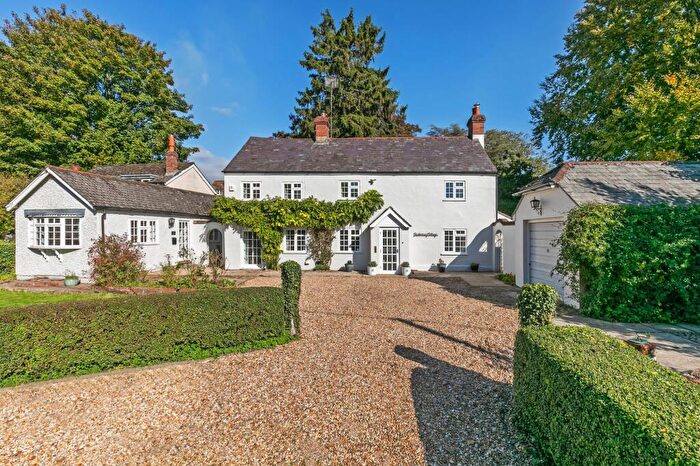
Properties in Cheriton And Bishops Sutton have an average house price of £889,503.00 and had 52 Property Transactions within the last 3 years¹.
Cheriton And Bishops Sutton is an area in Alresford, Hampshire with 698 households², where the most expensive property was sold for £3,100,000.00.
Properties for sale in Cheriton And Bishops Sutton
Roads and Postcodes in Cheriton And Bishops Sutton
Navigate through our locations to find the location of your next house in Cheriton And Bishops Sutton, Alresford for sale or to rent.
| Streets | Postcodes |
|---|---|
| Alresford Road | SO24 0QB |
| Appledown Lane | SO24 9PB |
| Bakeland Gardens | SO24 9QX |
| Bighton Lane | SO24 0AU |
| Bishops Sutton Road | SO24 0AN |
| Brockwood | SO24 0LQ |
| Brockwood Dean Cottages | SO24 0LJ |
| Cheriton Road | SO24 0NQ SO24 0QJ |
| Church Lane | SO24 0AD SO24 0AE SO24 0JS |
| Fox Lane | SO24 0LP |
| Freemans Yard Lane | SO24 0AY |
| Greys Farm Close | SO24 0EU |
| Hill House Lane | SO24 0PT |
| Hobbs Close | SO24 0AS |
| Hockley Cottages | SO24 0NU |
| Hoptons Retreat | SO24 0PG |
| Kilmeston Road | SO24 0NJ SO24 0NW |
| Ladycroft | SO24 0QP SO24 0QR |
| Malthouse Cottages | SO24 0AW |
| Markall Close | SO24 0QF |
| May Cottage | SO24 0PR |
| Mount Villas | SO24 0AB |
| North Street | SO24 0AT |
| Northside Lane | SO24 9SR |
| Old Park Road | SO24 0JG |
| Parkside Lane | SO24 0BB |
| Petersfield Road | SO24 0JT SO24 0JX SO24 0NH |
| Raebarn Close | SO24 0QE |
| Rectory Cottages | SO24 0PZ |
| School Lane | SO24 0AG |
| Ship Hill Cottages | SO24 0AQ |
| The Goodens | SO24 0QH |
| The Pastures | SO24 0PS |
| The Spinney | SO24 0JE |
| Water Lane | SO24 0AR |
| Westfield Road | SO24 0QQ |
| Westwood View | SO24 0NN |
| Wood Lane | SO24 0JN SO24 0JP SO24 0JW |
| Woodcote Cottages | SO24 0LR |
| Woodlands | SO24 0JJ |
| Woodlane Close | SO24 0JR |
| Youngs Way | SO24 0EY |
| SO24 0AA SO24 0AH SO24 0AJ SO24 0AL SO24 0JL SO24 0JQ SO24 0JU SO24 0LL SO24 0LN SO24 0LW SO24 0NA SO24 0ND SO24 0NF SO24 0NL SO24 0NP SO24 0NR SO24 0NS SO24 0NZ SO24 0PA SO24 0PB SO24 0PD SO24 0PN SO24 0PP SO24 0PW SO24 0PX SO24 0PY SO24 0QA SO24 0QD SO24 0QG |
Transport near Cheriton And Bishops Sutton
- FAQ
- Price Paid By Year
- Property Type Price
Frequently asked questions about Cheriton And Bishops Sutton
What is the average price for a property for sale in Cheriton And Bishops Sutton?
The average price for a property for sale in Cheriton And Bishops Sutton is £889,503. This amount is 27% higher than the average price in Alresford. There are 1,151 property listings for sale in Cheriton And Bishops Sutton.
What streets have the most expensive properties for sale in Cheriton And Bishops Sutton?
The streets with the most expensive properties for sale in Cheriton And Bishops Sutton are Fox Lane at an average of £2,075,000, North Street at an average of £923,500 and School Lane at an average of £890,000.
What streets have the most affordable properties for sale in Cheriton And Bishops Sutton?
The streets with the most affordable properties for sale in Cheriton And Bishops Sutton are Hobbs Close at an average of £385,000, Bishops Sutton Road at an average of £660,000 and Markall Close at an average of £729,166.
Which train stations are available in or near Cheriton And Bishops Sutton?
Some of the train stations available in or near Cheriton And Bishops Sutton are Winchester, Shawford and Petersfield.
Property Price Paid in Cheriton And Bishops Sutton by Year
The average sold property price by year was:
| Year | Average Sold Price | Price Change |
Sold Properties
|
|---|---|---|---|
| 2025 | £1,035,750 | 13% |
4 Properties |
| 2024 | £905,341 | -12% |
17 Properties |
| 2023 | £1,014,669 | 26% |
13 Properties |
| 2022 | £751,650 | 2% |
18 Properties |
| 2021 | £738,919 | 6% |
28 Properties |
| 2020 | £696,025 | -9% |
20 Properties |
| 2019 | £761,820 | 32% |
25 Properties |
| 2018 | £517,055 | -6% |
18 Properties |
| 2017 | £546,583 | -9% |
18 Properties |
| 2016 | £596,755 | 3% |
18 Properties |
| 2015 | £578,535 | 5% |
28 Properties |
| 2014 | £548,127 | -15% |
51 Properties |
| 2013 | £632,533 | 31% |
30 Properties |
| 2012 | £436,068 | -25% |
19 Properties |
| 2011 | £546,625 | 13% |
16 Properties |
| 2010 | £477,777 | 12% |
18 Properties |
| 2009 | £421,178 | -99% |
14 Properties |
| 2008 | £838,535 | 45% |
14 Properties |
| 2007 | £463,483 | -2% |
31 Properties |
| 2006 | £473,858 | -6% |
24 Properties |
| 2005 | £502,102 | -1% |
27 Properties |
| 2004 | £507,365 | 22% |
29 Properties |
| 2003 | £393,891 | 11% |
23 Properties |
| 2002 | £351,837 | 10% |
23 Properties |
| 2001 | £318,341 | 1% |
35 Properties |
| 2000 | £315,280 | 9% |
23 Properties |
| 1999 | £287,040 | 17% |
29 Properties |
| 1998 | £237,357 | 29% |
28 Properties |
| 1997 | £169,193 | -11% |
31 Properties |
| 1996 | £187,426 | 14% |
37 Properties |
| 1995 | £161,398 | - |
25 Properties |
Property Price per Property Type in Cheriton And Bishops Sutton
Here you can find historic sold price data in order to help with your property search.
The average Property Paid Price for specific property types in the last three years are:
| Property Type | Average Sold Price | Sold Properties |
|---|---|---|
| Semi Detached House | £591,877.00 | 9 Semi Detached Houses |
| Detached House | £1,087,160.00 | 33 Detached Houses |
| Terraced House | £505,100.00 | 10 Terraced Houses |

