
Houses for sale in Hampshire, England
House Prices in Hampshire
Properties in Hampshire have
an average house price of
£419k
and had 60,186 Property Transactions
within the last 3 years.¹
Hampshire is a location in
England with
592,420 households², where the most expensive property was sold for £15.88M.
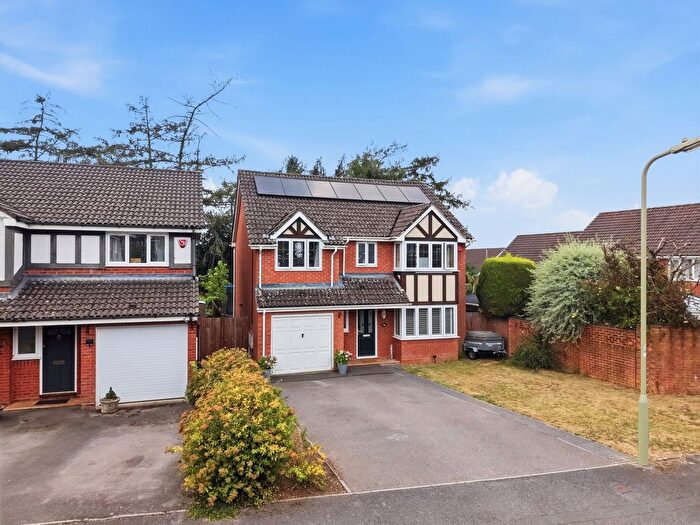
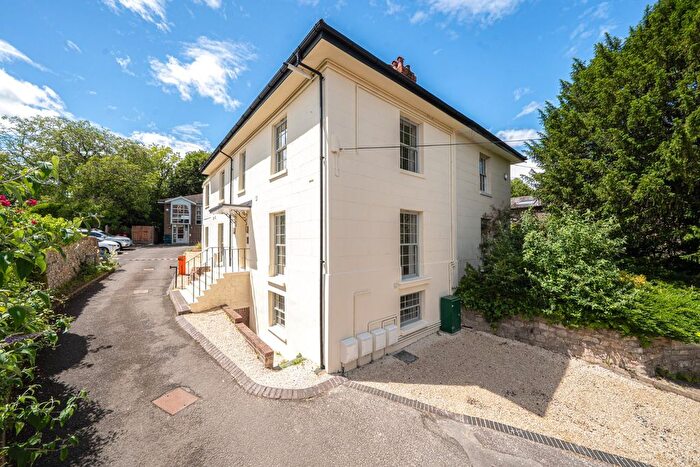
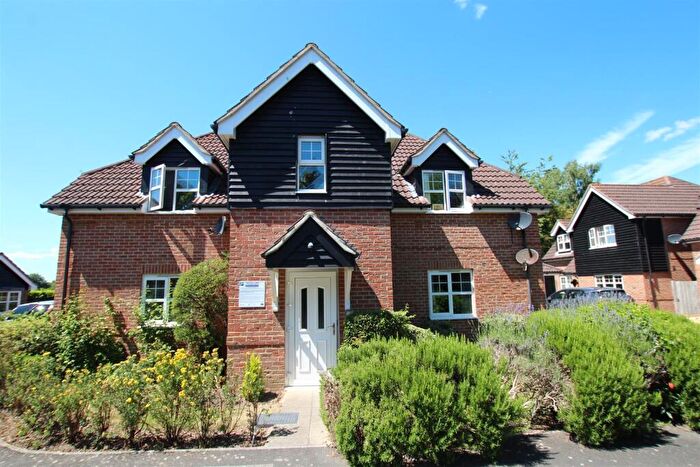
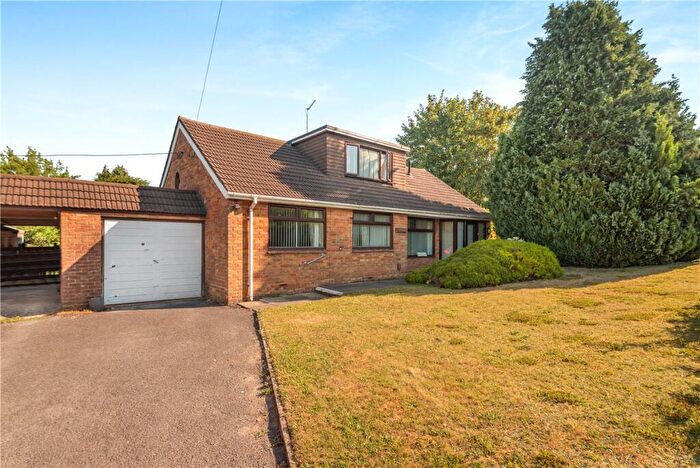
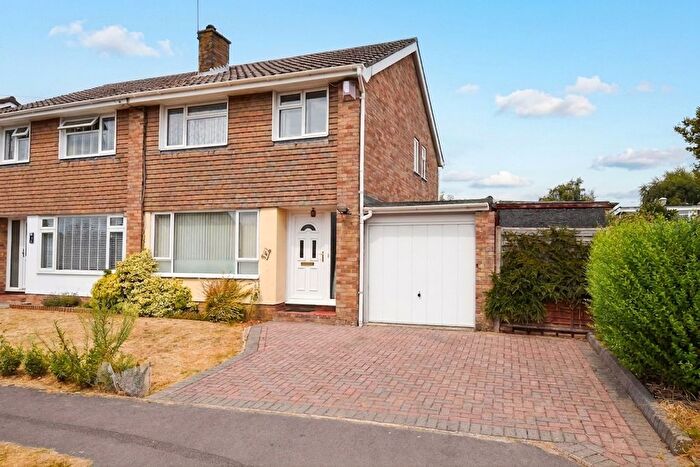
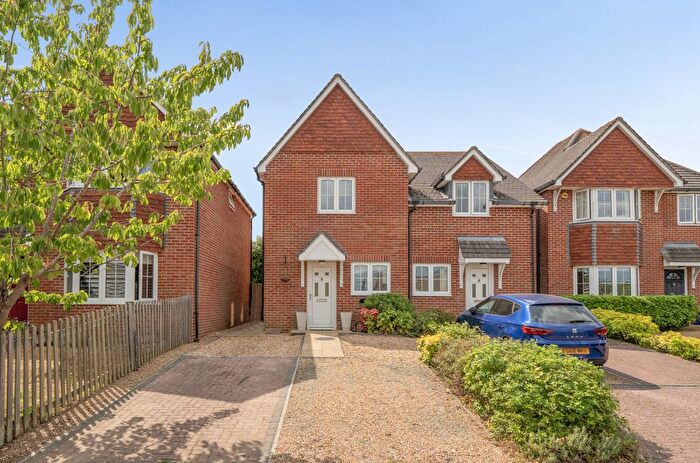
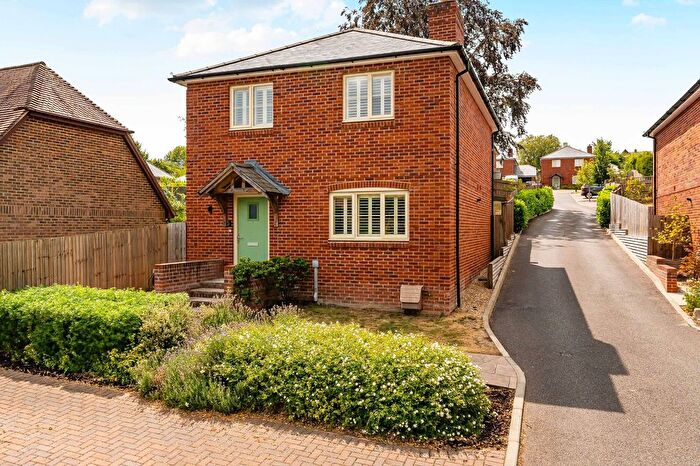
Properties for sale in Hampshire
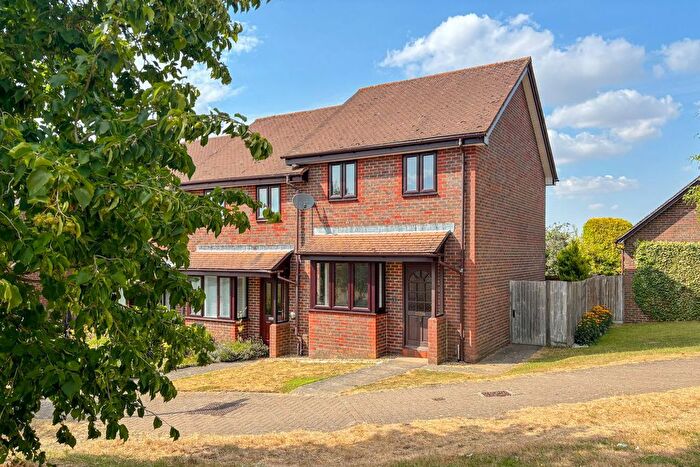
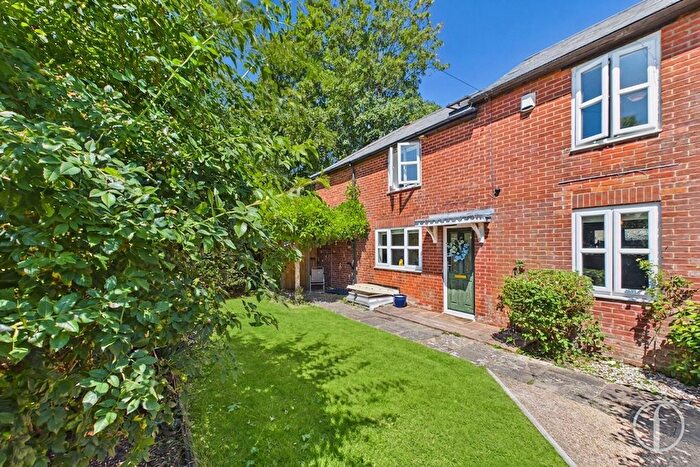
![]()
If you are looking to sell your house, let it out, or receive a property valuation, an expert can help you.
Click the button below to get started.
Towns in Hampshire
Navigate through our locations to find the location of your next house in Hampshire, England for sale or to rent.
- Farnborough
- Fareham
- Lyndhurst
- Whitchurch
- Southsea
- Southampton
- Stockbridge
- Portsmouth
- Hayling Island
- Liphook
- Waterlooville
- Fleet
- Hindhead
- New Milton
- Salisbury
- Aldershot
- Tadley
- Alresford
- Farnham
- Yateley
- Haslemere
- Liss
- Romsey
- Reading
- Tidworth
- Alton
- Thatcham
- Lymington
- Newbury
- Camberley
- Verwood
- Rowlands Castle
- Petersfield
- Brockenhurst
- Eastleigh
- Ringwood
- Emsworth
- Christchurch
- Hook
- Basingstoke
- Fordingbridge
- Havant
- Gosport
- Lee-on-the-solent
- Andover
- Winchester
- Bordon
Property price trends in Hampshire
According to the latest Land Registry data, the average home in Hampshire sold for £404,028 in 2026. That figure comes from a substantial record of 788,487 sales logged over the past 31 years.
Prices have softened over the last three years. Compared with 2023, when the typical sale came in around £422,145, that's a fall of roughly 4.3%.
Looking back five years, average prices are down about 0.7% since 2021, a drop of around £2,777 in cash terms.
Zoom out to the past decade for the fuller picture. Back in 2016, homes here averaged £330,024, so the typical sold price has climbed about 22.4% since then, roughly 2% a year. Stretch the view to fifteen years and that annual pace edges up closer to 2.8%.
Frequently asked questions about Hampshire
What is the average price for a property for sale in Hampshire?
The average price for a property for sale in Hampshire is £419,283. This amount is 17% higher than the average price in England. There are more than 10,000 property listings for sale in Hampshire.
What locations have the most expensive properties for sale in Hampshire?
The locations with the most expensive properties for sale in Hampshire are Brockenhurst at an average of £980,022, Salisbury at an average of £947,142 and Haslemere at an average of £876,666.
What locations have the most affordable properties for sale in Hampshire?
The locations with the most affordable properties for sale in Hampshire are Gosport at an average of £247,545, Havant at an average of £301,479 and Tidworth at an average of £313,030.
Which train stations are available in or near Hampshire?
Some of the train stations available in or near Hampshire are Shawford, Winchester and Eastleigh.
Property Price Paid in Hampshire by Year
The average sold property price by year was:
| Year | Average Sold Price | Price Change |
Sold Properties
|
|---|---|---|---|
| 2026 | £404,028 | -4% |
3,899 Properties |
| 2025 | £419,804 | 0,1% |
19,901 Properties |
| 2024 | £419,285 | -1% |
19,236 Properties |
| 2023 | £422,145 | -3% |
17,150 Properties |
| 2022 | £434,167 | 6% |
22,005 Properties |
| 2021 | £406,805 | 4% |
29,774 Properties |
| 2020 | £388,616 | 8% |
20,812 Properties |
| 2019 | £359,228 | 1% |
24,034 Properties |
| 2018 | £356,592 | 1% |
24,399 Properties |
| 2017 | £353,053 | 7% |
25,049 Properties |
Property Price per Property Type in Hampshire
Here you can find historic sold price data in order to help with your property search.
The average Property Paid Price for specific property types in the last three years are:
| Property Type | Average Sold Price | Sold Properties |
|---|---|---|
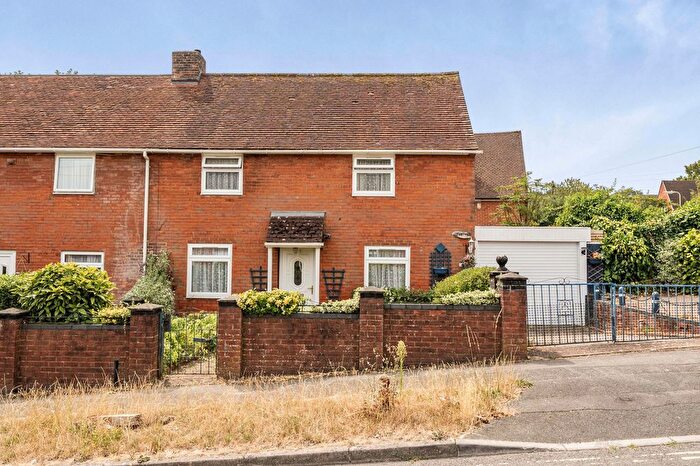
| Semi Detached House | £390,121.00 | 14,859 Semi Detached Houses |
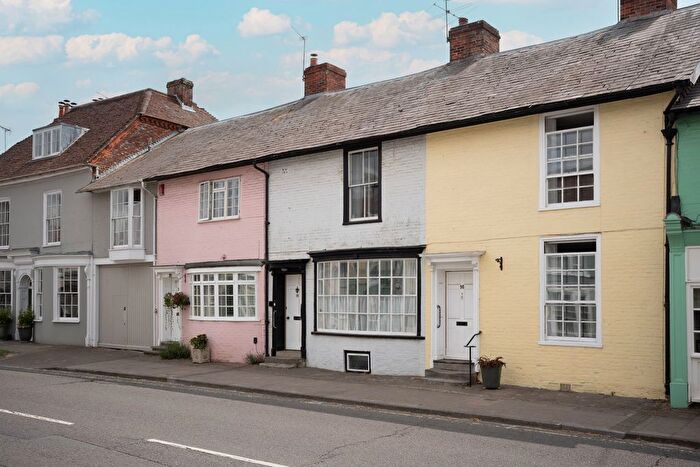
| Terraced House | £322,981.00 | 16,149 Terraced Houses |
| Detached House | £650,459.00 | 18,512 Detached Houses |
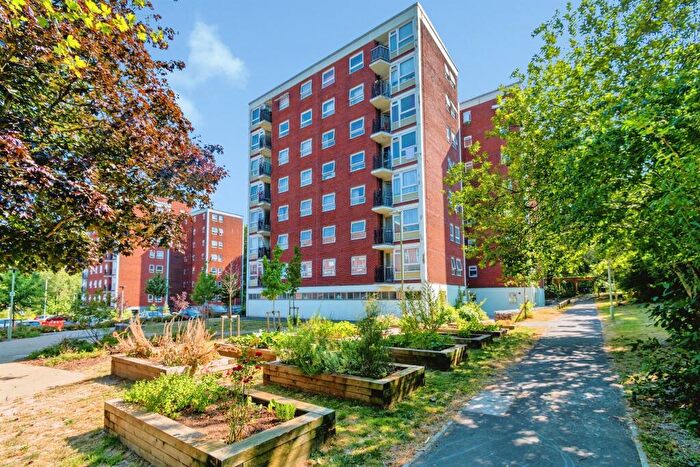
| Flat | £204,487.00 | 10,666 Flats |
Transport in Hampshire
Please see below transportation links in this area:
