
Houses for sale in Brighton Hill, Basingstoke
House Prices in Brighton Hill
Properties in Brighton Hill have an average house price of £209k and had 2 Property Transactions within the last 3 years¹.
Brighton Hill is an area in Basingstoke, Hampshire with 261 households², where the most expensive property was sold for £257k.
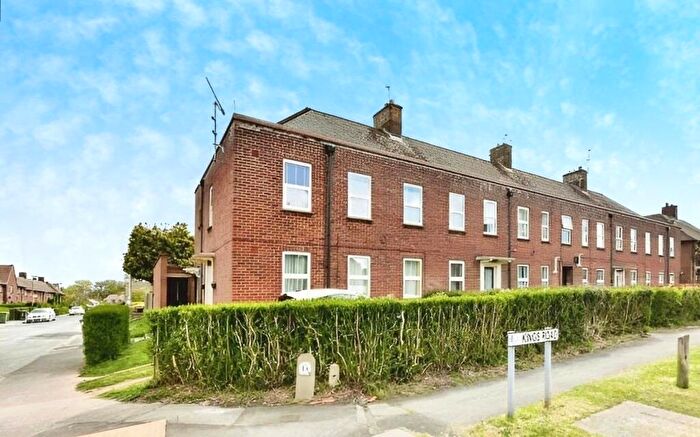
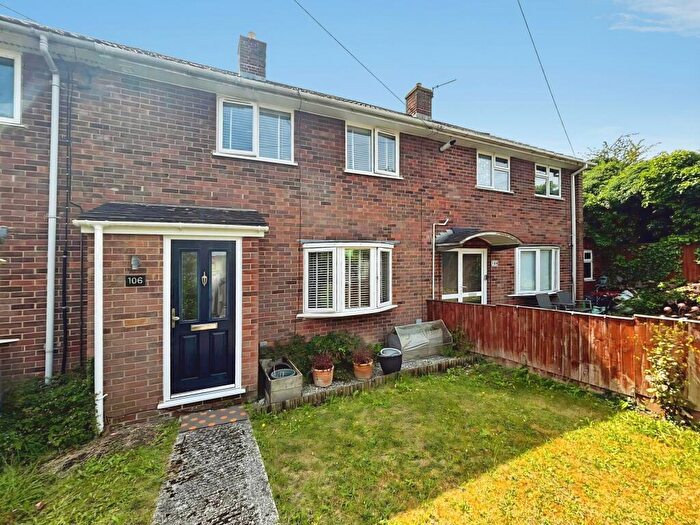
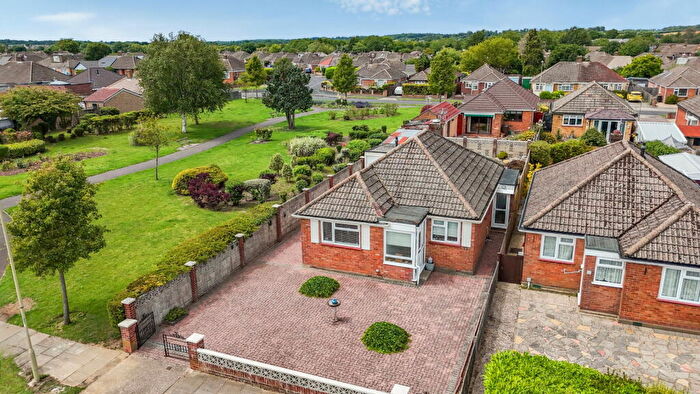
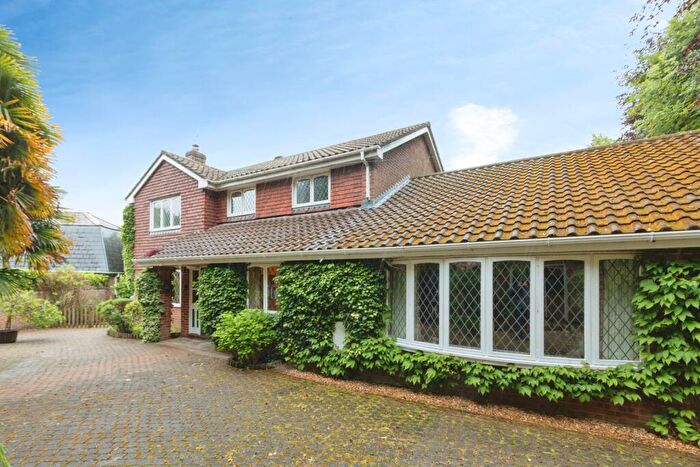
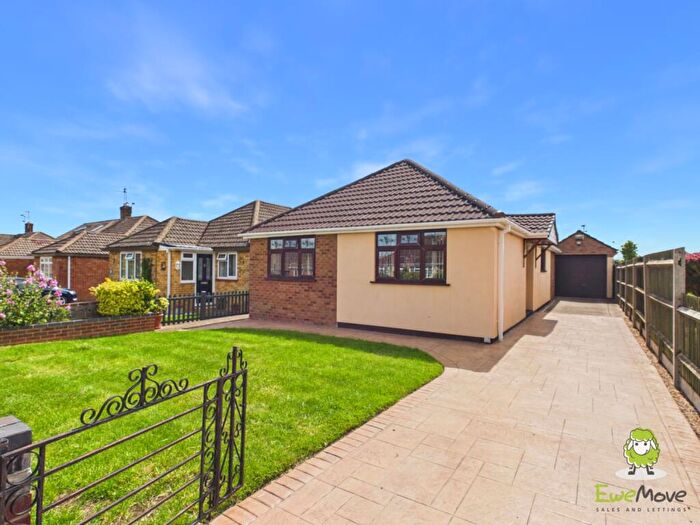
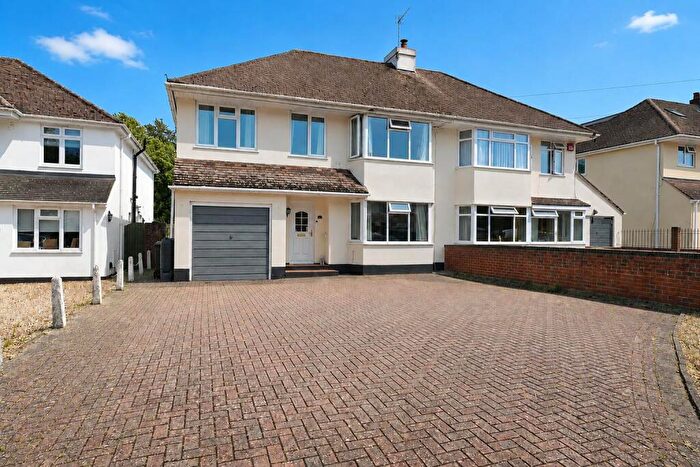
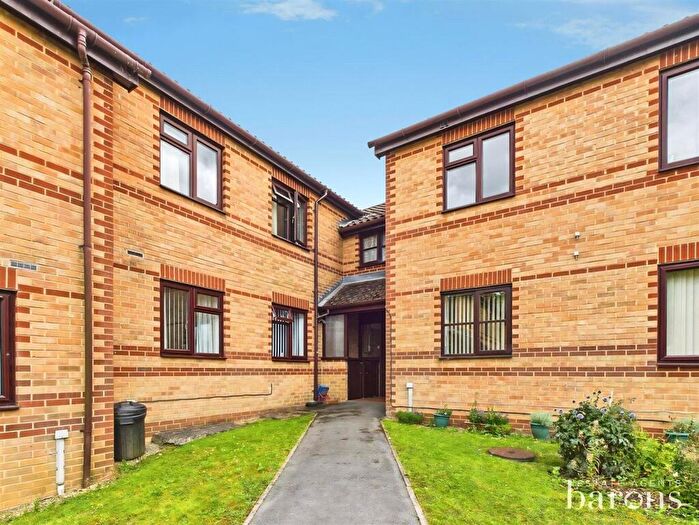
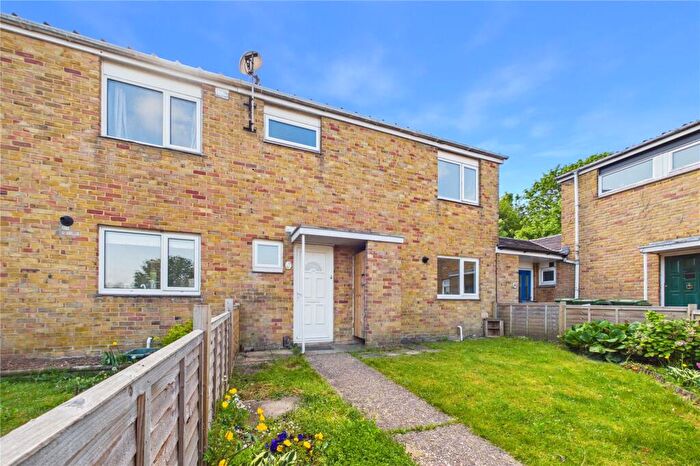
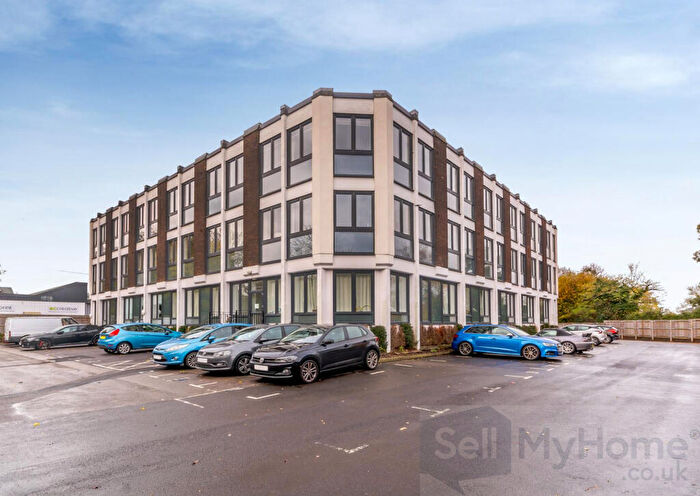
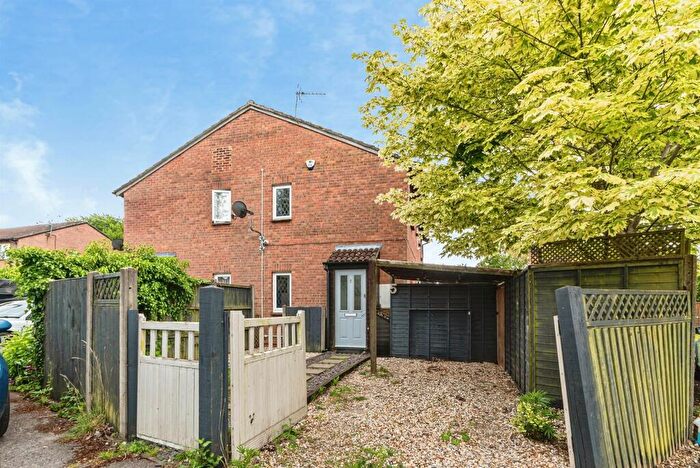
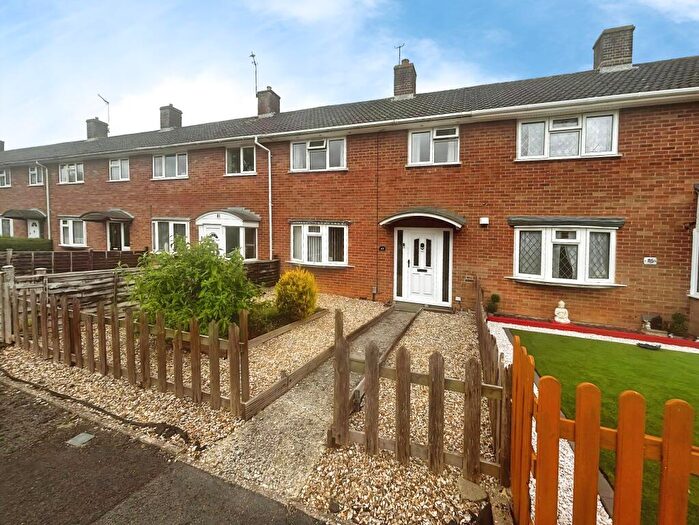
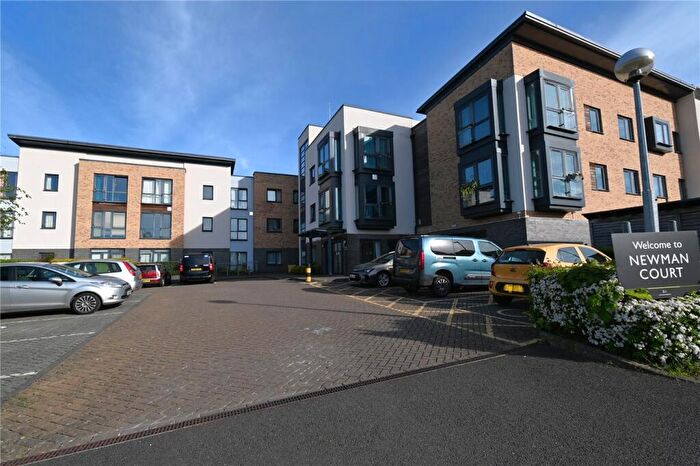
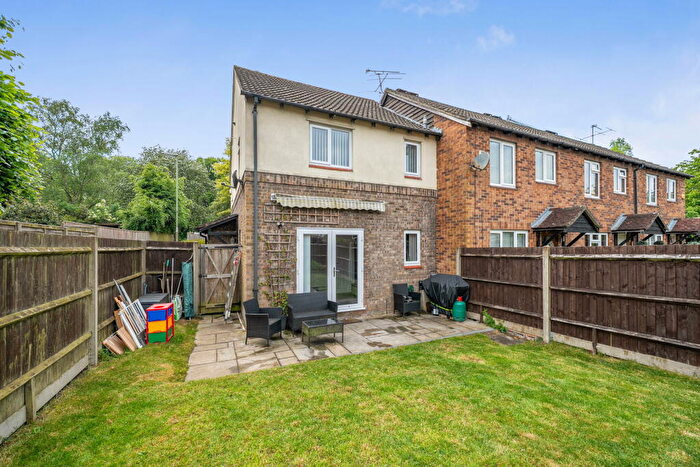
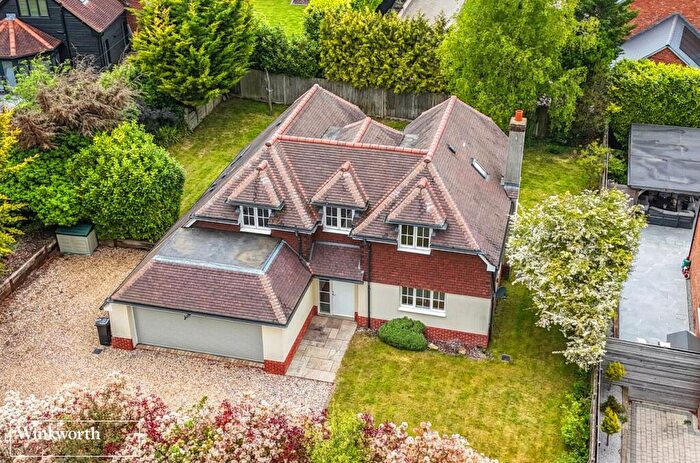
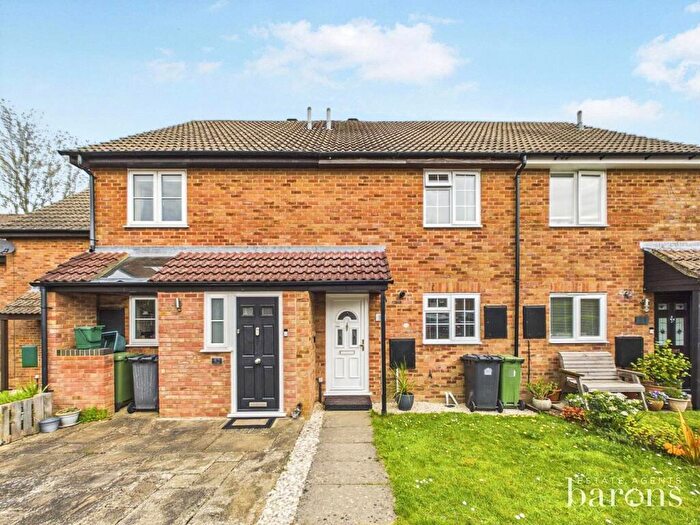
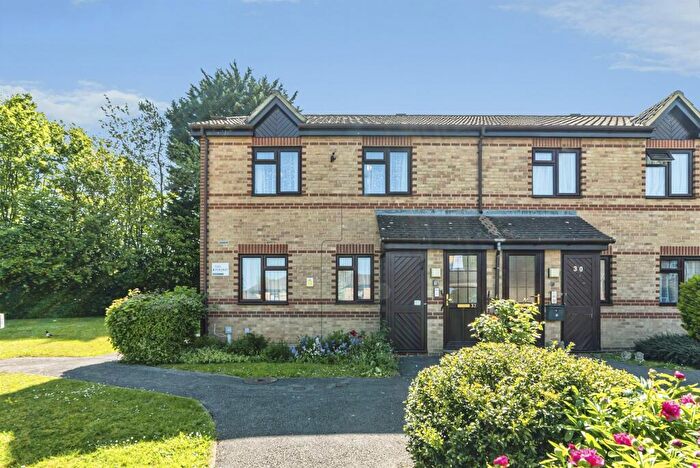
Properties for sale in Brighton Hill
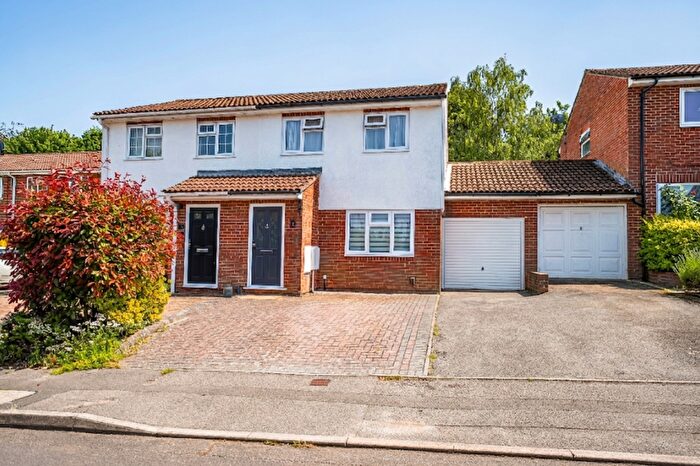
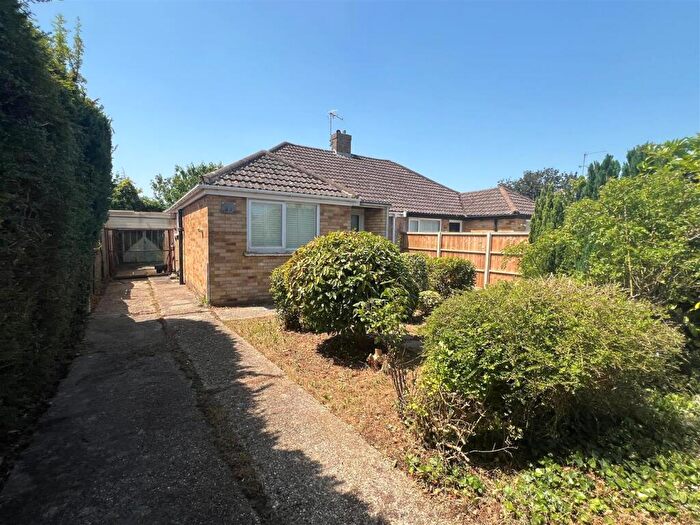
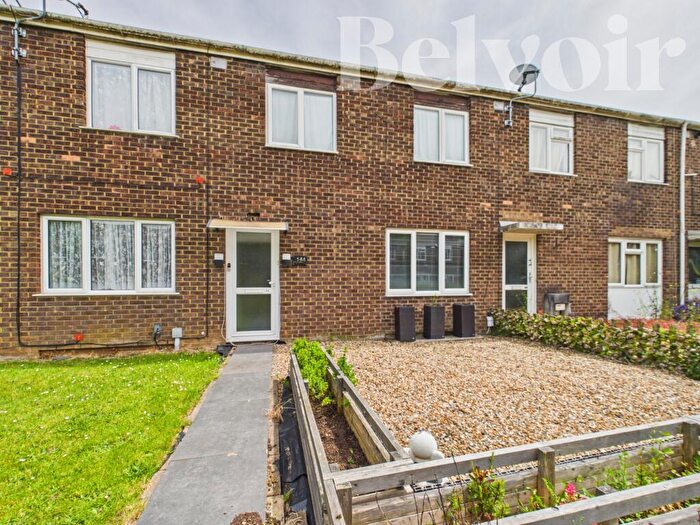
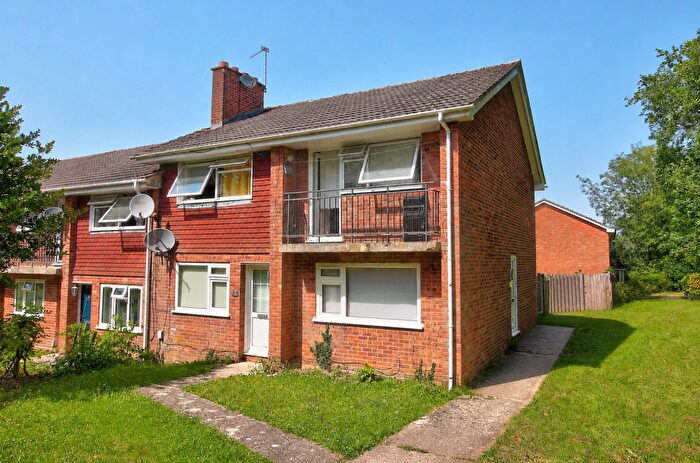
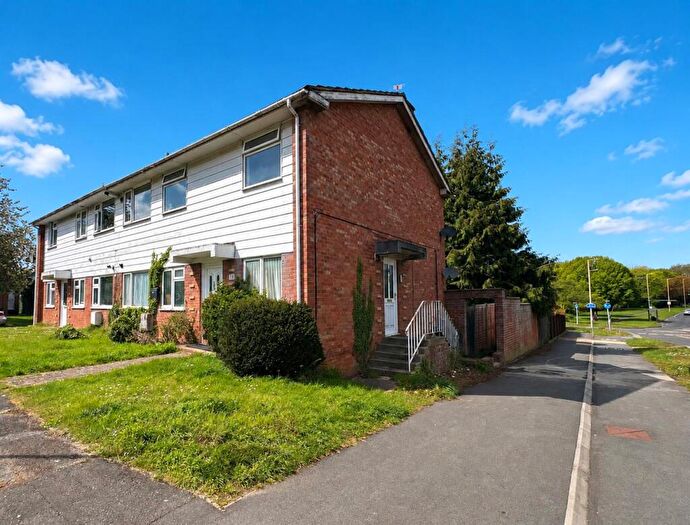
![]()
If you are looking to sell your house, let it out, or receive a property valuation, an expert can help you.
Click the button below to get started.
Roads and Postcodes in Brighton Hill
Navigate through our locations to find the location of your next house in Brighton Hill, Basingstoke for sale or to rent.
| Streets | Postcodes |
|---|---|
| Brighton Hill Parade | RG22 4LR RG22 4EH |
| Brighton Way | RG22 4DH RG22 4HS |
| Byrd Gardens | RG22 4PS |
| Dankworth Road | RG22 4LH RG22 4LJ RG22 4LL |
| Headington Close | RG22 4LN |
| Jays Close | RG22 4AX RG22 4FZ RG22 4PF |
| Malmesbury Field | RG22 4LQ |
| Mitchell Gardens | RG22 4JU |
| Musgrave Close | RG22 4LW |
| Sullivan Road | RG22 4ER |
| The Harrow Way | RG22 4BE |
| Viables Industrial Estate | RG22 4LT RG22 4PD RG22 4SB |
| Viables Industrial Estate Jays Close | RG22 4BA |
Property price trends in Brighton Hill
According to the latest Land Registry data, the average home in Brighton Hill sold for £160,000 in 2024. That figure comes from 9 sales logged over the past 23 years.
Prices have fallen back over the last three years. Compared with 2021, when the typical sale came in around £205,000, that's a fall of roughly 22%.
Looking back five years, average prices are down about 24.7% since 2019, a drop of around £52,500 in cash terms.
Frequently asked questions about Brighton Hill
What is the average price for a property for sale in Brighton Hill?
The average price for a property for sale in Brighton Hill is £208,500. This amount is 43% lower than the average price in Basingstoke. There are 806 property listings for sale in Brighton Hill.
Which train stations are available in or near Brighton Hill?
Some of the train stations available in or near Brighton Hill are Basingstoke, Bramley (Hampshire) and Overton.
Property Price Paid in Brighton Hill by Year
The average sold property price by year was:
| Year | Average Sold Price | Price Change |
Sold Properties
|
|---|---|---|---|
| 2024 | £160,000 | -61% |
1 Property |
| 2023 | £257,000 | 12% |
1 Property |
| 2022 | £226,250 | 9% |
2 Properties |
| 2021 | £205,000 | -3% |
1 Property |
| 2020 | £212,000 | -0,2% |
1 Property |
| 2019 | £212,500 | -145% |
1 Property |
| 2018 | £520,000 | 60% |
1 Property |
| 2001 | £210,000 | - |
1 Property |
Property Price per Property Type in Brighton Hill
Here you can find historic sold price data in order to help with your property search.
The average Property Paid Price for specific property types in the last three years are:
| Property Type | Average Sold Price | Sold Properties |
|---|---|---|
| Terraced House | £208,500.00 | 2 Terraced Houses |
