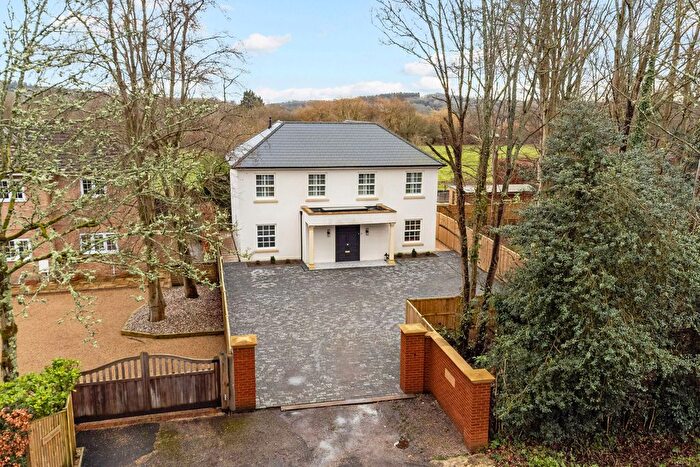
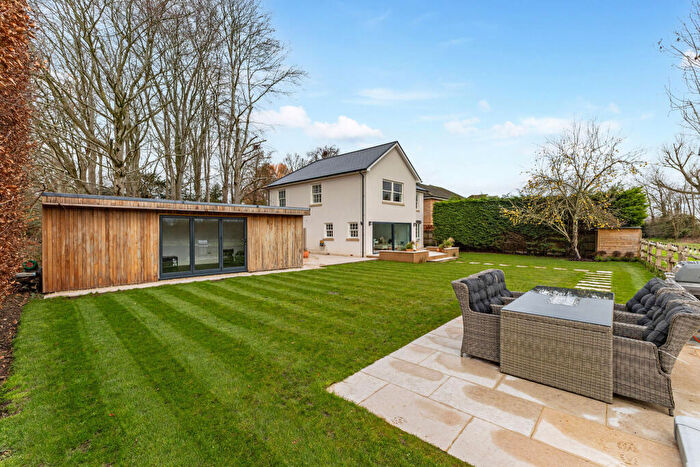
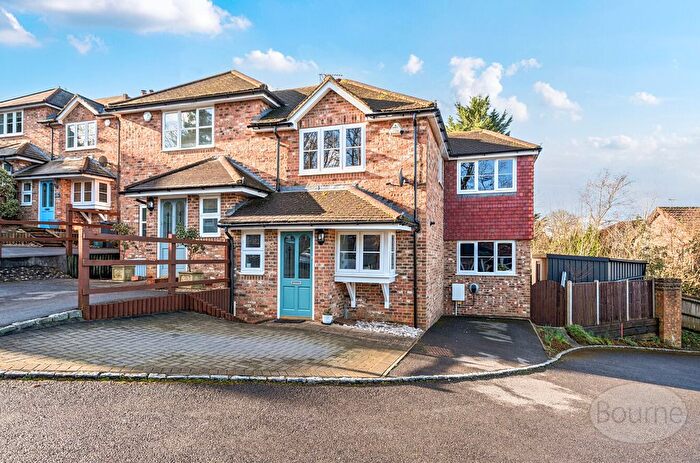
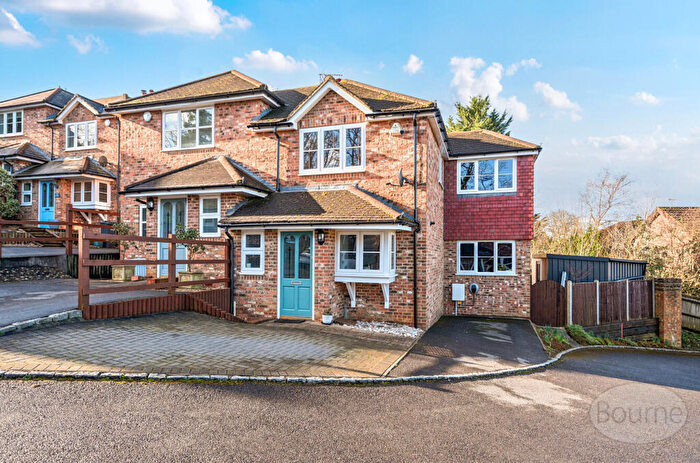
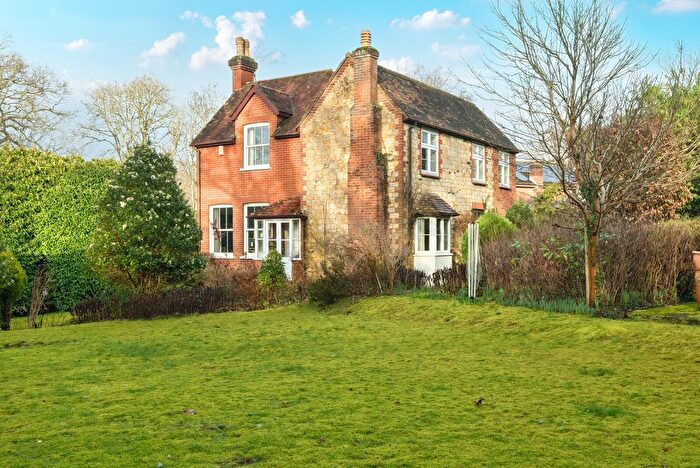
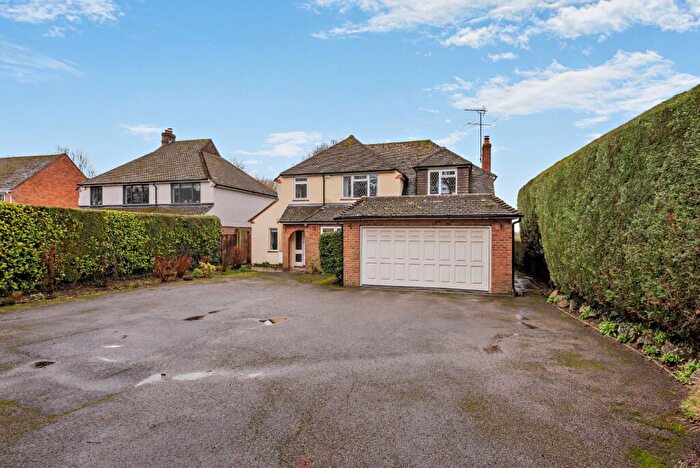
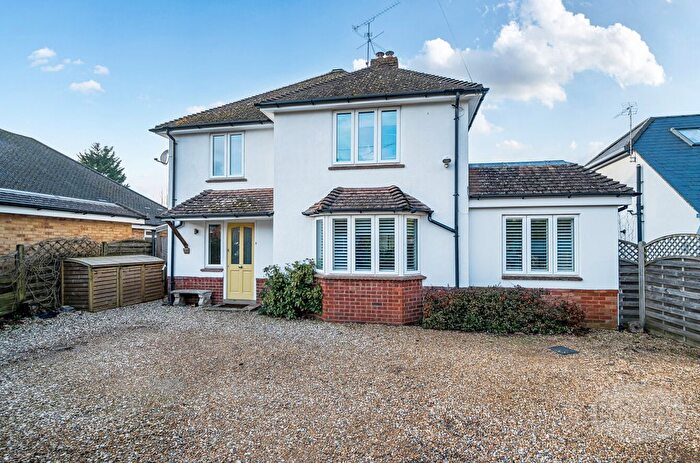
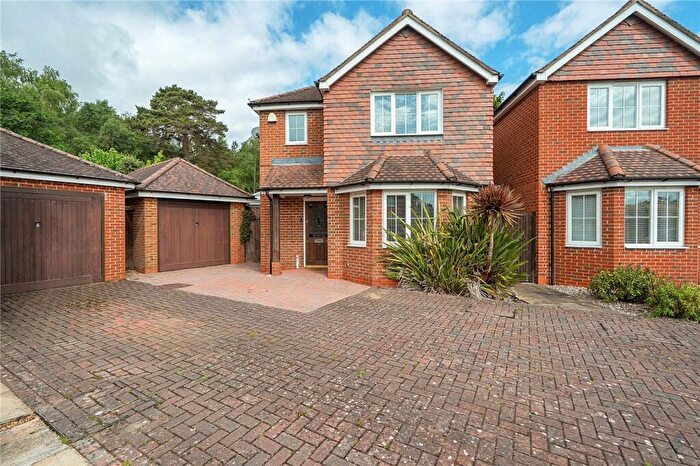
Houses for sale & to rent in Binsted And Bentley, Farnham
House Prices in Binsted And Bentley
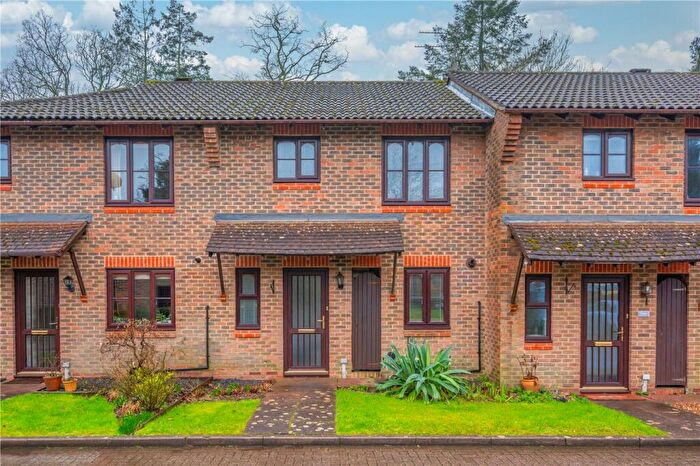
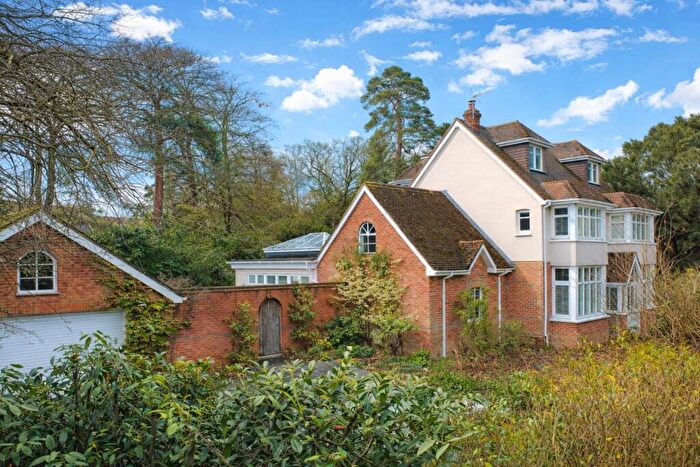
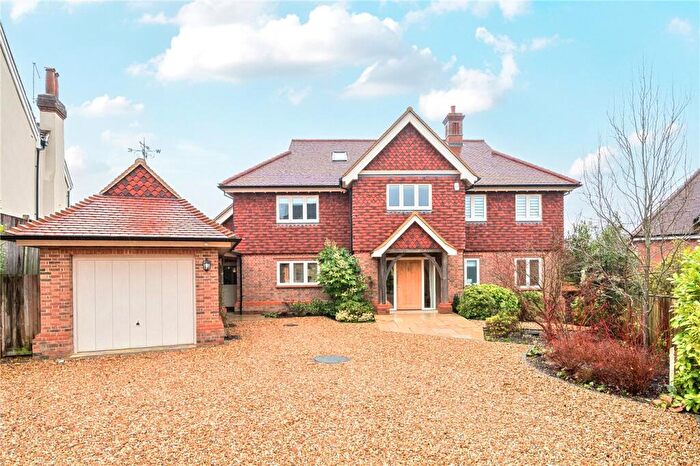
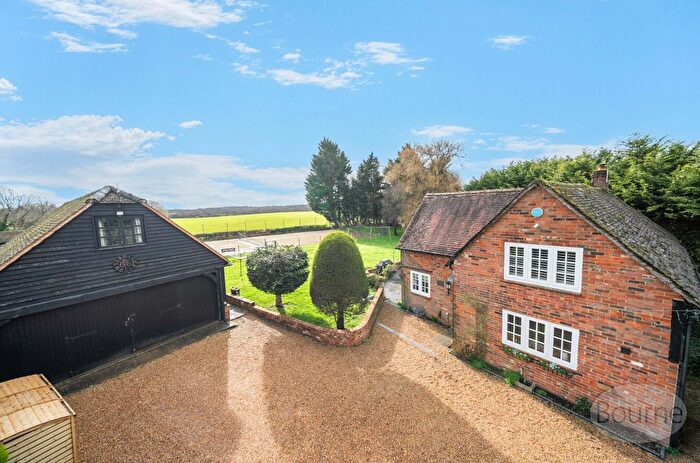
Properties in Binsted And Bentley have an average house price of £695,132.00 and had 69 Property Transactions within the last 3 years¹.
Binsted And Bentley is an area in Farnham, Hampshire with 672 households², where the most expensive property was sold for £1,780,000.00.
Properties for sale in Binsted And Bentley
Roads and Postcodes in Binsted And Bentley
Navigate through our locations to find the location of your next house in Binsted And Bentley, Farnham for sale or to rent.
| Streets | Postcodes |
|---|---|
| Babsfield | GU10 5LS |
| Back Lane | GU10 4LN GU10 4LW |
| Binsted Road | GU10 4LL |
| Bonners Field | GU10 5LH |
| Broadlands Close | GU10 5LE |
| Church Lane | GU10 4EN |
| Crocks Farm Cottages | GU10 5NH |
| East Green Cottages | GU10 5JQ |
| Eggars Field | GU10 5LD |
| Farnham Road | GU10 4JZ GU10 4LA GU10 4LD GU10 4LE |
| Forest Glade | GU10 4DG |
| Fullers Road | GU10 4DE GU10 4DF GU10 4LB |
| Glendevon Villas | GU10 4EL |
| Gravel Hill Road | GU10 4LG GU10 5JD |
| Hole Lane | GU10 5HE GU10 5LP GU10 5LT |
| Holt Pound Lane | GU10 4JY |
| Main Road | GU10 4LR GU10 4LT |
| Northbrook Estate Road | GU10 5EU |
| Oakway | GU10 5LR |
| Old Station Road | GU10 5JT |
| Poplar Cottages | GU10 5LN |
| Rectory Lane | GU10 5JR GU10 5JS |
| Red Oaks | GU10 4DR |
| School Lane | GU10 5JP GU10 5JW |
| School Road | GU10 4BW |
| Somerset Cottages | GU10 5ND |
| Southview Cottages | GU10 5NB |
| Station Road | GU10 5JY GU10 5JZ GU10 5LA |
| The Drift | GU10 5JX |
| The Glade | GU10 4LU |
| Weybank | GU10 5LB |
| GU10 4EY GU10 4HA GU10 5HU GU10 5HY GU10 5HZ GU10 5JA GU10 5JH GU10 5JL GU10 5JN GU10 5LW GU10 5LZ GU10 5NA GU10 5NE GU10 5NF GU10 5NQ |
Transport near Binsted And Bentley
-
Bentley Station
-
Farnham Station
-
Alton Station
-
Aldershot Station
-
Winchfield Station
-
Fleet Station
-
Ash Station
-
Hook Station
-
Liphook Station
-
North Camp Station
- FAQ
- Price Paid By Year
- Property Type Price
Frequently asked questions about Binsted And Bentley
What is the average price for a property for sale in Binsted And Bentley?
The average price for a property for sale in Binsted And Bentley is £695,132. This amount is 14% lower than the average price in Farnham. There are 614 property listings for sale in Binsted And Bentley.
What streets have the most expensive properties for sale in Binsted And Bentley?
The streets with the most expensive properties for sale in Binsted And Bentley are The Drift at an average of £1,350,000, Binsted Road at an average of £1,270,000 and Station Road at an average of £816,250.
What streets have the most affordable properties for sale in Binsted And Bentley?
The streets with the most affordable properties for sale in Binsted And Bentley are Southview Cottages at an average of £367,500, Babsfield at an average of £407,500 and Broadlands Close at an average of £422,916.
Which train stations are available in or near Binsted And Bentley?
Some of the train stations available in or near Binsted And Bentley are Bentley, Farnham and Alton.
Property Price Paid in Binsted And Bentley by Year
The average sold property price by year was:
| Year | Average Sold Price | Price Change |
Sold Properties
|
|---|---|---|---|
| 2025 | £717,681 | 4% |
22 Properties |
| 2024 | £687,857 | 1% |
28 Properties |
| 2023 | £679,744 | -27% |
19 Properties |
| 2022 | £862,100 | 14% |
20 Properties |
| 2021 | £739,552 | 24% |
48 Properties |
| 2020 | £558,928 | -20% |
28 Properties |
| 2019 | £668,450 | 5% |
38 Properties |
| 2018 | £633,950 | 7% |
30 Properties |
| 2017 | £591,181 | 1% |
32 Properties |
| 2016 | £582,889 | 1% |
19 Properties |
| 2015 | £579,482 | 1% |
32 Properties |
| 2014 | £571,461 | 28% |
22 Properties |
| 2013 | £413,529 | -24% |
34 Properties |
| 2012 | £511,954 | 21% |
23 Properties |
| 2011 | £404,998 | -41% |
19 Properties |
| 2010 | £571,469 | 31% |
18 Properties |
| 2009 | £395,900 | -18% |
25 Properties |
| 2008 | £467,805 | 2% |
18 Properties |
| 2007 | £458,477 | -1% |
43 Properties |
| 2006 | £463,525 | 17% |
30 Properties |
| 2005 | £385,890 | 3% |
27 Properties |
| 2004 | £376,000 | 11% |
28 Properties |
| 2003 | £335,125 | 12% |
36 Properties |
| 2002 | £294,232 | -2% |
40 Properties |
| 2001 | £300,945 | 26% |
36 Properties |
| 2000 | £222,499 | -0,3% |
26 Properties |
| 1999 | £223,109 | 12% |
56 Properties |
| 1998 | £196,095 | 17% |
23 Properties |
| 1997 | £161,793 | 16% |
23 Properties |
| 1996 | £136,302 | -25% |
31 Properties |
| 1995 | £169,739 | - |
25 Properties |
Property Price per Property Type in Binsted And Bentley
Here you can find historic sold price data in order to help with your property search.
The average Property Paid Price for specific property types in the last three years are:
| Property Type | Average Sold Price | Sold Properties |
|---|---|---|
| Semi Detached House | £447,000.00 | 12 Semi Detached Houses |
| Detached House | £891,150.00 | 41 Detached Houses |
| Terraced House | £414,958.00 | 12 Terraced Houses |
| Flat | £270,875.00 | 4 Flats |

