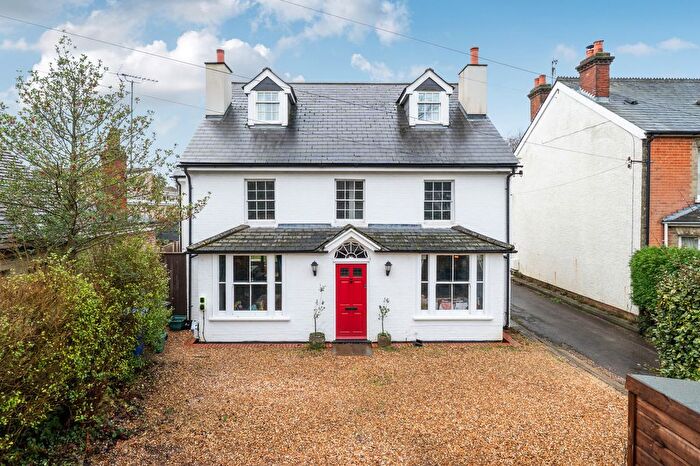
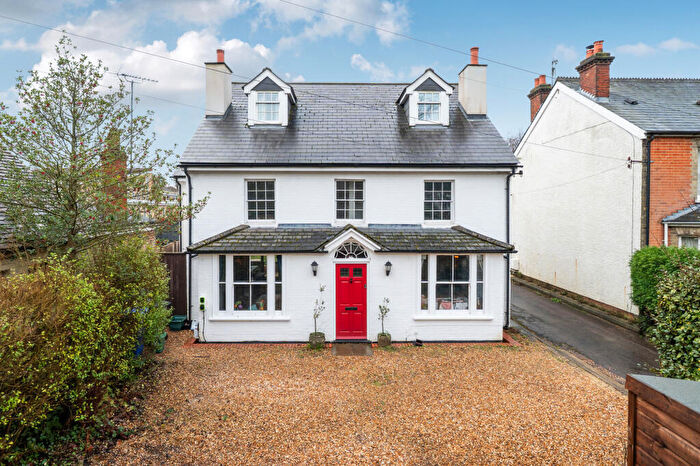
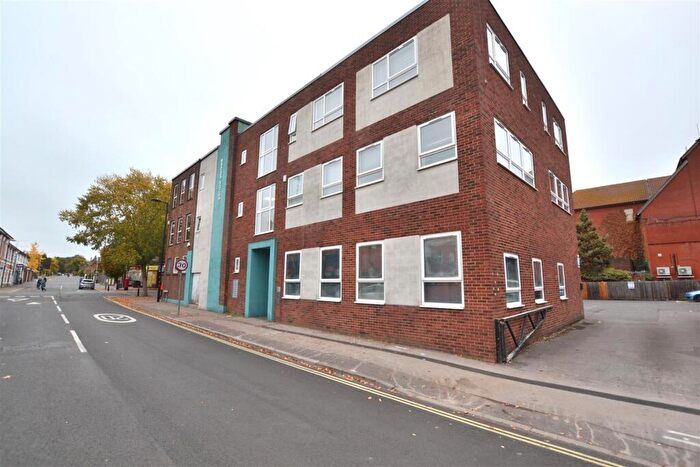
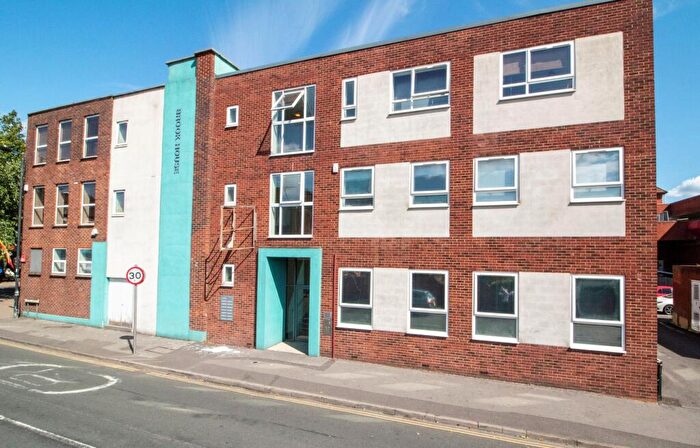
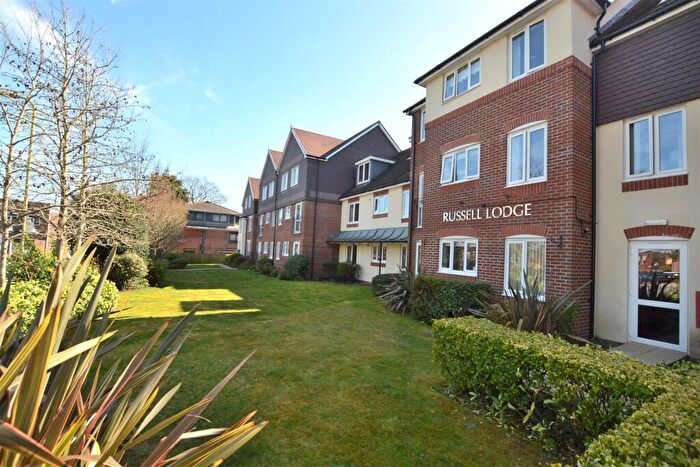
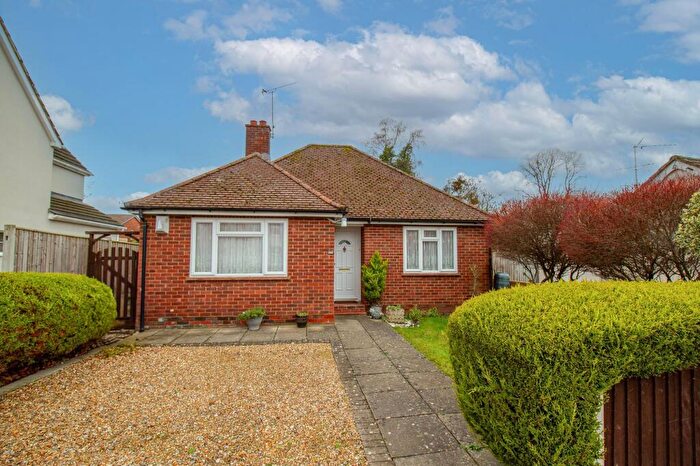
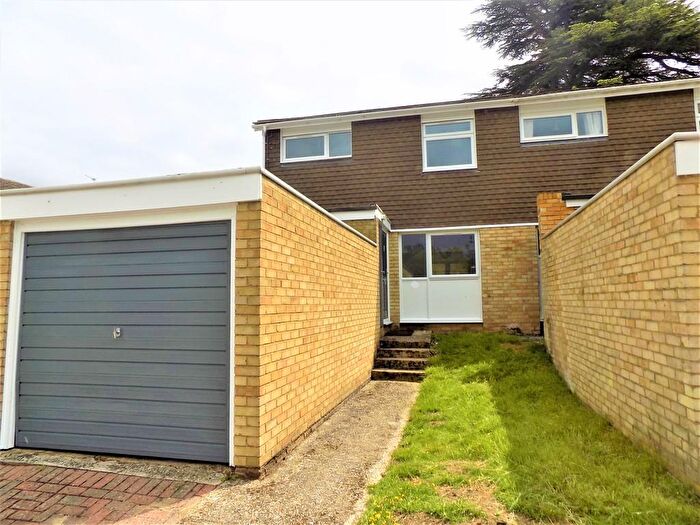
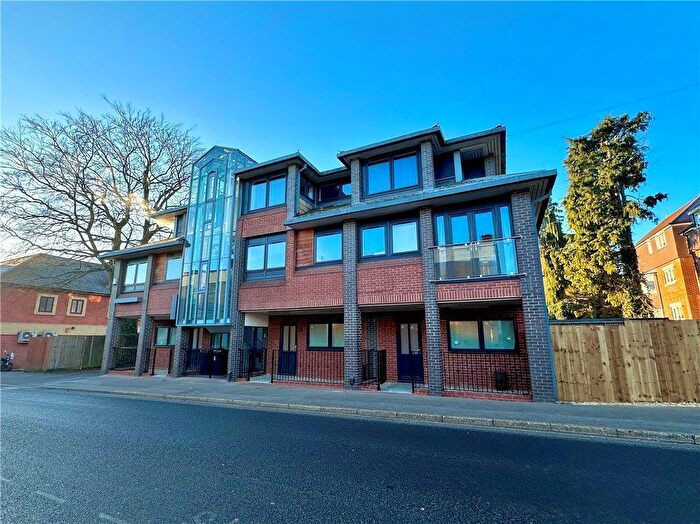
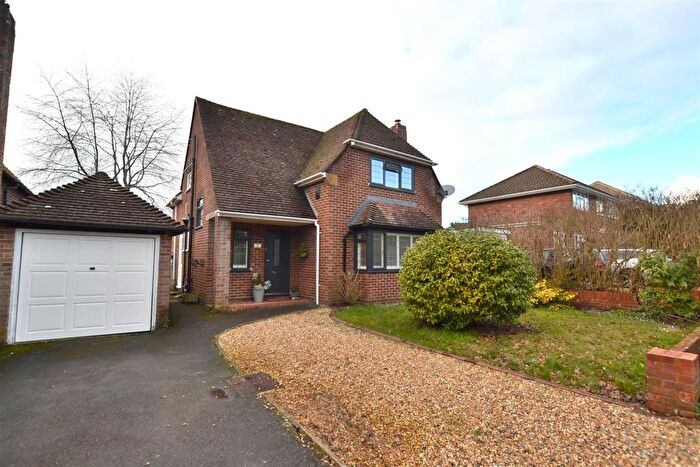
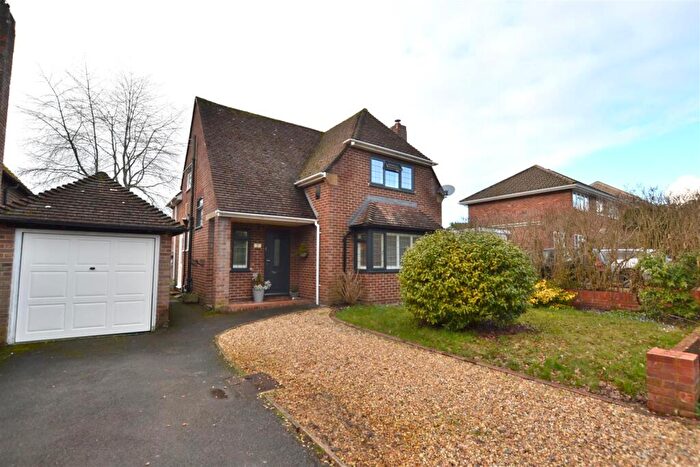
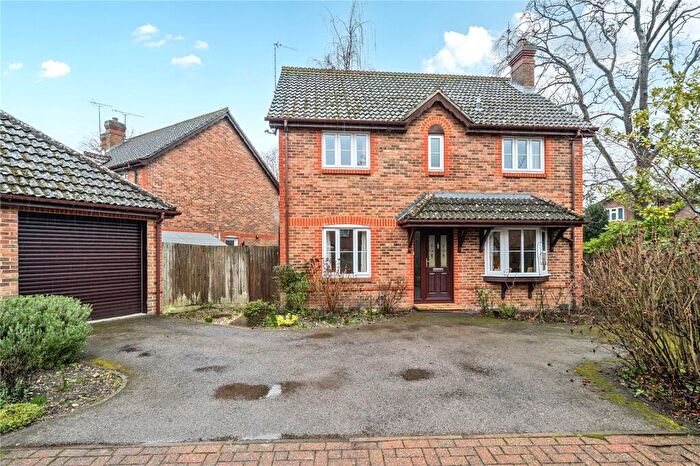
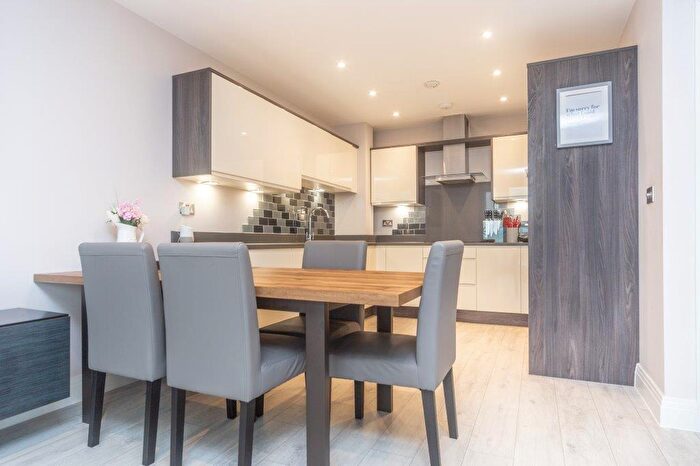
Houses for sale & to rent in Fleet Central, Fleet
House Prices in Fleet Central
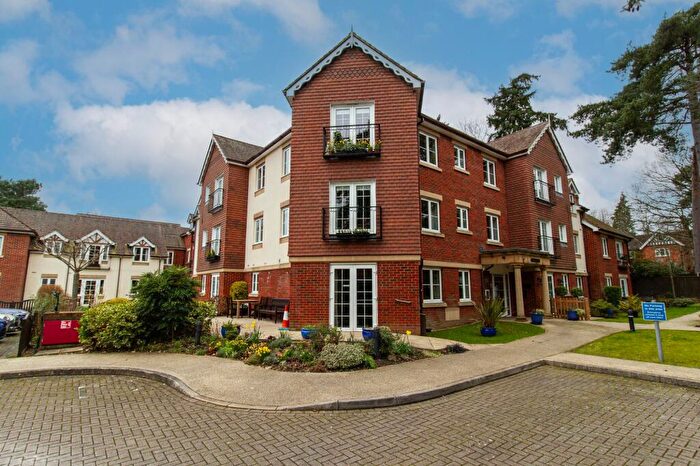
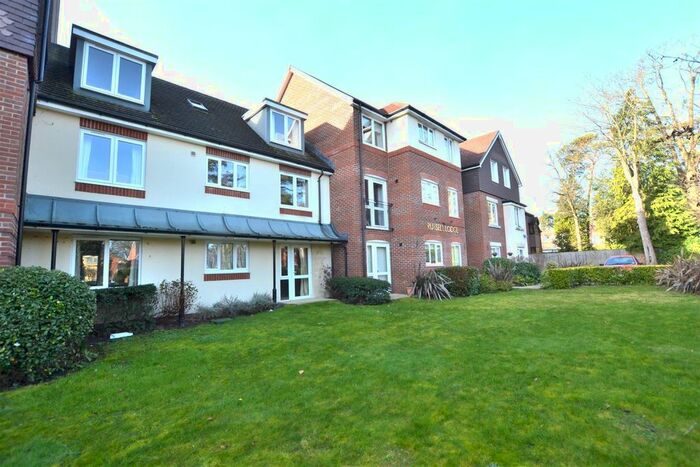
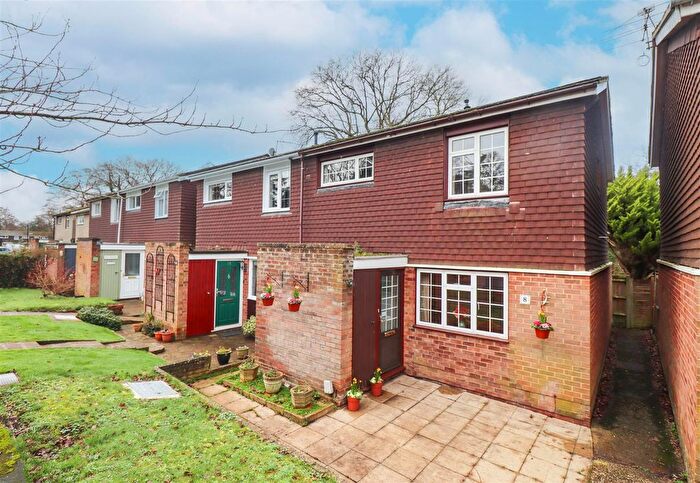
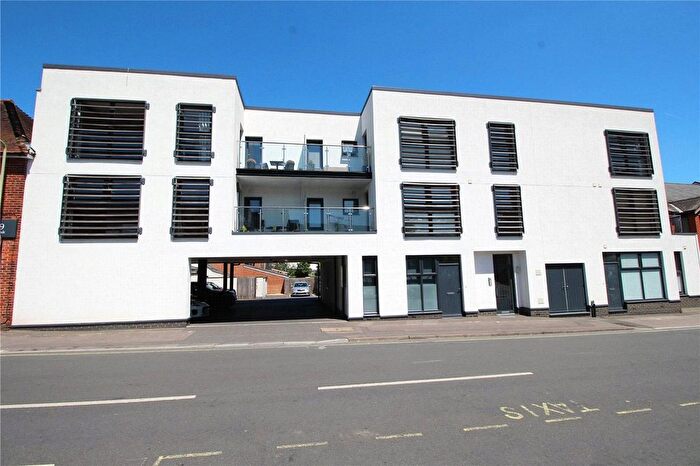
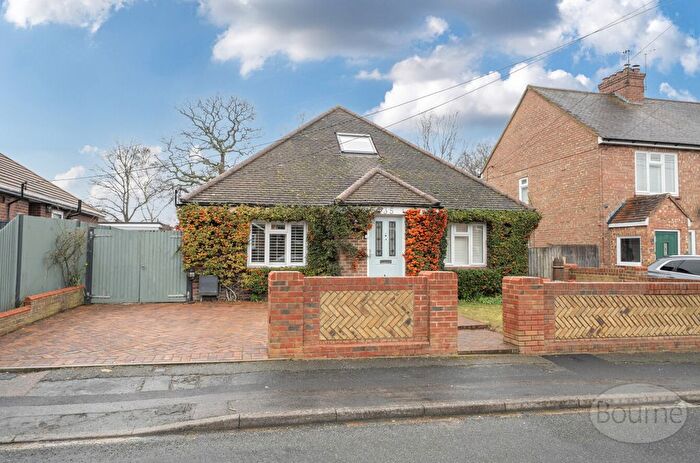
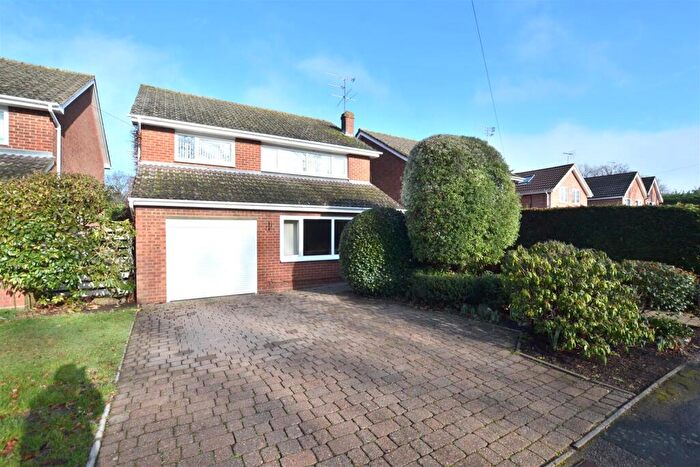
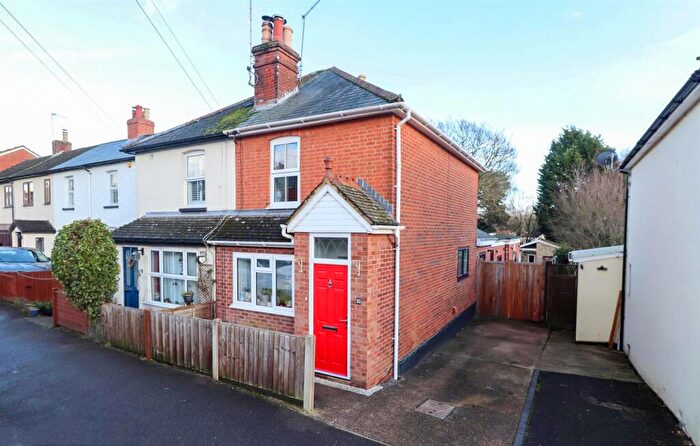
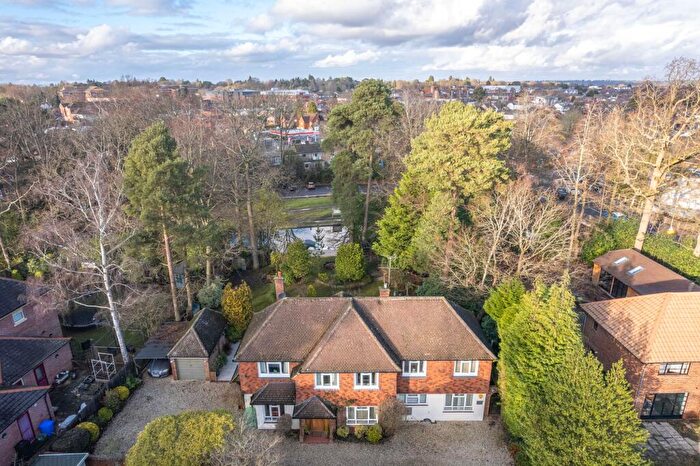
Properties in Fleet Central have an average house price of £384,921.00 and had 401 Property Transactions within the last 3 years¹.
Fleet Central is an area in Fleet, Hampshire with 3,675 households², where the most expensive property was sold for £1,150,000.00.
Properties for sale in Fleet Central
Roads and Postcodes in Fleet Central
Navigate through our locations to find the location of your next house in Fleet Central, Fleet for sale or to rent.
Transport near Fleet Central
-
Fleet Station
-
Winchfield Station
-
Farnborough (Main) Station
-
Aldershot Station
-
Farnborough North Station
-
Blackwater Station
-
Frimley Station
-
North Camp Station
- FAQ
- Price Paid By Year
- Property Type Price
Frequently asked questions about Fleet Central
What is the average price for a property for sale in Fleet Central?
The average price for a property for sale in Fleet Central is £384,921. This amount is 22% lower than the average price in Fleet. There are 1,804 property listings for sale in Fleet Central.
What streets have the most expensive properties for sale in Fleet Central?
The streets with the most expensive properties for sale in Fleet Central are Courtmoor Avenue at an average of £1,001,500, Lawrence Road at an average of £896,250 and Ridley Close at an average of £896,250.
What streets have the most affordable properties for sale in Fleet Central?
The streets with the most affordable properties for sale in Fleet Central are New Barn Close at an average of £129,500, Victoria Gardens at an average of £130,000 and Upper Street at an average of £153,666.
Which train stations are available in or near Fleet Central?
Some of the train stations available in or near Fleet Central are Fleet, Winchfield and Farnborough (Main).
Property Price Paid in Fleet Central by Year
The average sold property price by year was:
| Year | Average Sold Price | Price Change |
Sold Properties
|
|---|---|---|---|
| 2025 | £376,997 | 7% |
110 Properties |
| 2024 | £350,004 | -22% |
150 Properties |
| 2023 | £428,249 | 2% |
141 Properties |
| 2022 | £420,635 | 6% |
145 Properties |
| 2021 | £393,697 | -1% |
209 Properties |
| 2020 | £398,573 | 16% |
141 Properties |
| 2019 | £335,376 | -4% |
184 Properties |
| 2018 | £349,682 | -3% |
170 Properties |
| 2017 | £358,643 | 12% |
175 Properties |
| 2016 | £315,704 | -4% |
235 Properties |
| 2015 | £329,019 | 7% |
207 Properties |
| 2014 | £304,801 | -1% |
171 Properties |
| 2013 | £306,342 | -2% |
139 Properties |
| 2012 | £312,542 | 12% |
148 Properties |
| 2011 | £274,788 | 5% |
140 Properties |
| 2010 | £260,681 | 7% |
133 Properties |
| 2009 | £243,736 | -7% |
138 Properties |
| 2008 | £260,817 | -10% |
152 Properties |
| 2007 | £286,306 | 16% |
266 Properties |
| 2006 | £240,474 | 3% |
239 Properties |
| 2005 | £232,296 | 0,5% |
220 Properties |
| 2004 | £231,156 | 4% |
273 Properties |
| 2003 | £222,826 | 9% |
186 Properties |
| 2002 | £202,070 | 15% |
251 Properties |
| 2001 | £171,868 | 1% |
175 Properties |
| 2000 | £170,384 | 15% |
193 Properties |
| 1999 | £145,344 | 7% |
206 Properties |
| 1998 | £135,586 | 16% |
241 Properties |
| 1997 | £113,280 | 13% |
228 Properties |
| 1996 | £98,646 | 2% |
194 Properties |
| 1995 | £96,910 | - |
169 Properties |
Property Price per Property Type in Fleet Central
Here you can find historic sold price data in order to help with your property search.
The average Property Paid Price for specific property types in the last three years are:
| Property Type | Average Sold Price | Sold Properties |
|---|---|---|
| Flat | £214,032.00 | 177 Flats |
| Semi Detached House | £450,291.00 | 77 Semi Detached Houses |
| Detached House | £674,462.00 | 89 Detached Houses |
| Terraced House | £375,347.00 | 58 Terraced Houses |

