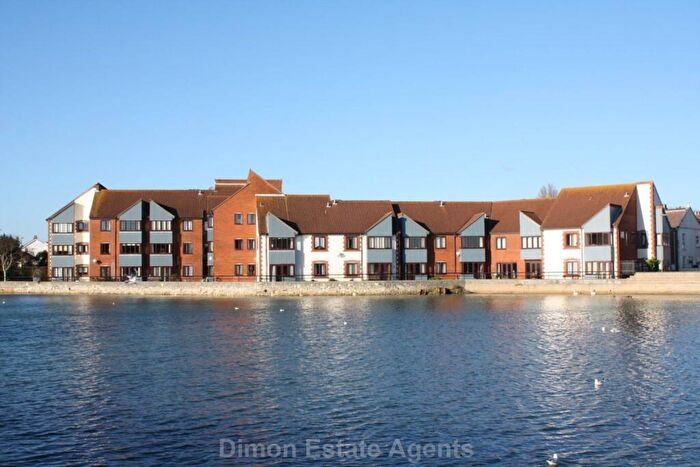
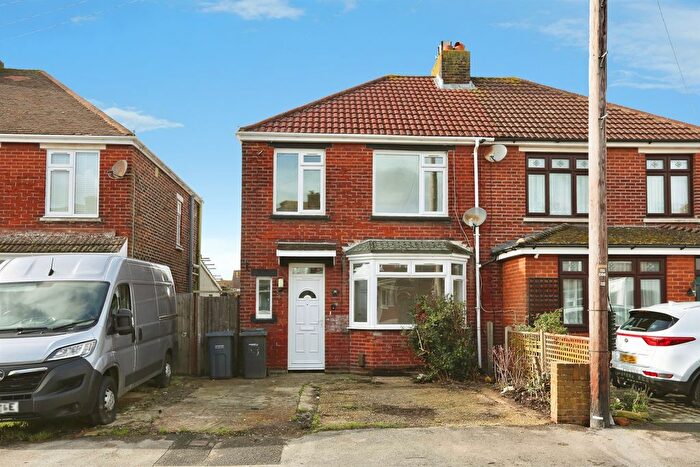
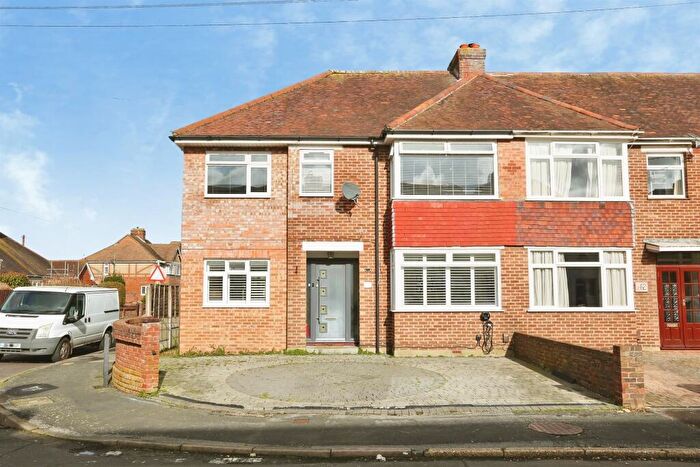
Houses for sale & to rent in Leesland, Gosport
House Prices in Leesland
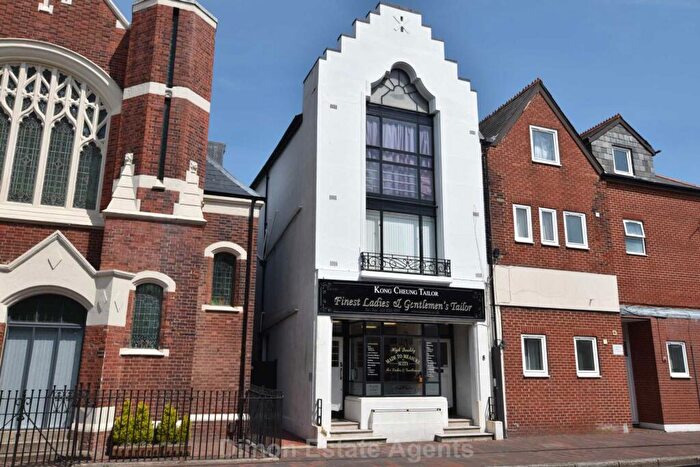
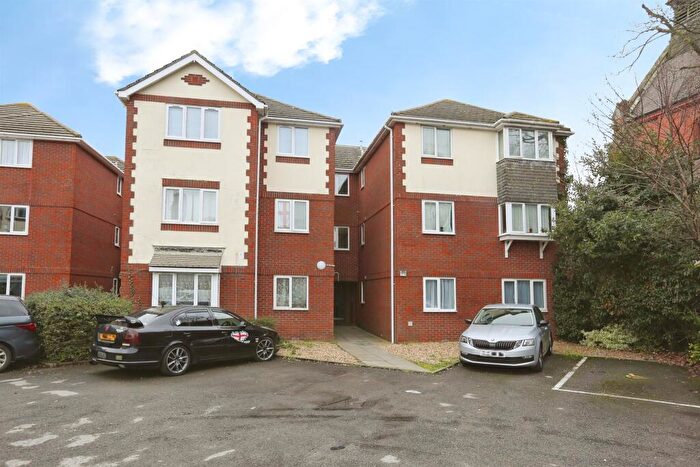
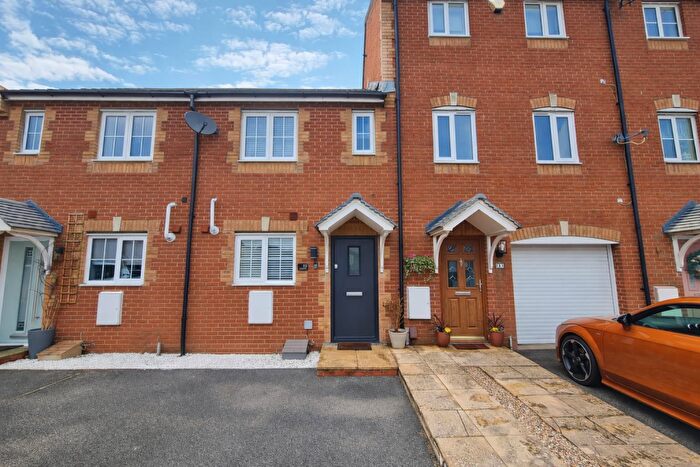
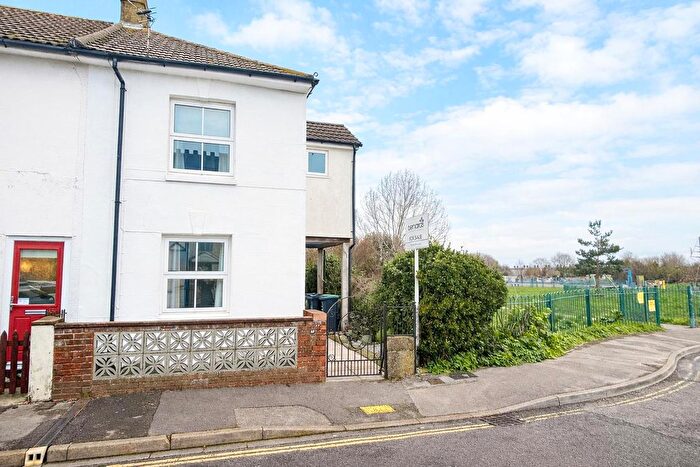
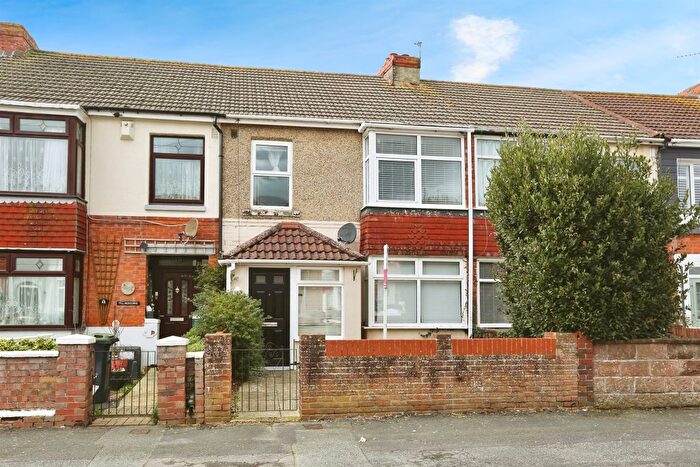
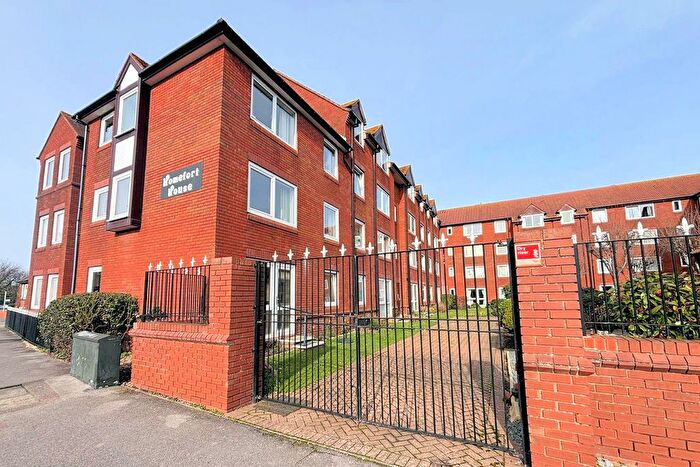
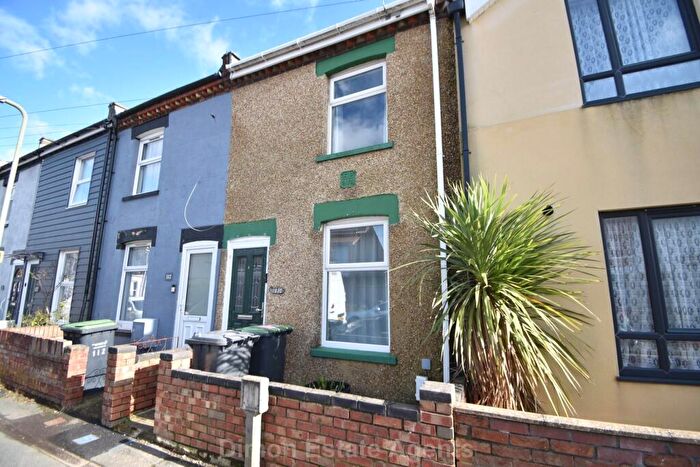
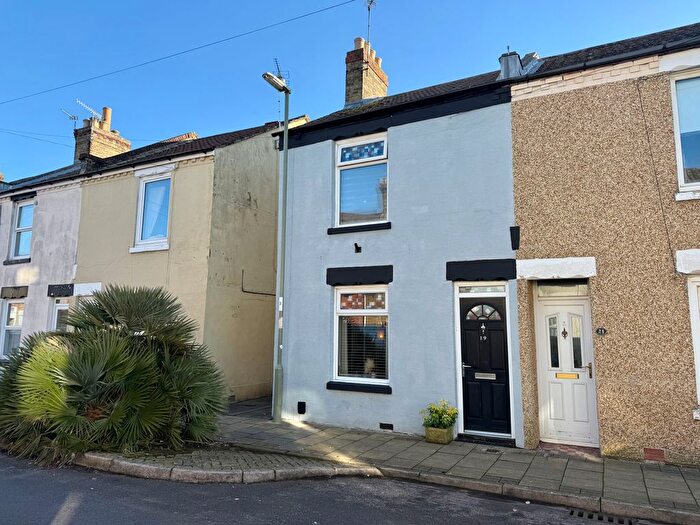
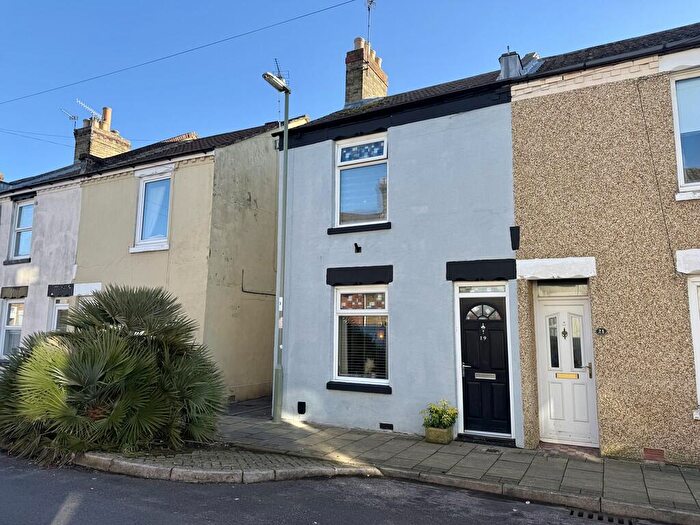
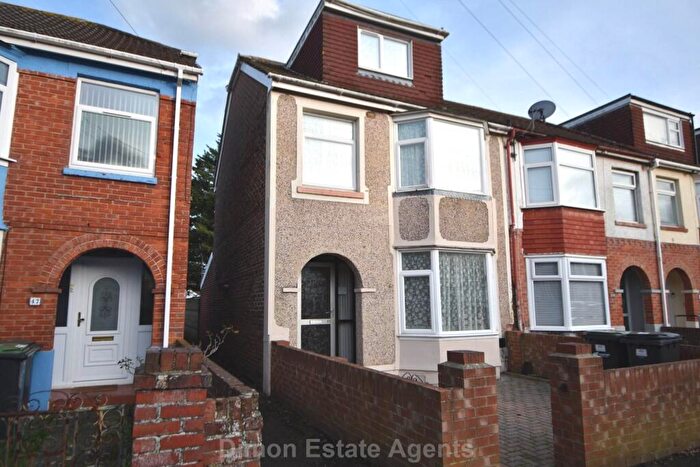
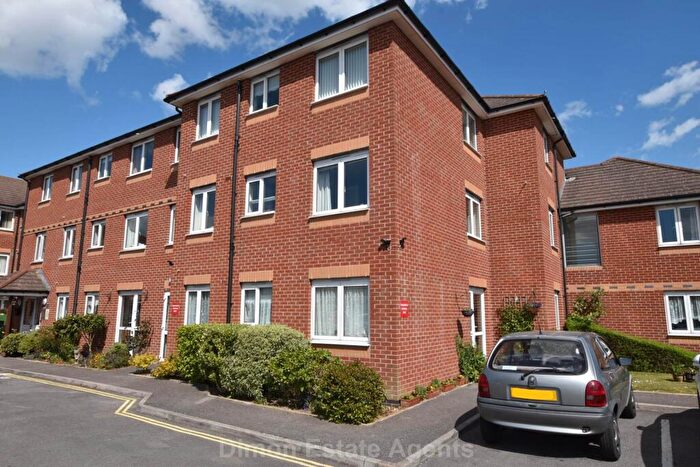
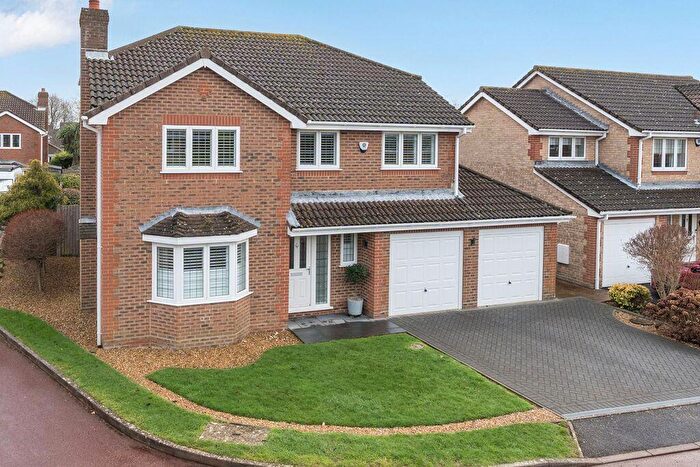
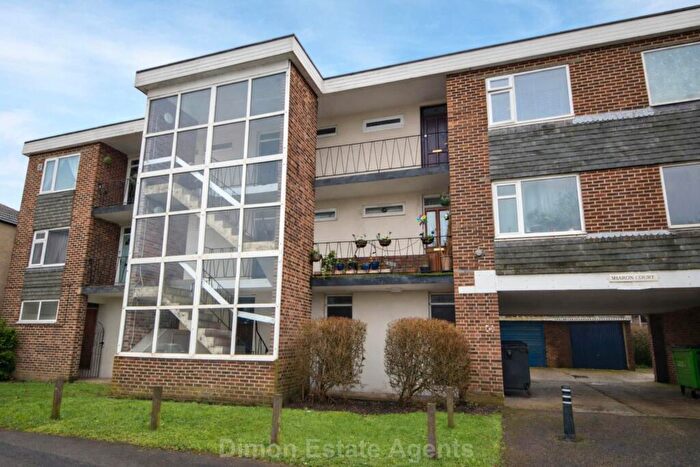
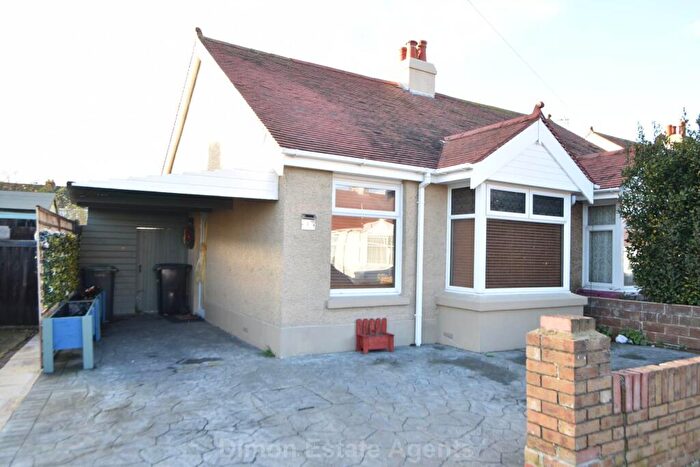
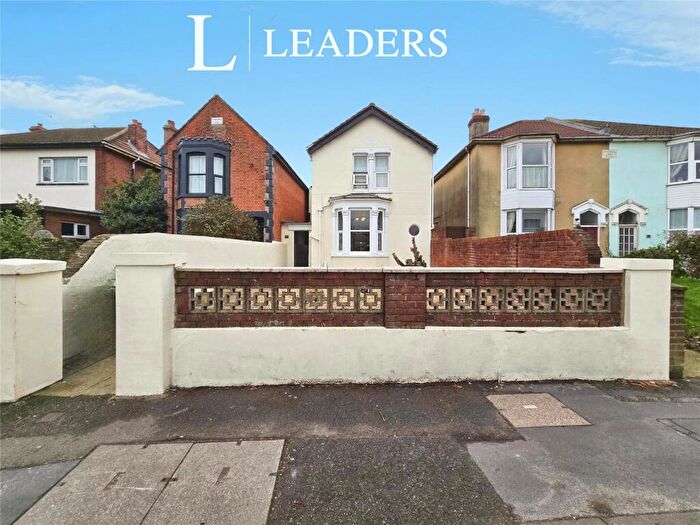
Properties in Leesland have an average house price of £209,735.00 and had 202 Property Transactions within the last 3 years¹.
Leesland is an area in Gosport, Hampshire with 2,215 households², where the most expensive property was sold for £416,500.00.
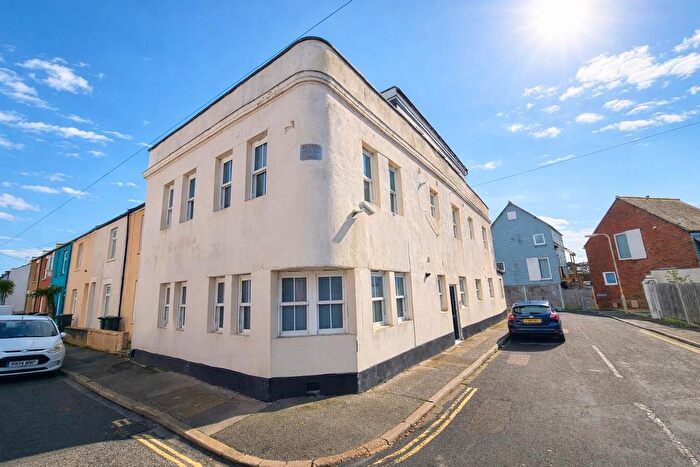
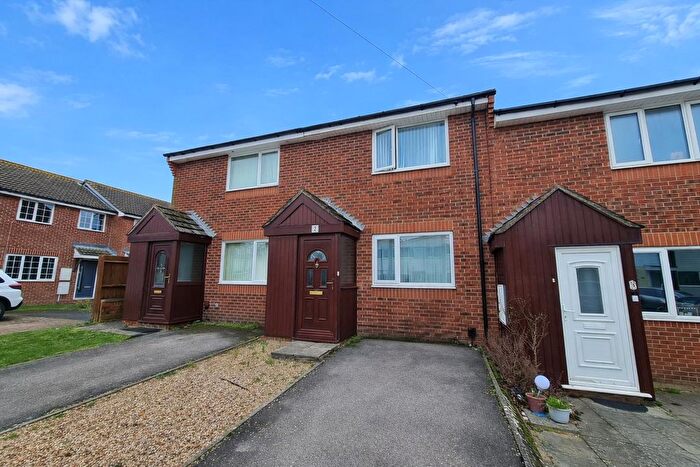
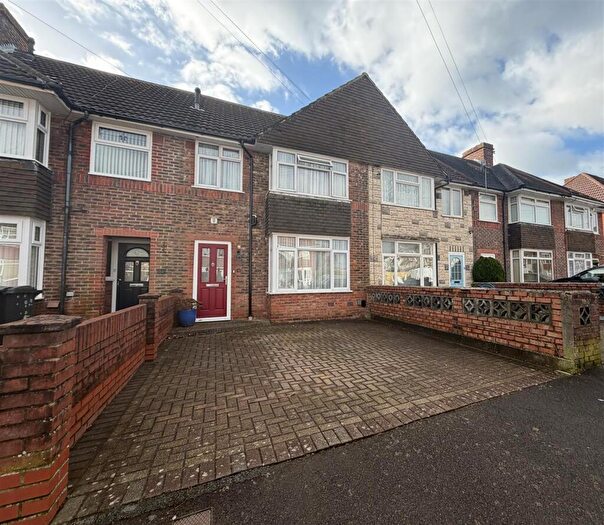
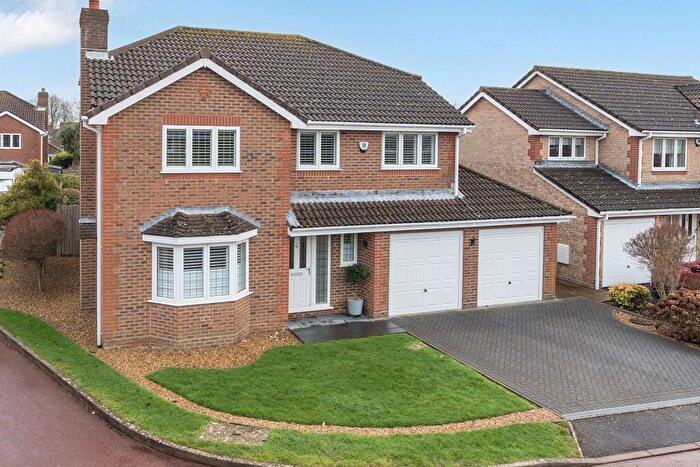
Properties for sale in Leesland
Roads and Postcodes in Leesland
Navigate through our locations to find the location of your next house in Leesland, Gosport for sale or to rent.
| Streets | Postcodes |
|---|---|
| Abingdon Close | PO12 3TT |
| Anns Hill Road | PO12 3JX PO12 3RE PO12 3RF PO12 3NB |
| Barham Close | PO12 4QE |
| Barrita Close | PO12 3NQ |
| Bury Close | PO12 3TU PO12 3TX |
| Bury Crescent | PO12 3TZ |
| Bury Road | PO12 3PX PO12 3UA PO12 3UB PO12 3AQ PO12 3PN PO12 3PW |
| Carlyle Road | PO12 3NH |
| Carnarvon Road | PO12 3QP PO12 3QS |
| Caroline Place | PO12 4AW |
| Chilworth Grove | PO12 3UX PO12 3UR PO12 3UZ |
| Cobden Street | PO12 4QH |
| Cottage Grove | PO12 3NY |
| Fairthorne Gardens | PO12 3PU |
| Farthing Close | PO12 3PS |
| Forton Road | PO12 3HE PO12 3HG PO12 4RL PO12 4TP PO12 4TR PO12 3HA PO12 4TL PO12 4TQ |
| Gordon Road | PO12 3QE PO12 3QF PO12 3PT |
| Greenway Road | PO12 4RG |
| Halliday Close | PO12 4TT |
| Harcourt Road | PO12 3NR |
| Ingledene Close | PO12 3TY |
| Jervis Drive | PO12 4QB PO12 4QD |
| Jessie Road | PO12 3QL |
| Lavinia Road | PO12 3PA PO12 3PB PO12 3PD |
| Lees Lane | PO12 3UW PO12 3UN PO12 3UP |
| Leesland Road | PO12 3ND PO12 3NE PO12 3NF PO12 3NG |
| Lyndhurst Road | PO12 3QY |
| Mill Lane | PO12 4QG PO12 4DQ PO12 4QA PO12 4QF |
| Mill Pond Road | PO12 4QL |
| Moreland Road | PO12 4UU |
| Mulberry Close | PO12 3UG |
| Newlands Avenue | PO12 3QX |
| Norman Road | PO12 3NA |
| Park Street | PO12 4UH |
| Pelham Road | PO12 3NX |
| Queens Road | PO12 1JD |
| Richmond Road | PO12 3QJ |
| Sherwood Road | PO12 3QU |
| Smith Street | PO12 3PH PO12 3PE |
| St Faiths Close | PO12 3PP |
| St Johns Close | PO12 4XB |
| St Johns Square | PO12 4TS |
| The Crossways | PO12 4RH |
| The Sanderson Centre | PO12 3UL |
| Tintern Road | PO12 3QN |
| Toronto Place | PO12 4UZ |
| Trafalgar Square | PO12 3UU |
| Tribe Road | PO12 3NS |
| Vernon Close | PO12 3NU |
| Vernon Road | PO12 3NT |
| Walton Close | PO12 3QH |
| Walton Road | PO12 3QG |
| Whiteacres Close | PO12 4XD |
| Whites Place | PO12 3UJ PO12 3JP |
| Whitworth Close | PO12 3PF |
| Whitworth Road | PO12 3NJ PO12 3NL PO12 3NN PO12 3NW |
| Willow Place | PO12 4QQ |
| Windsor Road | PO12 3QT |
| Zetland Road | PO12 3NZ |
| PO12 3UT |
Transport near Leesland
-
Portsmouth Harbour Station
-
Portsmouth and Southsea Station
-
Fratton Station
-
Portchester Station
-
Ryde Pier Head Station
-
Hilsea Station
-
Fareham Station
-
Cosham Station
-
Ryde Esplanade Station
- FAQ
- Price Paid By Year
- Property Type Price
Frequently asked questions about Leesland
What is the average price for a property for sale in Leesland?
The average price for a property for sale in Leesland is £209,735. This amount is 15% lower than the average price in Gosport. There are 3,081 property listings for sale in Leesland.
What streets have the most expensive properties for sale in Leesland?
The streets with the most expensive properties for sale in Leesland are Bury Close at an average of £355,500, Bury Crescent at an average of £350,000 and Fairthorne Gardens at an average of £327,500.
What streets have the most affordable properties for sale in Leesland?
The streets with the most affordable properties for sale in Leesland are Whiteacres Close at an average of £119,916, Bury Road at an average of £124,999 and Forton Road at an average of £131,785.
Which train stations are available in or near Leesland?
Some of the train stations available in or near Leesland are Portsmouth Harbour, Portsmouth and Southsea and Fratton.
Property Price Paid in Leesland by Year
The average sold property price by year was:
| Year | Average Sold Price | Price Change |
Sold Properties
|
|---|---|---|---|
| 2025 | £203,978 | -4% |
57 Properties |
| 2024 | £211,417 | -1% |
82 Properties |
| 2023 | £212,754 | -4% |
63 Properties |
| 2022 | £221,542 | 8% |
73 Properties |
| 2021 | £202,981 | 4% |
92 Properties |
| 2020 | £194,629 | 14% |
69 Properties |
| 2019 | £168,080 | -1% |
92 Properties |
| 2018 | £170,356 | -2% |
78 Properties |
| 2017 | £172,928 | 8% |
75 Properties |
| 2016 | £158,286 | 10% |
104 Properties |
| 2015 | £142,189 | -5% |
100 Properties |
| 2014 | £149,513 | 15% |
123 Properties |
| 2013 | £126,931 | -2% |
75 Properties |
| 2012 | £128,915 | 4% |
69 Properties |
| 2011 | £123,169 | -3% |
65 Properties |
| 2010 | £127,283 | 1% |
72 Properties |
| 2009 | £126,561 | -4% |
45 Properties |
| 2008 | £131,600 | 1% |
72 Properties |
| 2007 | £130,822 | -1% |
160 Properties |
| 2006 | £132,491 | 7% |
137 Properties |
| 2005 | £122,987 | 7% |
133 Properties |
| 2004 | £114,602 | 9% |
132 Properties |
| 2003 | £104,707 | 18% |
155 Properties |
| 2002 | £85,698 | 19% |
189 Properties |
| 2001 | £69,214 | 12% |
165 Properties |
| 2000 | £61,069 | 14% |
200 Properties |
| 1999 | £52,358 | 7% |
139 Properties |
| 1998 | £48,943 | 6% |
149 Properties |
| 1997 | £45,843 | 5% |
165 Properties |
| 1996 | £43,626 | 12% |
132 Properties |
| 1995 | £38,458 | - |
100 Properties |
Property Price per Property Type in Leesland
Here you can find historic sold price data in order to help with your property search.
The average Property Paid Price for specific property types in the last three years are:
| Property Type | Average Sold Price | Sold Properties |
|---|---|---|
| Semi Detached House | £272,989.00 | 37 Semi Detached Houses |
| Terraced House | £210,957.00 | 129 Terraced Houses |
| Flat | £126,075.00 | 33 Flats |
| Detached House | £297,333.00 | 3 Detached Houses |

