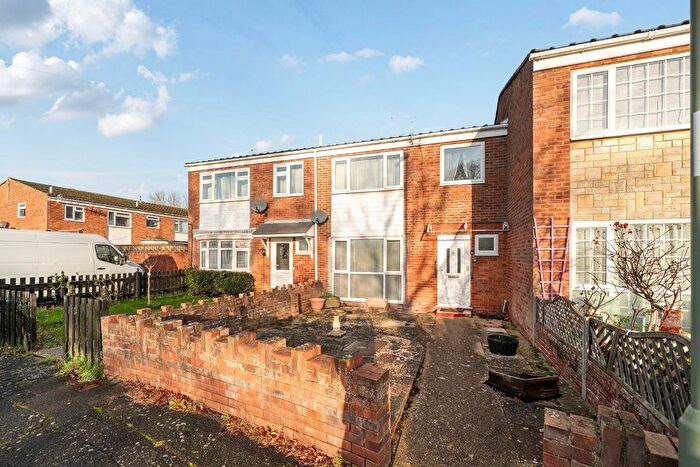
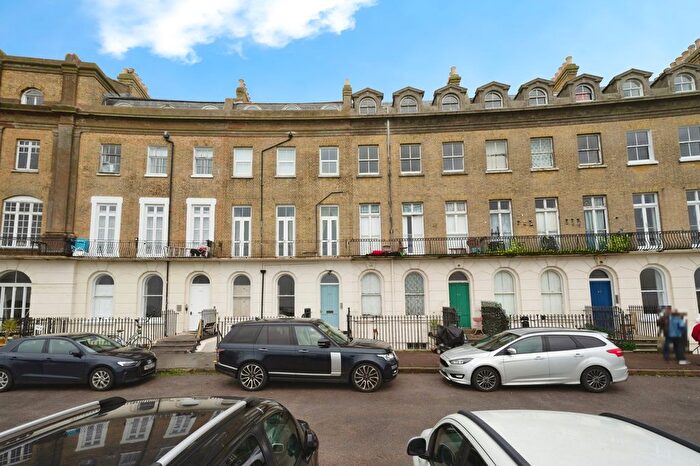
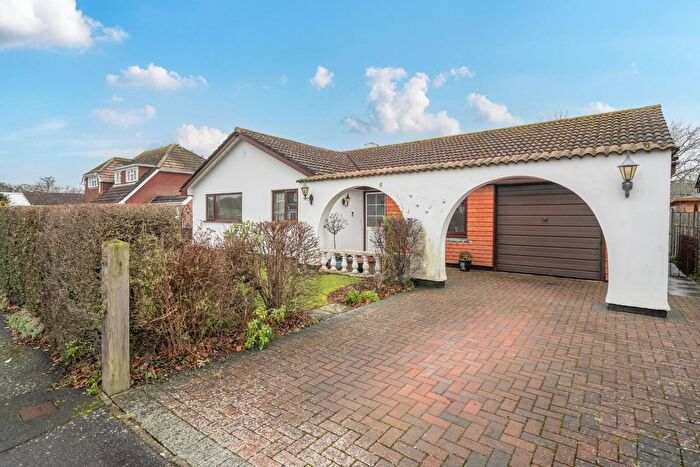
Houses for sale & to rent in Hayling East, Hayling Island
House Prices in Hayling East
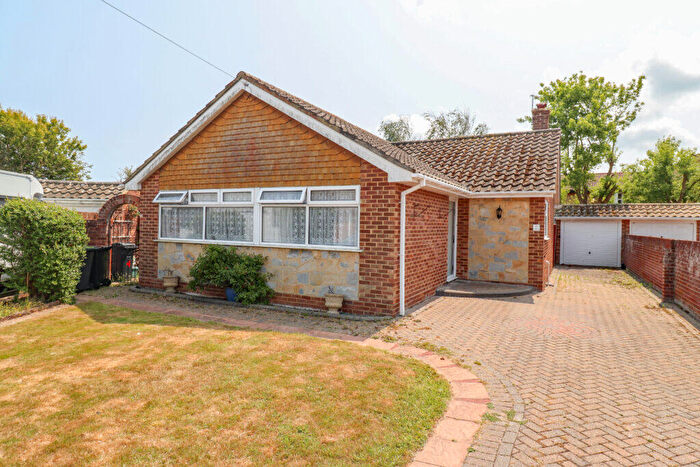
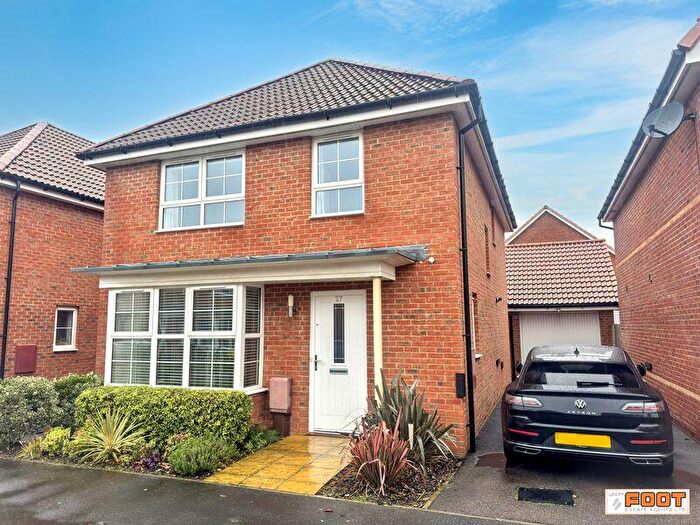
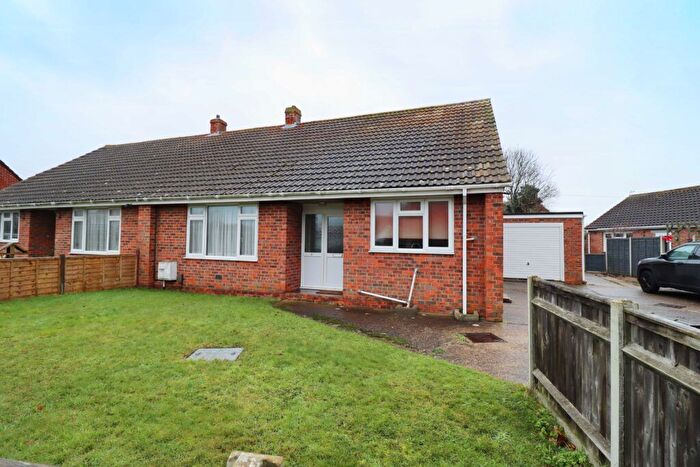
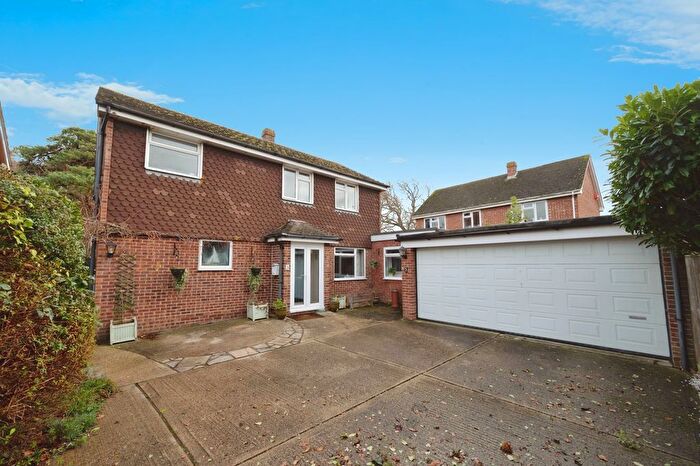
Properties in Hayling East have an average house price of £375,566.00 and had 498 Property Transactions within the last 3 years¹.
Hayling East is an area in Hayling Island, Hampshire with 4,081 households², where the most expensive property was sold for £1,600,000.00.
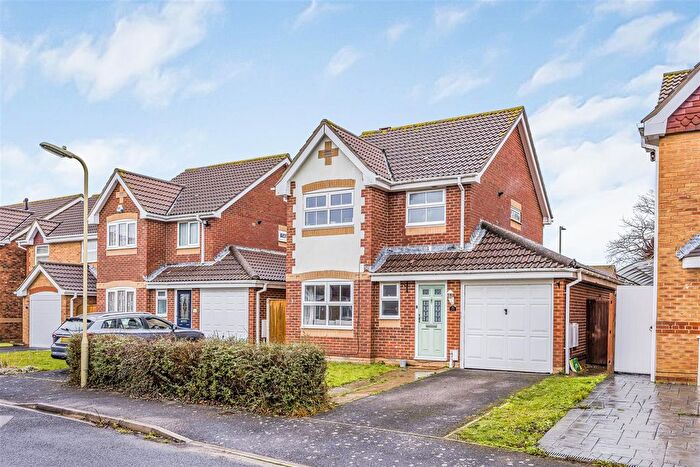
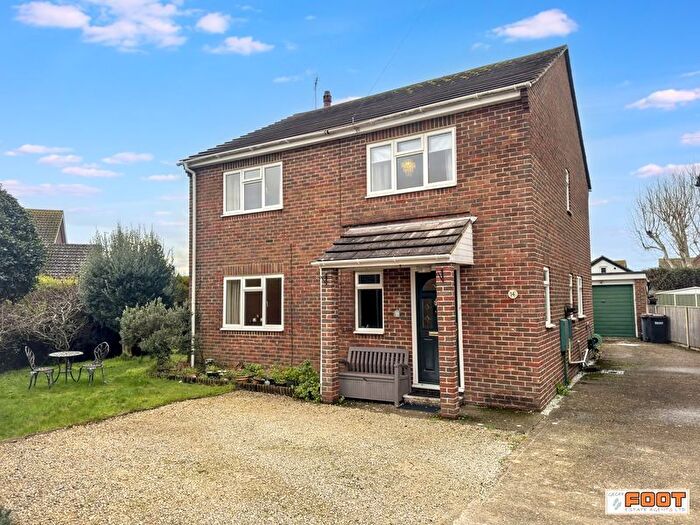
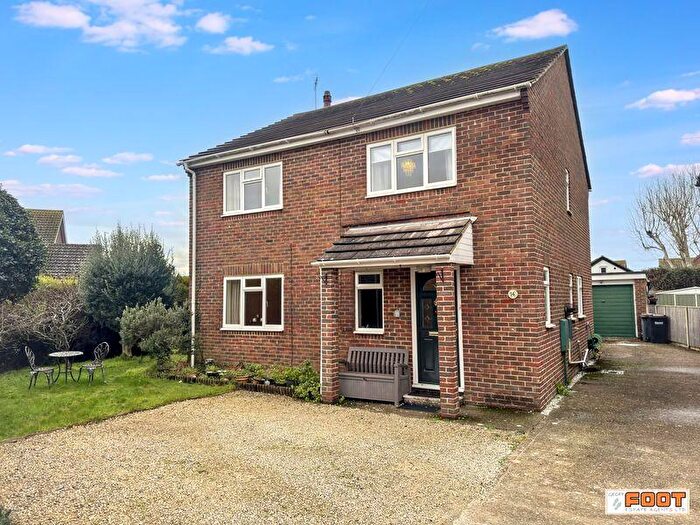
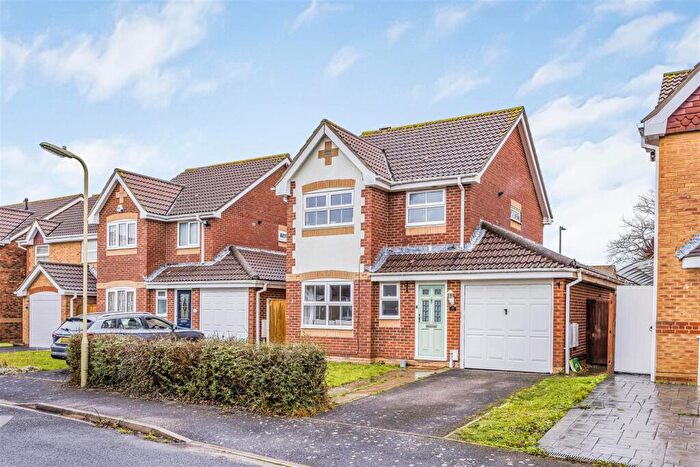
Properties for sale in Hayling East
Roads and Postcodes in Hayling East
Navigate through our locations to find the location of your next house in Hayling East, Hayling Island for sale or to rent.
| Streets | Postcodes |
|---|---|
| Astrid Close | PO11 9PR |
| Austen Gardens | PO11 9FF |
| Beech Grove | PO11 9DP |
| Belmont Gardens | PO11 9RQ |
| Bembridge Court | PO11 9LZ |
| Bembridge Drive | PO11 9LU |
| Birdham Road | PO11 9QY |
| Blackthorn Drive | PO11 9PA |
| Blackthorn Road | PO11 9NY |
| Bosmere Road | PO11 9SA PO11 9SB |
| Bound Lane | PO11 9HU PO11 9HX |
| Bracklesham Road | PO11 9SJ |
| Burdale Drive | PO11 9PF |
| Burgess Close | PO11 9QT |
| Burwood Grove | PO11 9DS |
| Chandlers Close | PO11 9TH |
| Church Lane | PO11 0SB |
| Church Road | PO11 0NT PO11 0NX PO11 0NU |
| Clovelly Road | PO11 0SD |
| Copse Lane | PO11 0QB PO11 0QD PO11 0RH PO11 0RJ PO11 0RQ |
| Coronation Road | PO11 9RZ |
| Creek Road | PO11 9FA PO11 9QZ PO11 9RA PO11 9RD PO11 9RE PO11 9RL |
| Culver Drive | PO11 9LX |
| Dundonald Close | PO11 9DX |
| Earnley Road | PO11 9SU |
| Eastoke Avenue | PO11 9QP PO11 9QR PO11 9QW |
| Eastwood Close | PO11 9DY |
| Elm Grove | PO11 9EF PO11 9EH PO11 9AP PO11 9EW |
| Fishermans Walk | PO11 9QU |
| Fishery Lane | PO11 9NP PO11 9NR PO11 9NT PO11 9NU |
| Goldring Close | PO11 9PN PO11 9PX |
| Grand Parade | PO11 9JD |
| Gutner Lane | PO11 0RN |
| Harold Road | PO11 9LT |
| Haslemere Gardens | PO11 9SD |
| Havant Road | PO11 0NZ PO11 0PA PO11 0PB |
| Haven Road | PO11 9QX PO11 9RY PO11 9RX |
| Hawthorne Grove | PO11 9DW |
| Herons Way | PO11 9FL |
| Ilex Walk | PO11 9NZ |
| Itchenor Road | PO11 9SN |
| Ithica Close | PO11 9DU |
| Kingfisher Close | PO11 9NS |
| Kings Road | PO11 0PD PO11 0PE |
| Laburnum Grove | PO11 9DR |
| Legion Road | PO11 9ES |
| Marine Walk | PO11 9PG PO11 9PQ |
| Marshall Road | PO11 9NH |
| Meath Close | PO11 9QN |
| Mengham Avenue | PO11 9JB |
| Mengham Lane | PO11 9JR PO11 9JT PO11 9JX PO11 9NW |
| Mengham Road | PO11 9BG PO11 9BL PO11 9BS PO11 9BH |
| Mill Rythe Lane | PO11 0QQ |
| My Lords Lane | PO11 9PW |
| Norman Road | PO11 9FQ |
| North Crescent | PO11 9LR |
| Northney Lane | PO11 0SE |
| Northney Road | PO11 0ND PO11 0NF PO11 0NG PO11 0NQ PO11 0WD |
| Nutbourne Road | PO11 9RT PO11 9RU PO11 9UH |
| Old School Drive | PO11 9TE PO11 9TQ |
| Orchard Road | PO11 9JA |
| Osprey Drive | PO11 9BX |
| Oyster Close | PO11 9FP |
| Pagham Gardens | PO11 9SS |
| Palmerston Road | PO11 9ET |
| Pebble Close | PO11 9TG |
| Pepper Close | PO11 0NS |
| Poplar Grove | PO11 9DN |
| Pound Lea | PO11 0PH |
| Pycroft Close | PO11 0RZ |
| Rails Lane | PO11 9LG PO11 9LH PO11 9LL PO11 9LP PO11 9LW PO11 9NJ |
| Rest A Wyle Avenue | PO11 0PG |
| Restawyle Avenue | PO11 0PQ |
| Ritchie Close | PO11 9LA |
| Rowin Close | PO11 9BT |
| Salterns Close | PO11 9PL |
| Salterns Lane | PO11 9LQ PO11 9PH PO11 9PJ |
| Sandy Beach Estate | PO11 9RG |
| Sandy Point | PO11 9SL |
| Sandy Point Road | PO11 9DQ PO11 9RP PO11 9RR |
| Sea Front | PO11 9HL PO11 9HW |
| Sea Front Estate | PO11 9JJ PO11 9JL |
| Sea Grove Avenue | PO11 9EP |
| Sea View Road | PO11 9PD PO11 9PE |
| Seafarers Walk | PO11 9TA |
| Selsey Close | PO11 9SX |
| Selsmore Avenue | PO11 9PB |
| Selsmore Road | PO11 9JP PO11 9JY PO11 9JZ PO11 9LB PO11 9LD PO11 9LE |
| Shute Close | PO11 9FS |
| Sidlesham Close | PO11 9ST |
| Silver Sands Gardens | PO11 9TJ |
| Simmons Green | PO11 9PP |
| Southwood Road | PO11 9AS PO11 9BQ PO11 9FB PO11 9FD PO11 9PS PO11 9PT PO11 9PU PO11 9PY PO11 9PZ PO11 9QB PO11 9QD PO11 9QE PO11 9QF PO11 9QG PO11 9QH PO11 9QL PO11 9QQ PO11 9RB PO11 9RH PO11 9RJ PO11 9TB PO11 9UA PO11 9UR PO11 9NQ PO11 9QJ |
| Spencer Close | PO11 9HJ |
| Spinnaker Grange | PO11 0SJ |
| St Andrews Road | PO11 9JN PO11 9JS |
| St Benedict Road | PO11 9FN |
| St Hermans Caravan Estate | PO11 9NB PO11 9ND PO11 9NE PO11 9NF PO11 9NG |
| St Hermans Road | PO11 9NA |
| St Leonards Avenue | PO11 9BN PO11 9BW PO11 9BZ |
| St Margarets Road | PO11 9BP |
| St Peters Avenue | PO11 0SA |
| St Peters Road | PO11 0RP PO11 0RT PO11 0RX |
| Stead Close | PO11 9BU |
| Sunshine Avenue | PO11 9TF |
| Suntrap Gardens | PO11 9EL |
| Swans Walk | PO11 9TX |
| Teal Close | PO11 9NN |
| The Glade | PO11 9LY |
| The Sanderlings | PO11 9HZ |
| The Strand | PO11 9UB |
| Thorney View | PO11 0RU |
| Tournerbury Lane | PO11 9DH PO11 9DJ PO11 9DL |
| Treloar Road | PO11 9SE |
| Waders Walk | PO11 9FT |
| Webb Close | PO11 9JG |
| Webb Lane | PO11 9JE PO11 9JF PO11 9FG |
| West Haye Road | PO11 9RN |
| Wheatlands Avenue | PO11 9SG PO11 9SQ |
| Wheatlands Crescent | PO11 9SH |
| Whitethorn Road | PO11 9LS |
| Wight View | PO11 9LN |
| Windsurfing Place | PO11 9FR |
| Winsor Close | PO11 9RF |
| Wittering Road | PO11 9SP PO11 9SR |
| Woodgaston Lane | PO11 0RL |
| Wyborn Close | PO11 9HY |
| Yachthaven | PO11 0BF |
| PO11 0NH PO11 0FR |
Transport near Hayling East
-
Emsworth Station
-
Warblington Station
-
Havant Station
-
Bedhampton Station
-
Southbourne Station
-
Fratton Station
-
Hilsea Station
- FAQ
- Price Paid By Year
- Property Type Price
Frequently asked questions about Hayling East
What is the average price for a property for sale in Hayling East?
The average price for a property for sale in Hayling East is £375,566. This amount is 1% lower than the average price in Hayling Island. There are 3,869 property listings for sale in Hayling East.
What streets have the most expensive properties for sale in Hayling East?
The streets with the most expensive properties for sale in Hayling East are Gutner Lane at an average of £877,500, Wittering Road at an average of £863,333 and Seafarers Walk at an average of £862,500.
What streets have the most affordable properties for sale in Hayling East?
The streets with the most affordable properties for sale in Hayling East are Goldring Close at an average of £184,266, Palmerston Road at an average of £204,928 and Legion Road at an average of £215,000.
Which train stations are available in or near Hayling East?
Some of the train stations available in or near Hayling East are Emsworth, Warblington and Havant.
Property Price Paid in Hayling East by Year
The average sold property price by year was:
| Year | Average Sold Price | Price Change |
Sold Properties
|
|---|---|---|---|
| 2025 | £353,473 | 1% |
65 Properties |
| 2024 | £350,851 | -7% |
135 Properties |
| 2023 | £375,970 | -7% |
131 Properties |
| 2022 | £403,826 | 5% |
167 Properties |
| 2021 | £385,139 | 9% |
216 Properties |
| 2020 | £349,368 | 10% |
160 Properties |
| 2019 | £315,919 | 5% |
132 Properties |
| 2018 | £299,805 | -5% |
176 Properties |
| 2017 | £313,490 | 7% |
193 Properties |
| 2016 | £292,009 | 17% |
257 Properties |
| 2015 | £242,261 | 1% |
194 Properties |
| 2014 | £240,170 | 4% |
209 Properties |
| 2013 | £231,531 | 5% |
167 Properties |
| 2012 | £219,578 | 0,2% |
137 Properties |
| 2011 | £219,173 | -15% |
103 Properties |
| 2010 | £252,268 | 22% |
155 Properties |
| 2009 | £196,350 | -12% |
131 Properties |
| 2008 | £219,615 | -5% |
127 Properties |
| 2007 | £230,498 | 10% |
269 Properties |
| 2006 | £207,673 | 6% |
226 Properties |
| 2005 | £195,956 | -8% |
166 Properties |
| 2004 | £212,268 | 19% |
224 Properties |
| 2003 | £171,857 | 13% |
204 Properties |
| 2002 | £150,273 | 21% |
247 Properties |
| 2001 | £118,820 | 7% |
262 Properties |
| 2000 | £110,449 | 13% |
221 Properties |
| 1999 | £96,347 | 14% |
328 Properties |
| 1998 | £82,884 | 3% |
259 Properties |
| 1997 | £80,303 | 11% |
318 Properties |
| 1996 | £71,169 | 9% |
280 Properties |
| 1995 | £64,487 | - |
196 Properties |
Property Price per Property Type in Hayling East
Here you can find historic sold price data in order to help with your property search.
The average Property Paid Price for specific property types in the last three years are:
| Property Type | Average Sold Price | Sold Properties |
|---|---|---|
| Flat | £198,408.00 | 129 Flats |
| Semi Detached House | £361,806.00 | 104 Semi Detached Houses |
| Detached House | £496,030.00 | 224 Detached Houses |
| Terraced House | £309,719.00 | 41 Terraced Houses |

