
Houses for sale in RG27 9DS, Nightingale Gardens, Hook, Hook
House Prices in RG27 9DS, Nightingale Gardens, Hook
Properties in RG27 9DS have no sales history available within the last 3 years. RG27 9DS is a postcode in Nightingale Gardens located in Hook, an area in Hook, Hampshire, with 4 households².
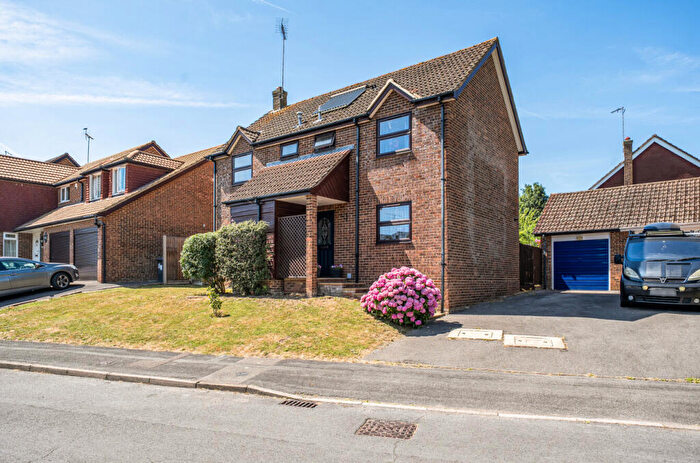
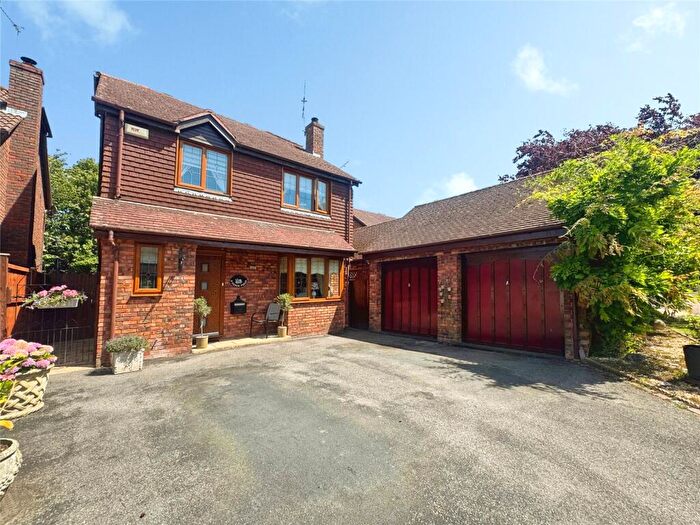
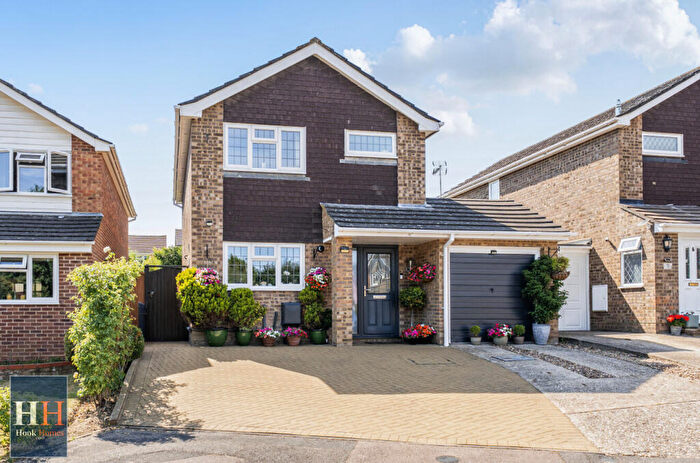
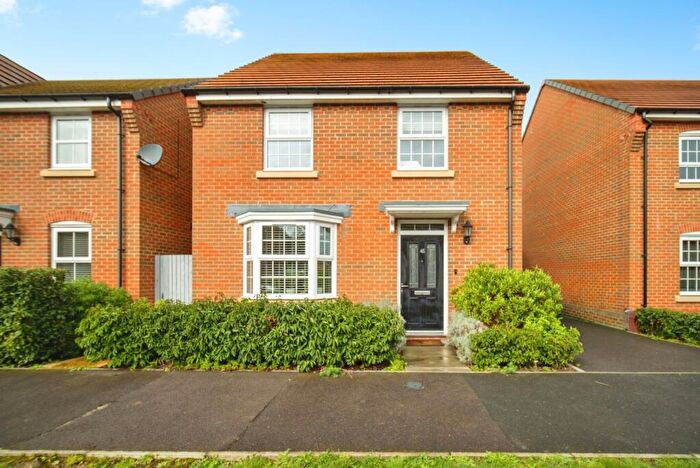
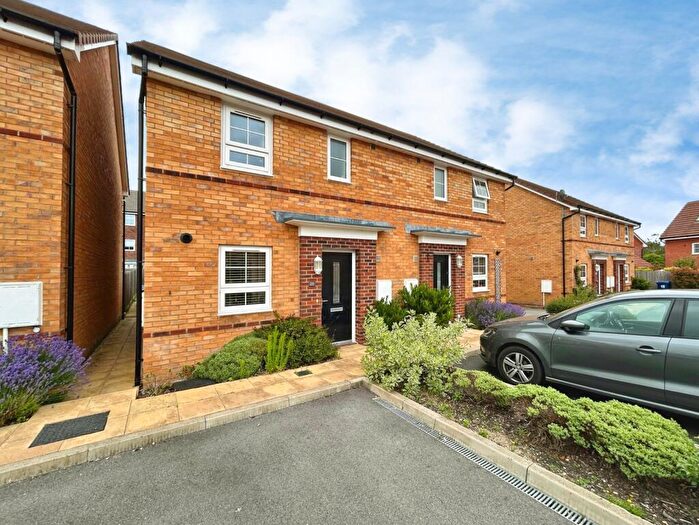
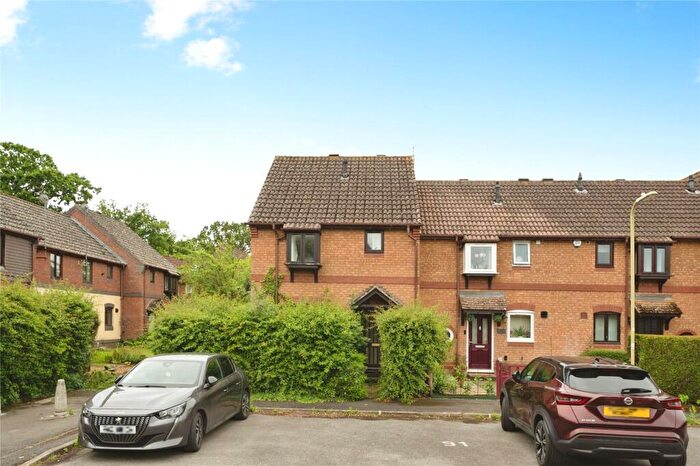
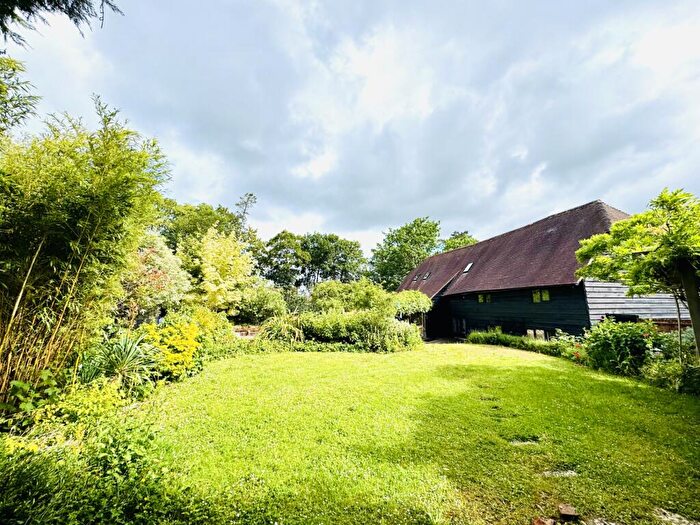
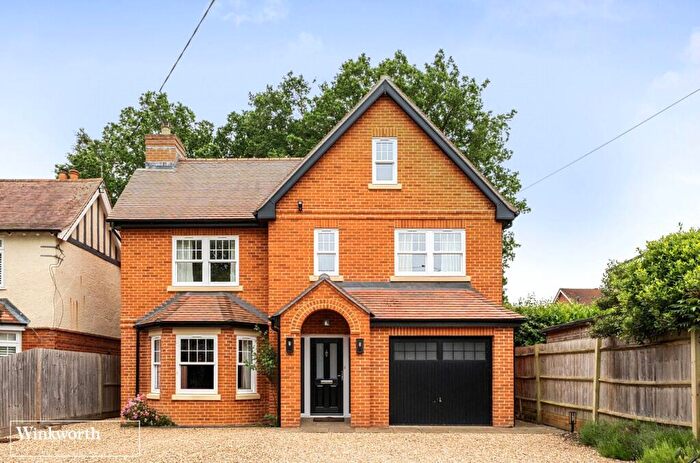
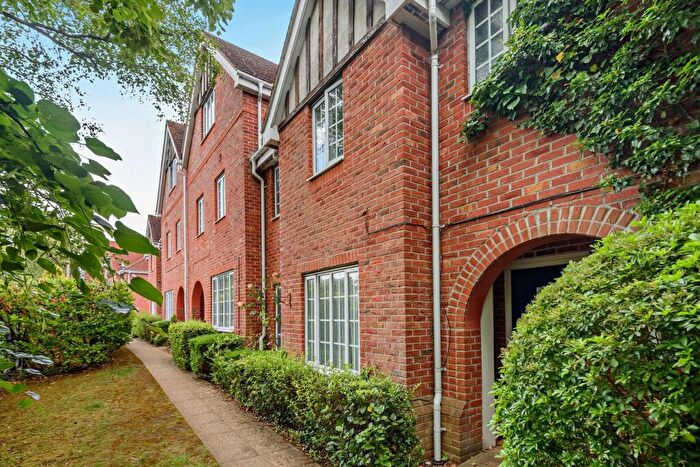
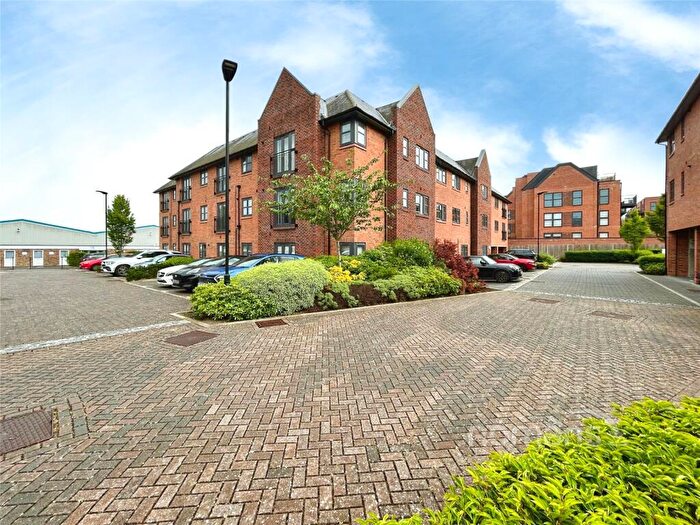
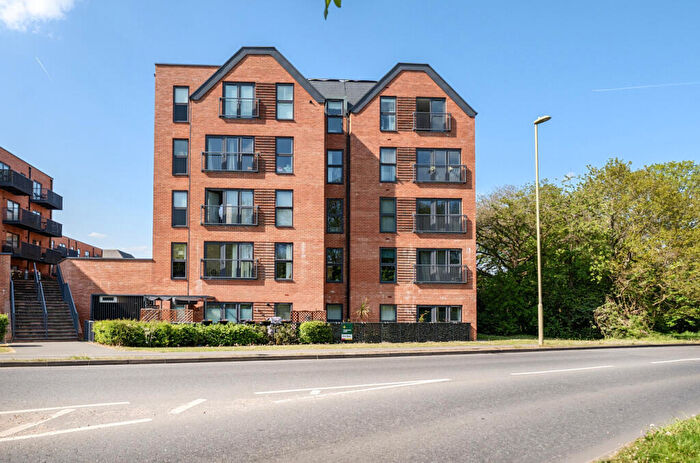
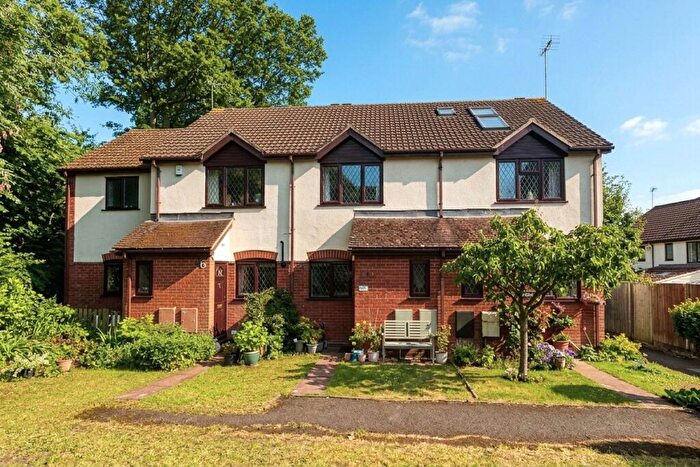
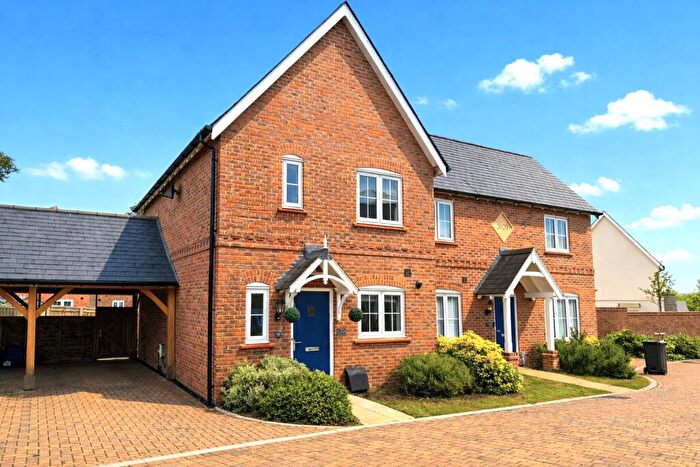
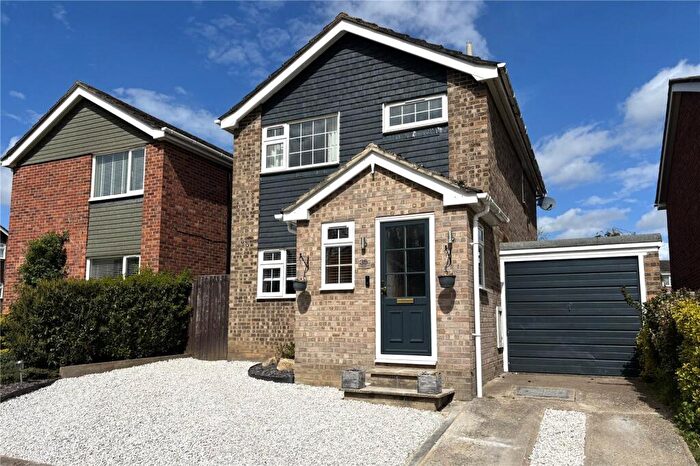
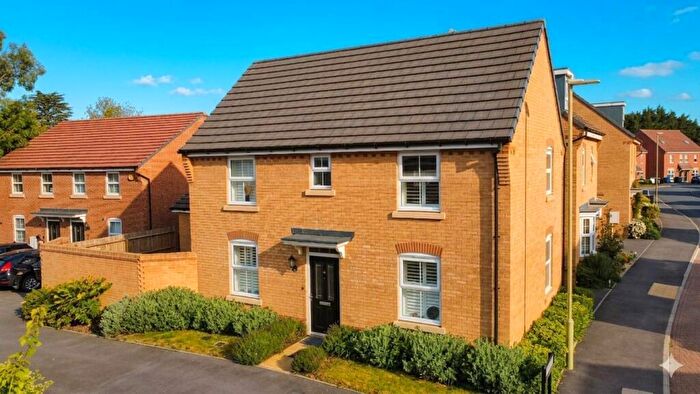
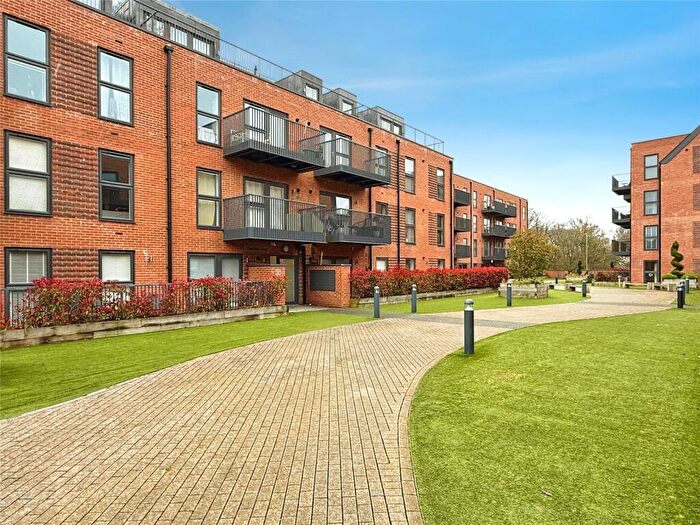
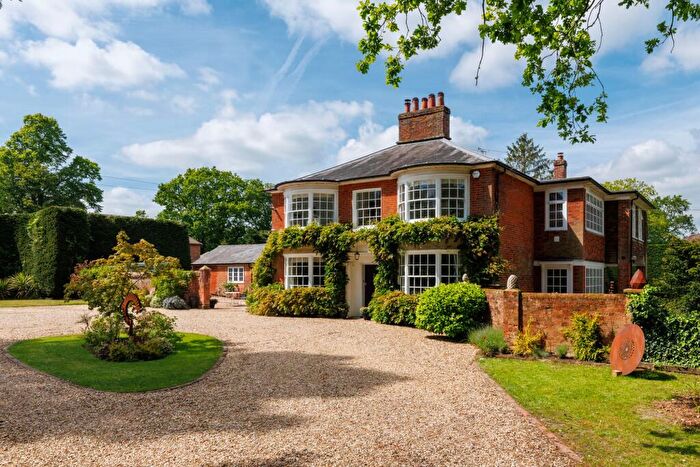
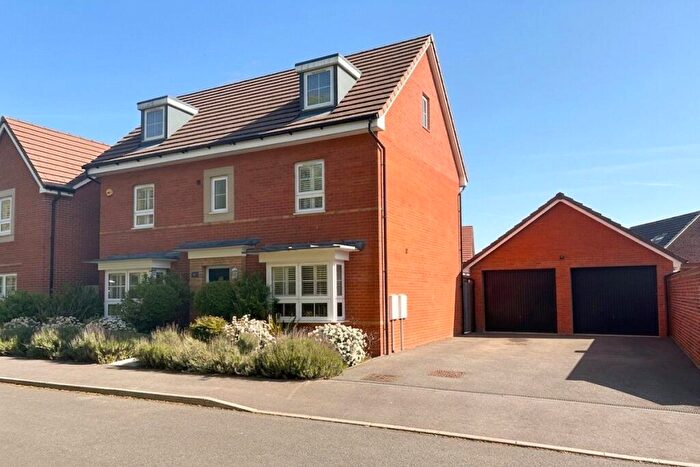
Properties for sale near RG27 9DS, Nightingale Gardens
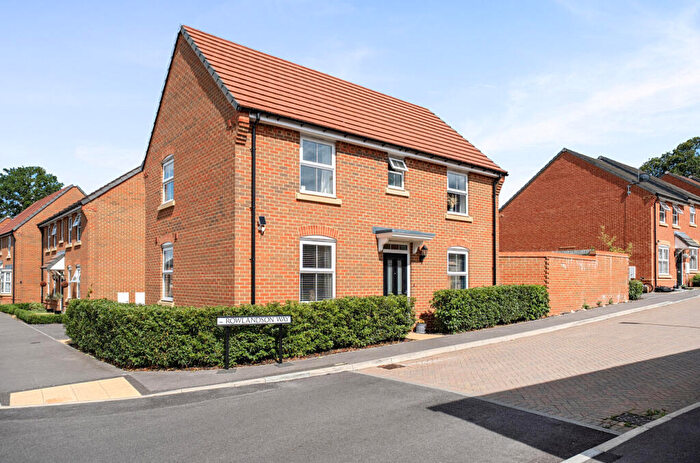
![]()
If you are looking to sell your house, let it out, or receive a property valuation, an expert can help you.
Click the button below to get started.
Price Paid in Nightingale Gardens, RG27 9DS, Hook
2 Nightingale Gardens, RG27 9DS, Hook Hook
Property 2 has been sold 2 times. The last time it was sold was in 09/06/2016 and the sold price was £445,000.00.
This detached house, sold as a freehold on 09/06/2016, is a 100 sqm detached house with an EPC rating of D.
| Date | Price | Property Type | Tenure | Classification |
|---|---|---|---|---|
| 09/06/2016 | £445,000.00 | Detached House | freehold | Established Building |
| 14/09/2012 | £316,000.00 | Detached House | freehold | Established Building |
4 Nightingale Gardens, RG27 9DS, Hook Hook
Property 4 has been sold 1 time. The last time it was sold was in 19/10/2007 and the sold price was £350,000.00.
This is a Detached House which was sold as a freehold in 19/10/2007
| Date | Price | Property Type | Tenure | Classification |
|---|---|---|---|---|
| 19/10/2007 | £350,000.00 | Detached House | freehold | Established Building |
Property price trends in RG27 9DS, Nightingale Gardens
According to the latest Land Registry data, the average home in RG27 9DS, Nightingale Gardens sold for £445,000 in 2016. That figure comes from 3 sales logged over the past 9 years.
Prices have continued to climb over the last three years. Compared with 2012, when the typical sale came in around £316,000, that's a rise of roughly 40.8%.
Looking back five years, average prices are up about 40.8% since 2012, a gain of around £129,000 in cash terms.
Zoom out to the past decade for the fuller picture. Back in 2007, homes here averaged £350,000, so the typical sold price has climbed about 27.1% since then, roughly 2.7% a year.
Property Price Paid in RG27 9DS, Nightingale Gardens by Year
The average sold property price by year was:
| Year | Average Sold Price | Price Change |
Sold Properties
|
|---|---|---|---|
| 2016 | £445,000 | 29% |
1 Property |
| 2012 | £316,000 | -11% |
1 Property |
| 2007 | £350,000 | - |
1 Property |
