
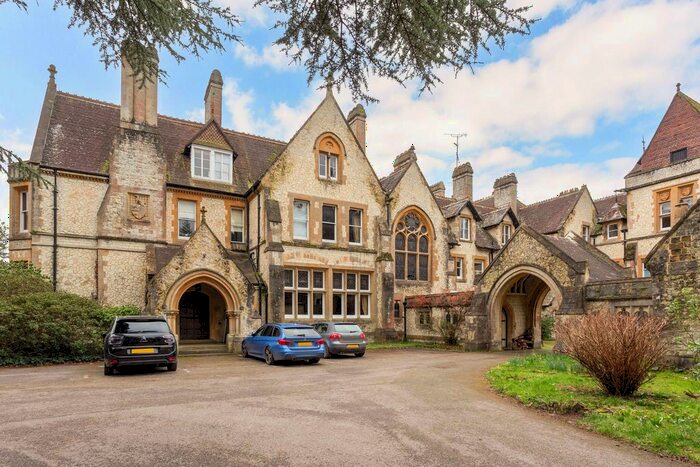
Houses for sale in Selborne, Liss
House Prices in Selborne
Properties in Selborne have an average house price of £538k and had 3 Property Transactions within the last 3 years¹.
Selborne is an area in Liss, Hampshire with 50 households², where the most expensive property was sold for £1.05M.
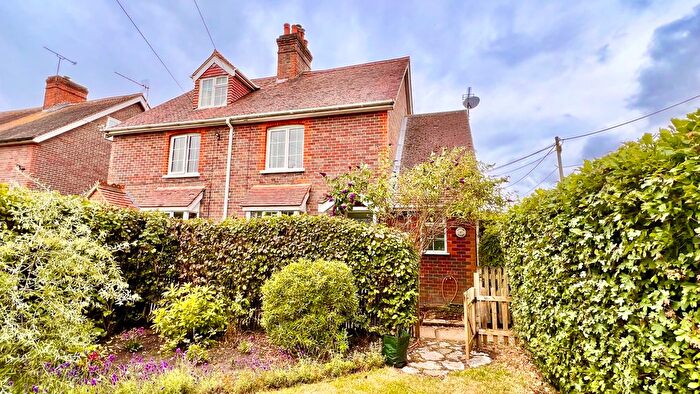
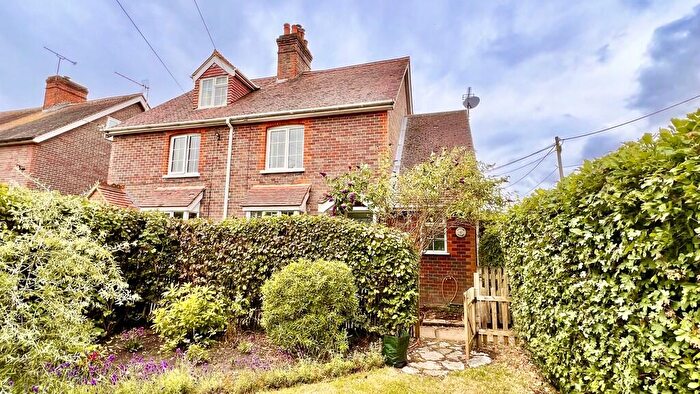
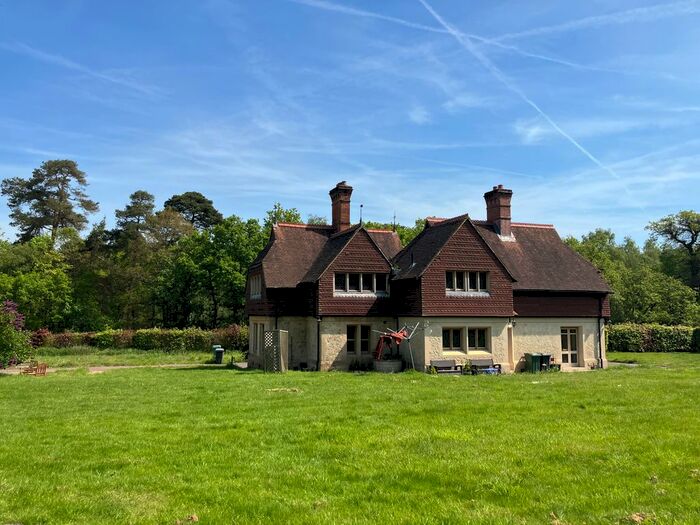
Properties for sale in Selborne
Previously listed properties in Selborne

![]()
If you are looking to sell your house, let it out, or receive a property valuation, an expert can help you.
Click the button below to get started.


Roads and Postcodes in Selborne
Navigate through our locations to find the location of your next house in Selborne, Liss for sale or to rent.
| Streets | Postcodes |
|---|---|
| Benhams Lane | GU33 6BE |
| Blackmoor Road | GU33 6BJ GU33 6BL |
| Honey Lane | GU33 6BU |
| Sotherington Lane | GU33 6BZ GU33 6DA |
| GU33 6BN GU33 6BY GU33 6DD GU33 6DE |
Property price trends in Selborne
According to the latest Land Registry data, the average home in Selborne sold for £265,000 in 2025. That figure comes from 60 sales logged over the past 30 years.
Prices have fallen back over the last three years. Compared with 2022, when the typical sale came in around £2,151,666, that's a fall of roughly 87.7%.
Looking back five years, average prices are down about 64.3% since 2019, a drop of around £478,333 in cash terms.
Zoom out to the past decade for the fuller picture. Back in 2015, homes here averaged £910,000, so the typical sold price has fallen about 70.9% since then, around 11.6% a year lower. Stretch the view to fifteen years and that annual pace edges up closer to -6.1%.
Frequently asked questions about Selborne
What is the average price for a property for sale in Selborne?
The average price for a property for sale in Selborne is £538,333. This amount is 12% lower than the average price in Liss. There are 12 property listings for sale in Selborne.
Which train stations are available in or near Selborne?
Some of the train stations available in or near Selborne are Liss, Liphook and Alton.
Property Price Paid in Selborne by Year
The average sold property price by year was:
| Year | Average Sold Price | Price Change |
Sold Properties
|
|---|---|---|---|
| 2025 | £265,000 | -155% |
1 Property |
| 2023 | £675,000 | -219% |
2 Properties |
| 2022 | £2,151,666 | 68% |
3 Properties |
| 2021 | £697,500 | -7% |
2 Properties |
| 2019 | £743,333 | 56% |
3 Properties |
| 2018 | £325,000 | -71% |
1 Property |
| 2017 | £555,000 | -21% |
1 Property |
| 2016 | £670,000 | -36% |
2 Properties |
| 2015 | £910,000 | 31% |
3 Properties |
| 2014 | £630,000 | 22% |
1 Property |
Property Price per Property Type in Selborne
Here you can find historic sold price data in order to help with your property search.
The average Property Paid Price for specific property types in the last three years are:
| Property Type | Average Sold Price | Sold Properties |
|---|---|---|
| Flat | £538,333.00 | 3 Flats |
