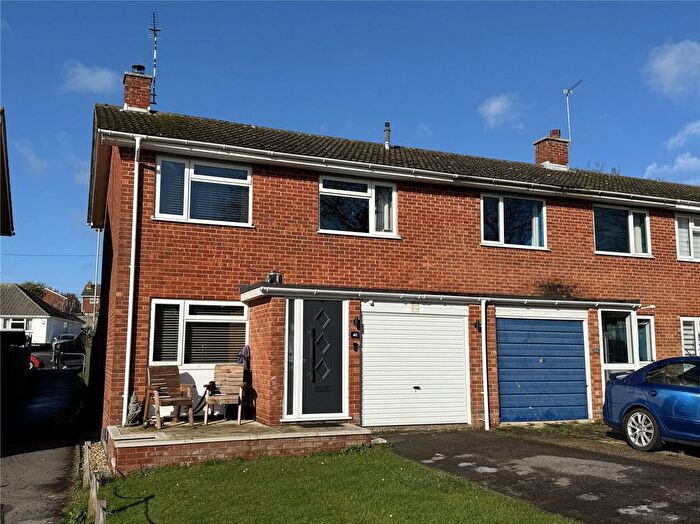
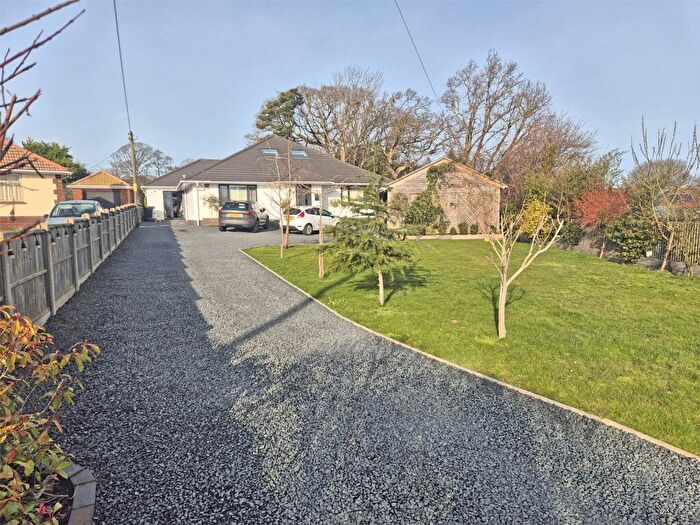
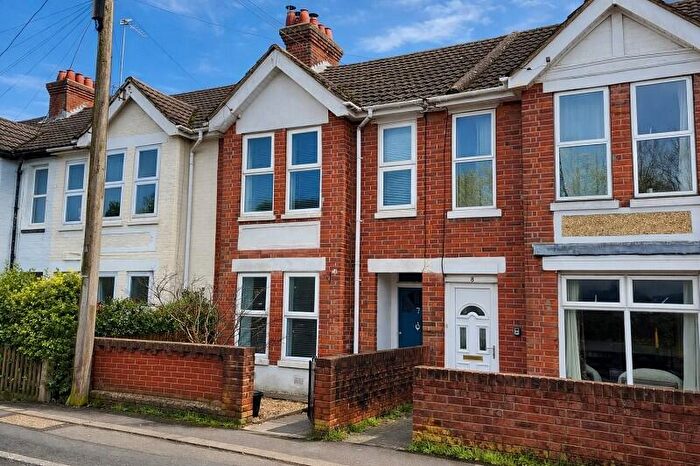
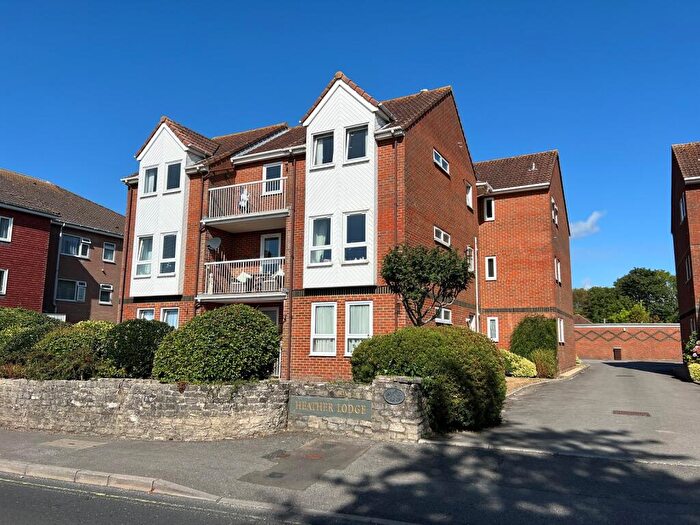
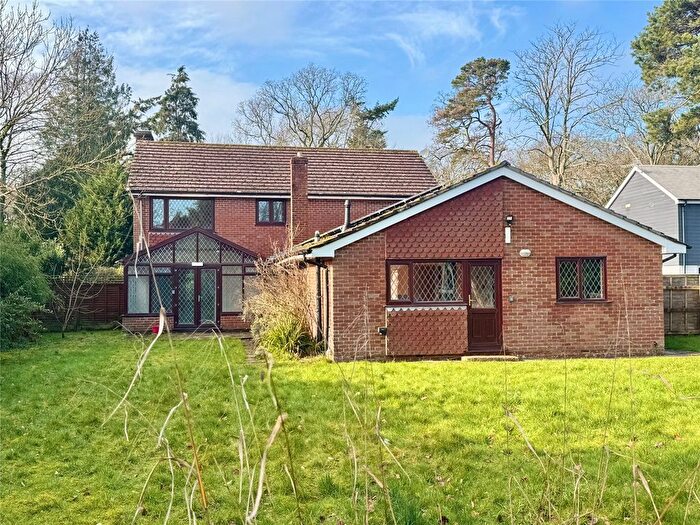
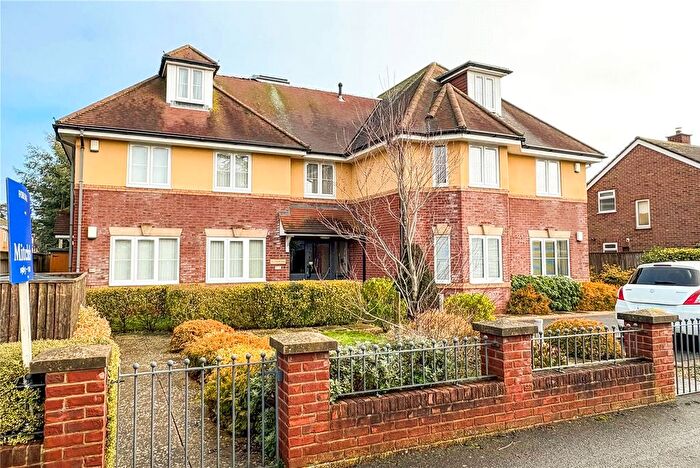
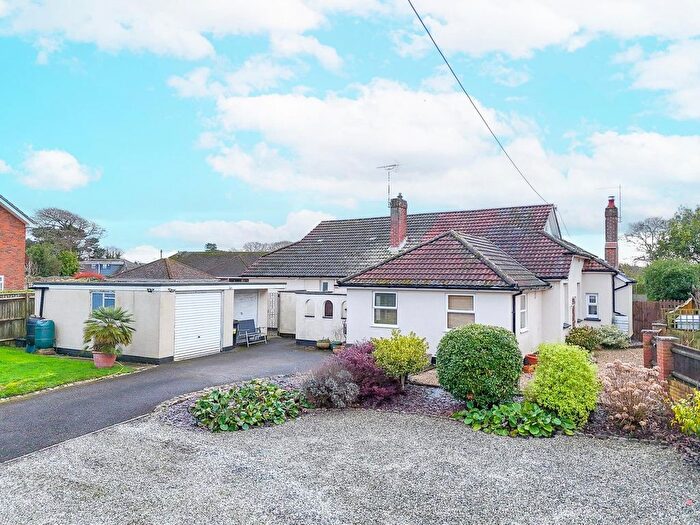
Houses for sale & to rent in Bashley, New Milton
House Prices in Bashley
Properties in Bashley have an average house price of £543,424.00 and had 85 Property Transactions within the last 3 years¹.
Bashley is an area in New Milton, Hampshire with 1,166 households², where the most expensive property was sold for £1,775,000.00.
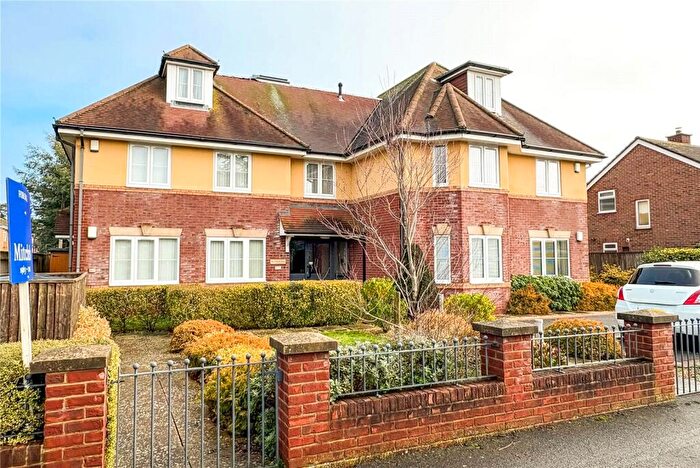
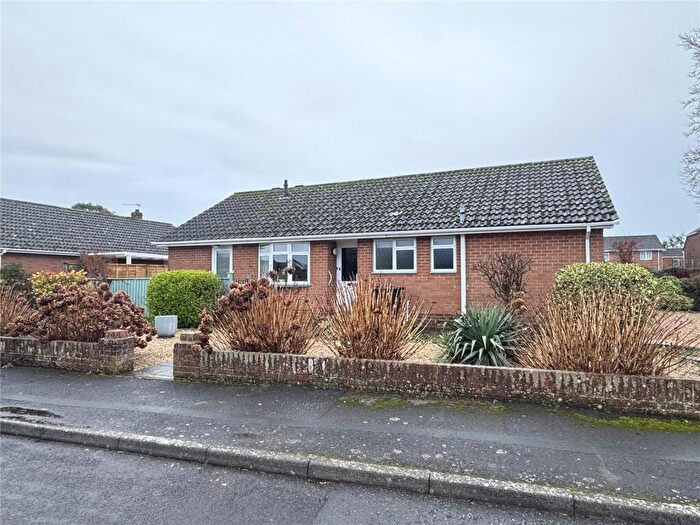
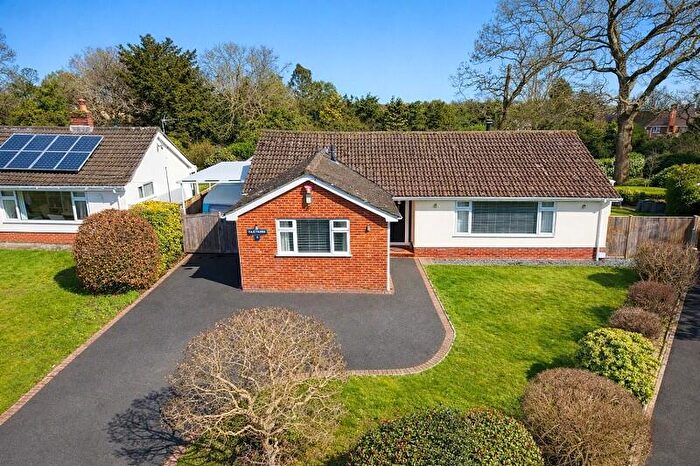
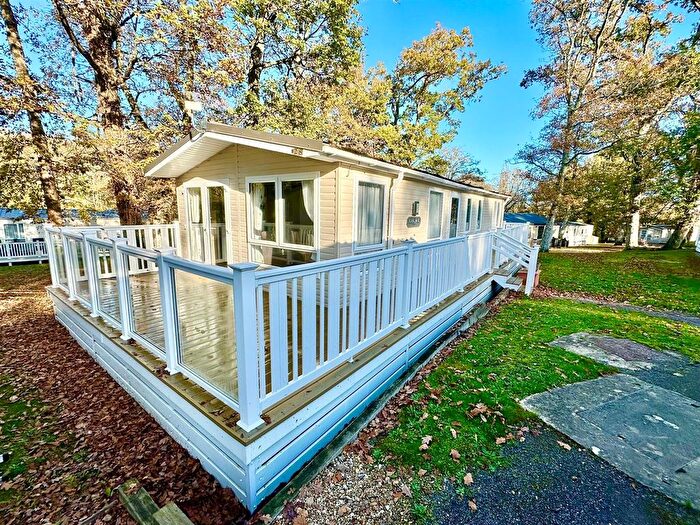
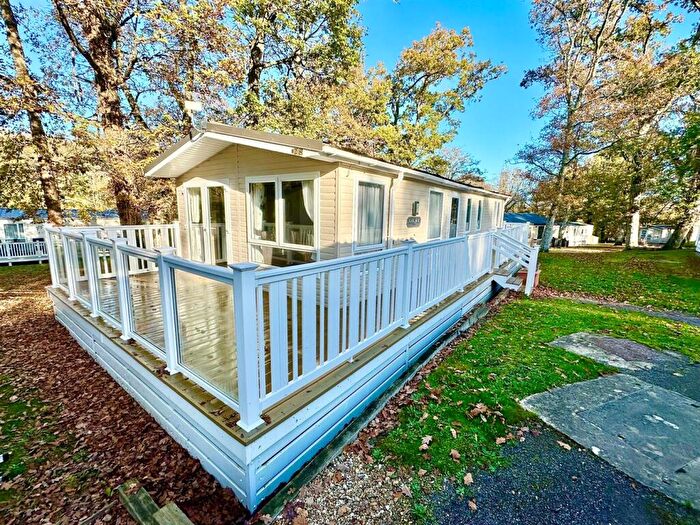
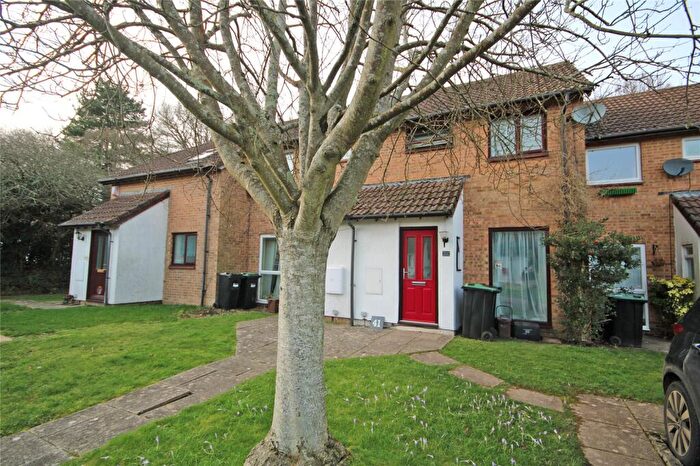
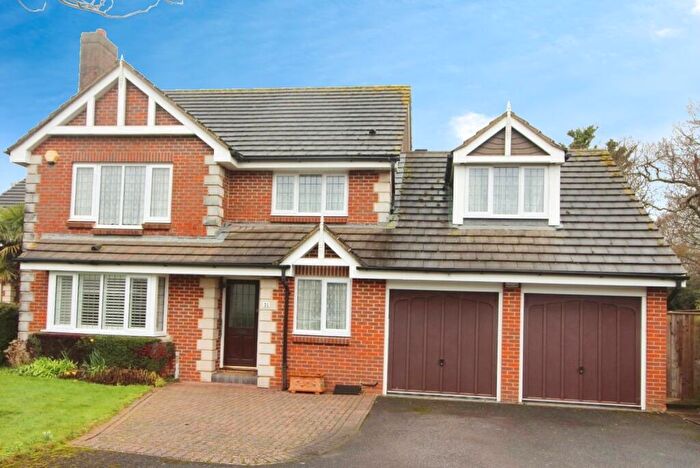
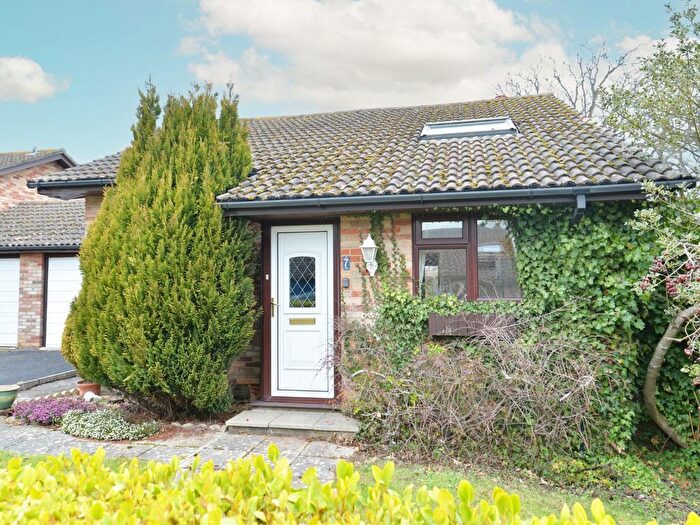
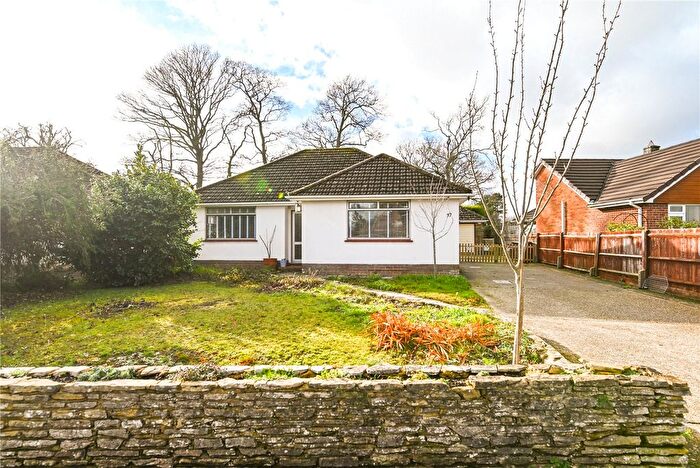
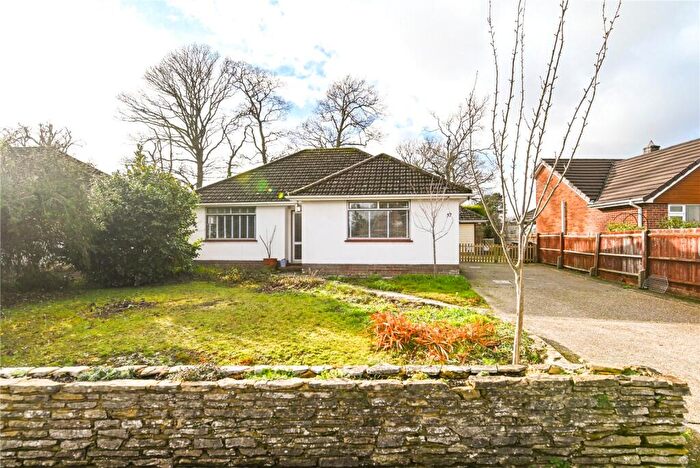
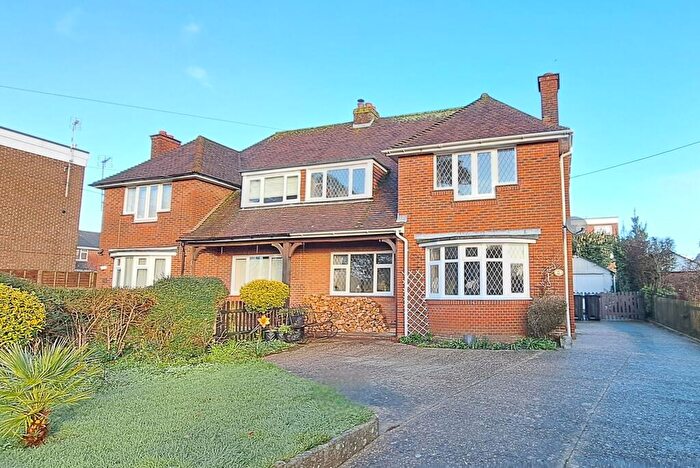
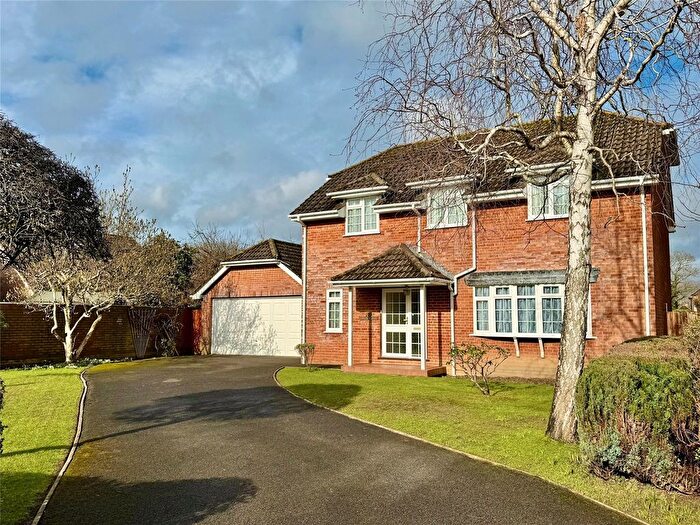
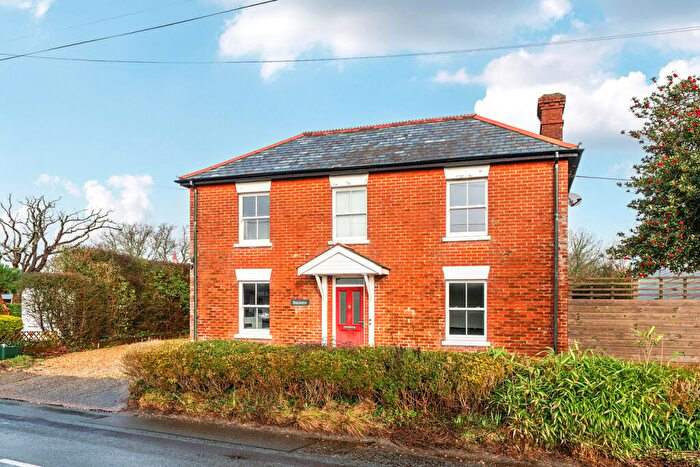
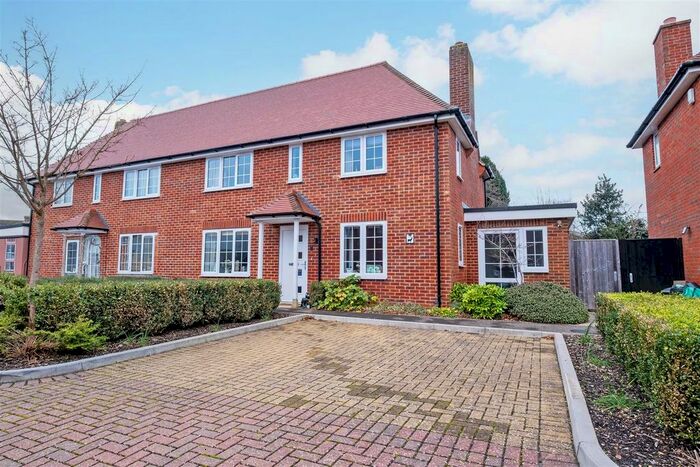
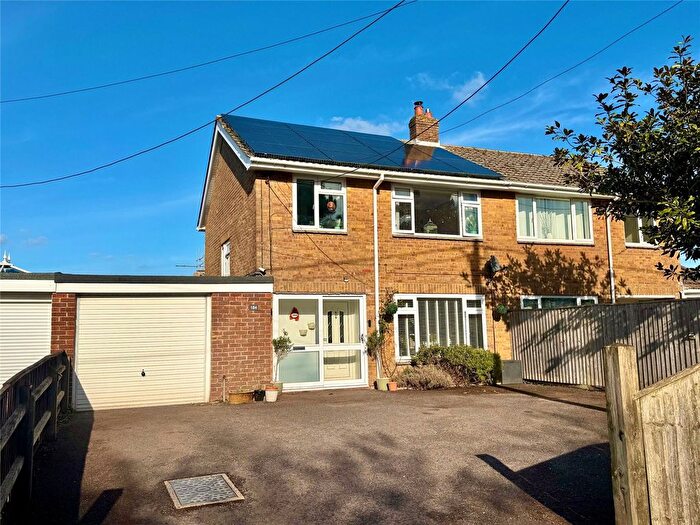
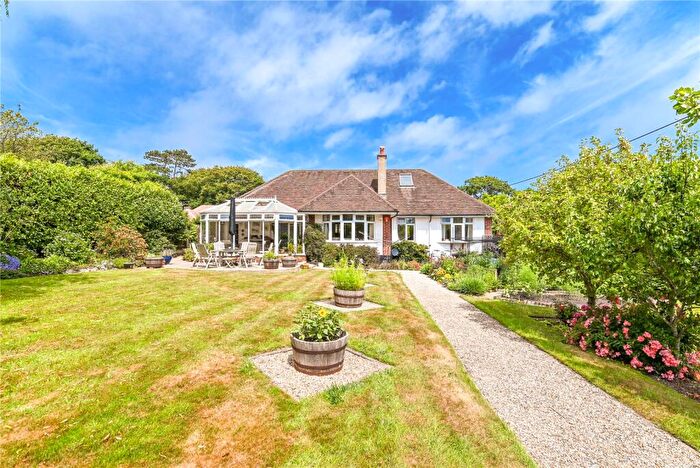
Properties for sale in Bashley
Roads and Postcodes in Bashley
Navigate through our locations to find the location of your next house in Bashley, New Milton for sale or to rent.
| Streets | Postcodes |
|---|---|
| Antler Drive | BH25 5GF BH25 5GG |
| Badgers Copse | BH25 5PE |
| Bashley Common Road | BH25 5SF BH25 5SG BH25 5SH BH25 5SQ |
| Bashley Cross Road | BH25 5SY BH25 5SZ BH25 5TA |
| Bashley Road | BH25 5RX BH25 5RY |
| Beechwood Avenue | BH25 5NB |
| Birch Cottages | BH25 5SW |
| Cabot Way | BH25 5NP |
| Cull Lane | BH25 5QH |
| Deer Park Close | BH25 5GH |
| Deerleap Way | BH25 5EU |
| Doe Copse Way | BH25 5GB BH25 5GN |
| Fawn Gardens | BH25 5GJ |
| Fernhill Lane | BH25 5SU |
| Green Lane | BH25 5TH |
| Harris Way | BH25 5PU |
| Hart Close | BH25 5GL |
| Hazelwood Avenue | BH25 5LX BH25 5LY BH25 5LZ |
| Holmsley Road | BH25 5TP BH25 5TW |
| Kamptee Copse | BH25 5QN |
| Kennard Road | BH25 5JT BH25 5JX |
| Linhorns Lane | BH25 5DQ |
| Marks Lane | BH25 5RZ |
| Marley Avenue | BH25 5LH BH25 5LJ BH25 5LQ |
| Marley Close | BH25 5LL |
| Marlpit Lane | BH25 5SE |
| New Lane | BH25 5TD BH25 5TE |
| North Drive | BH25 5TJ |
| Partridge Green | BH25 5RS |
| Rosecrae Close | BH25 5NJ |
| Rosewood Gardens | BH25 5NA |
| Smithy Lane | BH25 5TF |
| South Drive | BH25 5TL BH25 5TN |
| Spinney Way | BH25 5DN |
| St Johns Road | BH25 5SA BH25 5SB BH25 5SD BH25 5SN |
| Stag Close | BH25 5GD |
| Stem Lane | BH25 5ND BH25 5NF |
| Sway Road | BH25 5QP BH25 5QT BH25 5QU BH25 5RA BH25 5QR BH25 5QS |
| The Hyde | BH25 5GA |
| The Lanes | BH25 5DG |
| Tiptoe Road | BH25 5SJ BH25 5SL |
| Velvet Lawn Road | BH25 5GE |
| Vixen Walk | BH25 5RU |
| Walkford Lane | BH25 5NL BH25 5NH |
| Westwoods Park | BH25 5TB BH25 5TG BH25 5TQ BH25 5ZD |
| Whitley Way | BH25 5ET |
| Woodland Way | BH25 5RT |
| Wootton Rough | BH25 5UA |
Transport near Bashley
- FAQ
- Price Paid By Year
- Property Type Price
Frequently asked questions about Bashley
What is the average price for a property for sale in Bashley?
The average price for a property for sale in Bashley is £543,424. This amount is 22% higher than the average price in New Milton. There are 4,412 property listings for sale in Bashley.
What streets have the most expensive properties for sale in Bashley?
The streets with the most expensive properties for sale in Bashley are Green Lane at an average of £1,775,000, Tiptoe Road at an average of £1,349,000 and Bashley Cross Road at an average of £1,275,000.
What streets have the most affordable properties for sale in Bashley?
The streets with the most affordable properties for sale in Bashley are The Hyde at an average of £277,000, Stag Close at an average of £287,500 and Fawn Gardens at an average of £347,600.
Which train stations are available in or near Bashley?
Some of the train stations available in or near Bashley are New Milton, Sway and Hinton Admiral.
Property Price Paid in Bashley by Year
The average sold property price by year was:
| Year | Average Sold Price | Price Change |
Sold Properties
|
|---|---|---|---|
| 2025 | £570,222 | 14% |
23 Properties |
| 2024 | £492,850 | -15% |
27 Properties |
| 2023 | £564,828 | 6% |
35 Properties |
| 2022 | £531,425 | -3% |
42 Properties |
| 2021 | £547,937 | 13% |
54 Properties |
| 2020 | £474,520 | 13% |
40 Properties |
| 2019 | £414,158 | 11% |
41 Properties |
| 2018 | £369,694 | -20% |
36 Properties |
| 2017 | £444,680 | 1% |
45 Properties |
| 2016 | £440,426 | 15% |
47 Properties |
| 2015 | £373,684 | 1% |
54 Properties |
| 2014 | £368,806 | 12% |
55 Properties |
| 2013 | £325,015 | -9% |
63 Properties |
| 2012 | £353,808 | 19% |
34 Properties |
| 2011 | £286,962 | 16% |
27 Properties |
| 2010 | £240,694 | -11% |
31 Properties |
| 2009 | £267,070 | -24% |
46 Properties |
| 2008 | £331,537 | 8% |
22 Properties |
| 2007 | £304,416 | 4% |
55 Properties |
| 2006 | £292,796 | -8% |
63 Properties |
| 2005 | £317,533 | 10% |
50 Properties |
| 2004 | £286,992 | 21% |
53 Properties |
| 2003 | £226,575 | 7% |
81 Properties |
| 2002 | £210,425 | 15% |
79 Properties |
| 2001 | £177,970 | 18% |
70 Properties |
| 2000 | £146,206 | -1% |
63 Properties |
| 1999 | £147,098 | 17% |
89 Properties |
| 1998 | £122,626 | 18% |
67 Properties |
| 1997 | £100,896 | 3% |
138 Properties |
| 1996 | £98,312 | -1% |
116 Properties |
| 1995 | £99,551 | - |
85 Properties |
Property Price per Property Type in Bashley
Here you can find historic sold price data in order to help with your property search.
The average Property Paid Price for specific property types in the last three years are:
| Property Type | Average Sold Price | Sold Properties |
|---|---|---|
| Semi Detached House | £410,378.00 | 16 Semi Detached Houses |
| Detached House | £621,293.00 | 58 Detached Houses |
| Terraced House | £326,363.00 | 11 Terraced Houses |

