
Houses for sale & to rent in Petersfield, Hampshire
House Prices in Petersfield
Properties in Petersfield have an average house price of £563k and had 760 Property Transactions within the last 3 years.¹
Petersfield is an area in Hampshire with 8,551 households², where the most expensive property was sold for £5M.
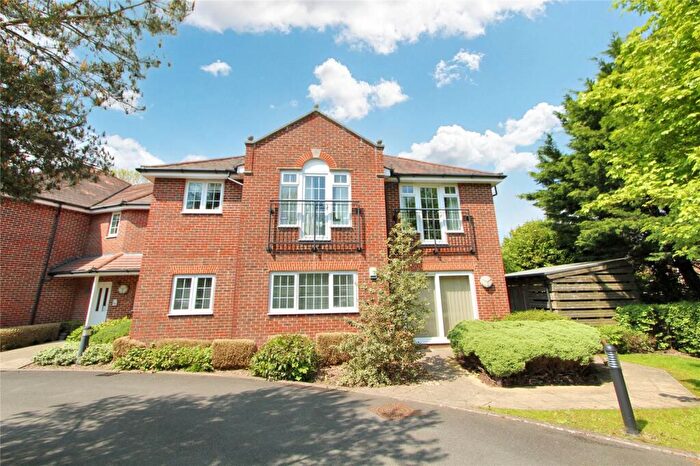
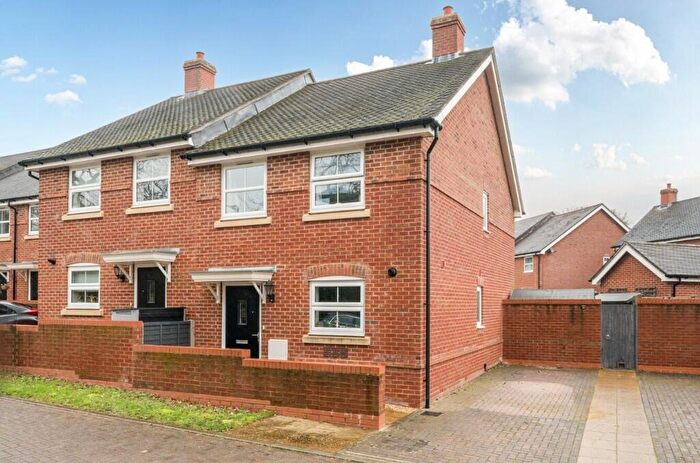
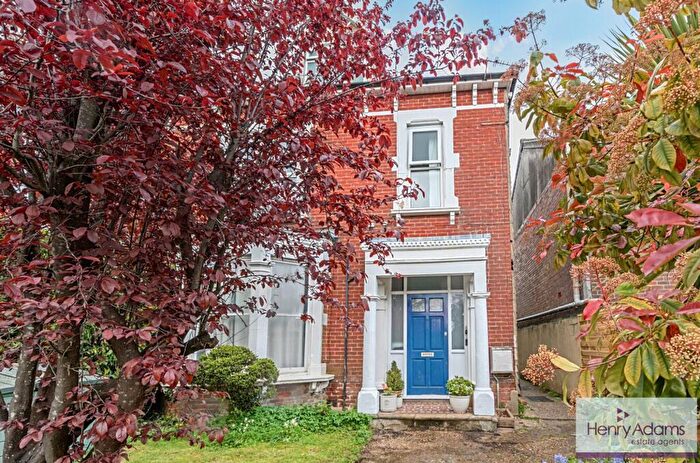
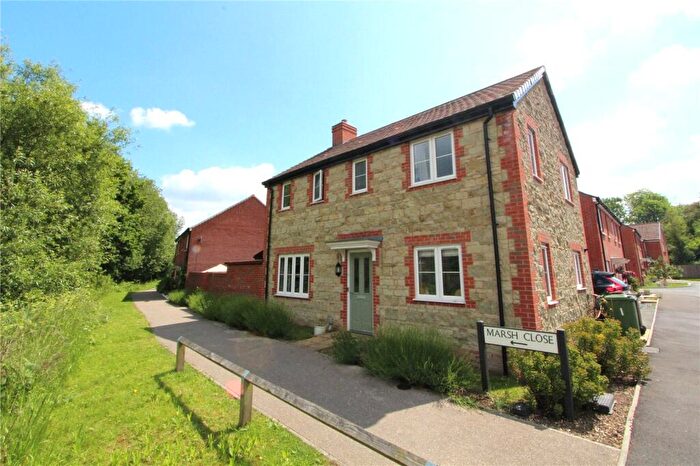
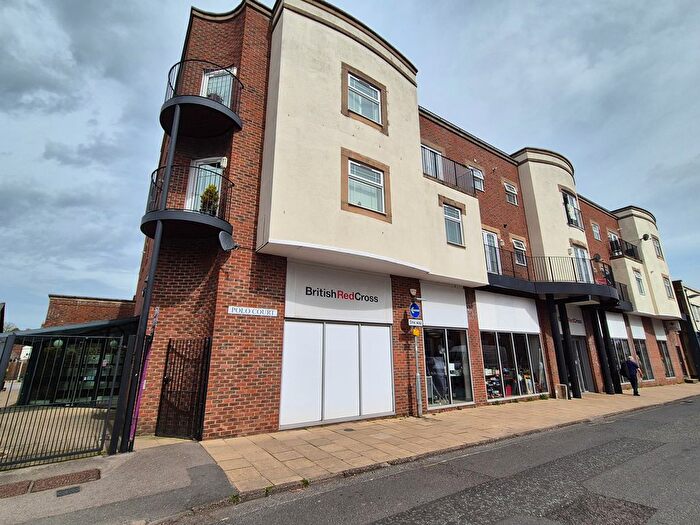
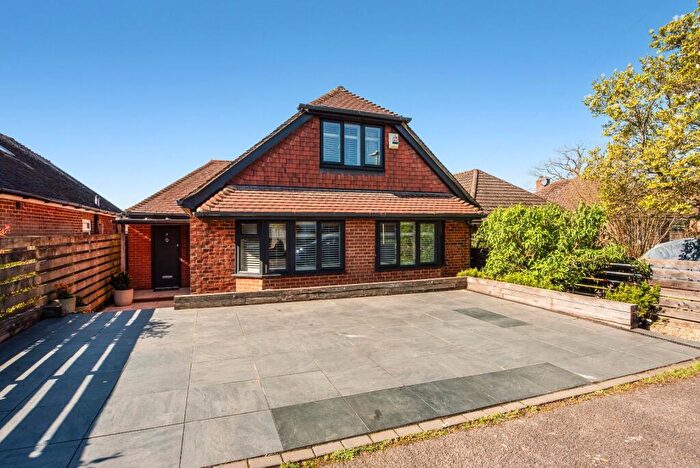
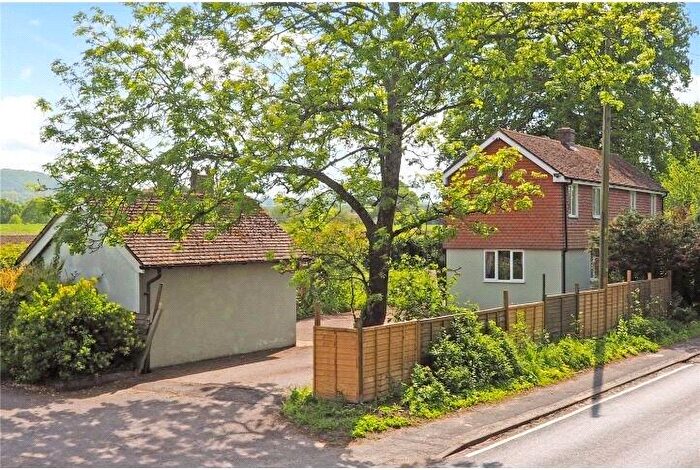
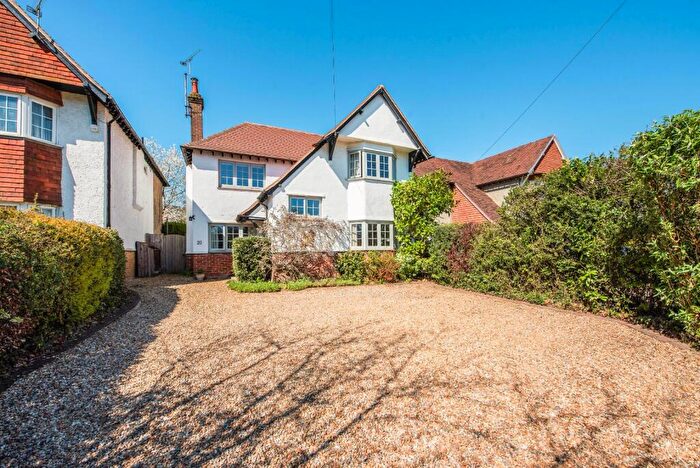
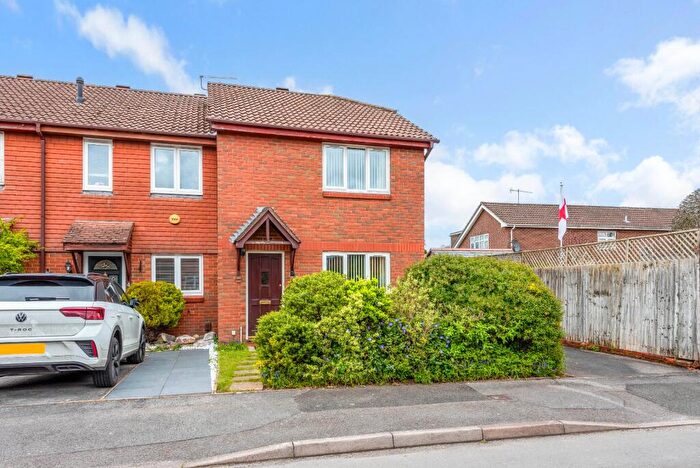
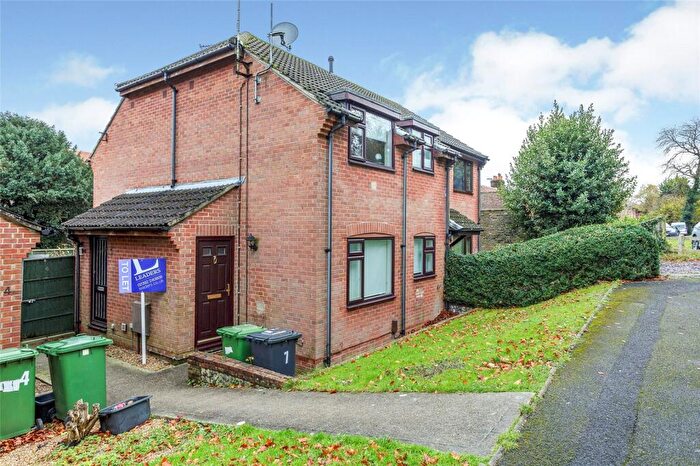
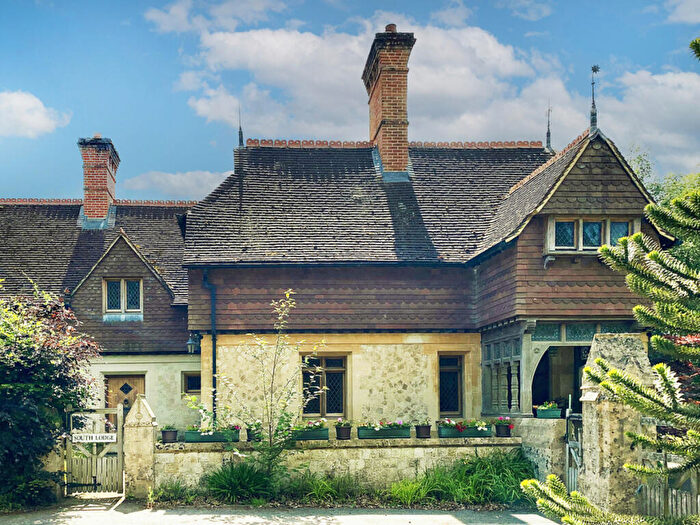
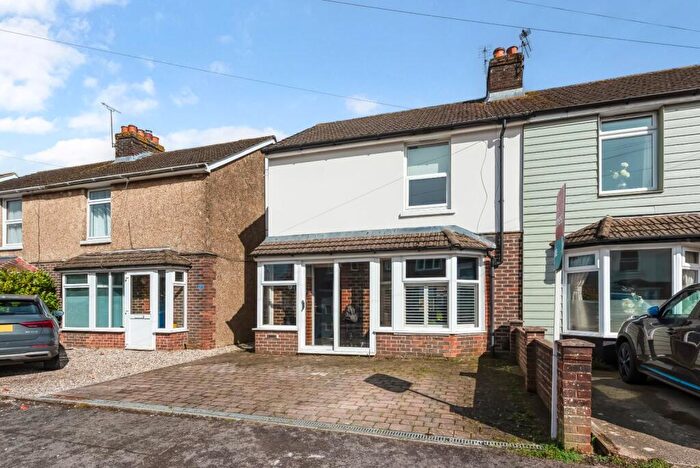
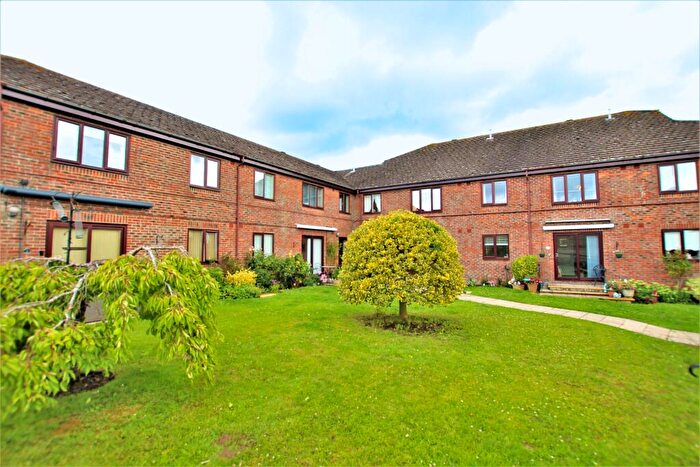
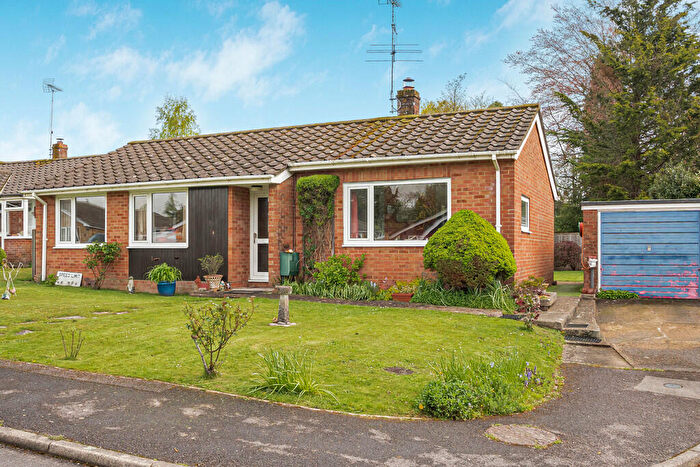
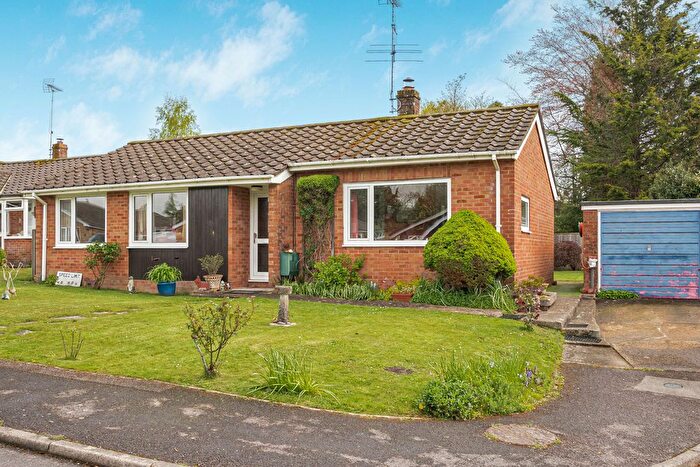
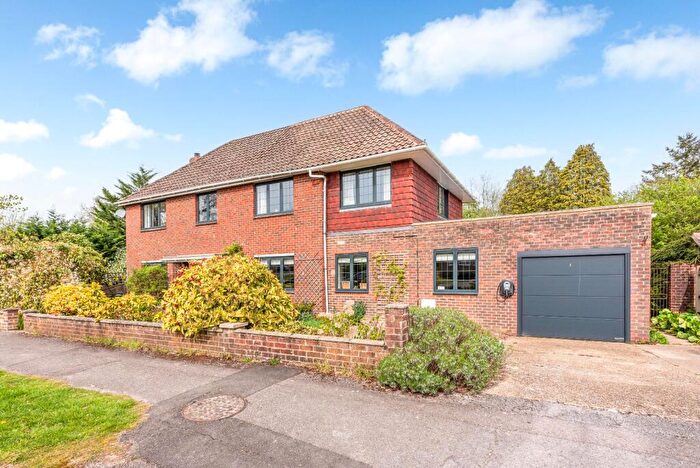
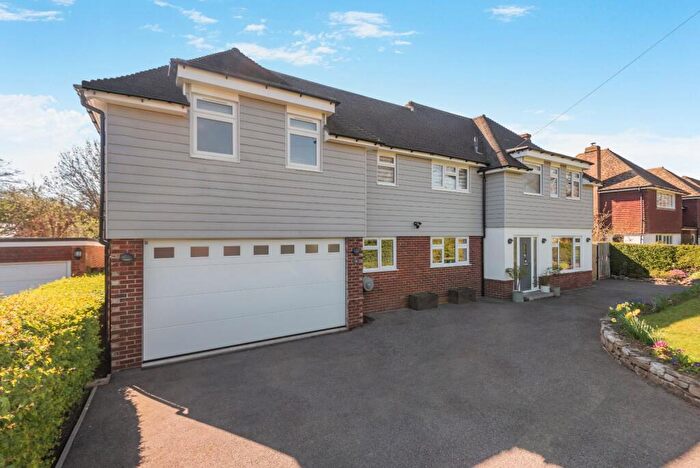
Properties for sale in Petersfield

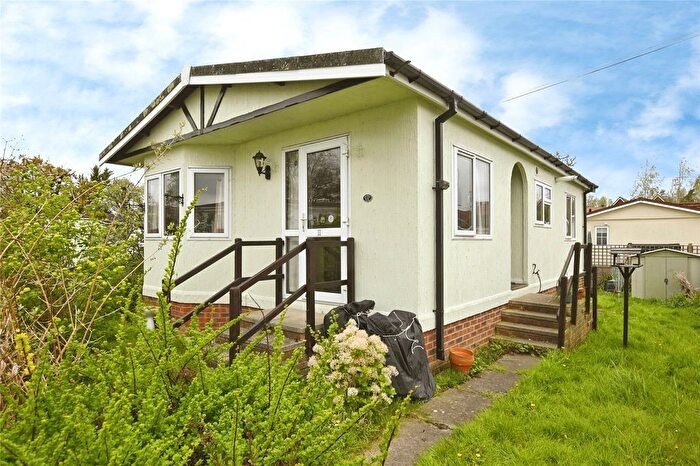
![]()
If you are looking to sell your house, let it out, or receive a property valuation, an expert can help you.
Click the button below to get started.
Neighbourhoods in Petersfield
Navigate through our locations to find the location of your next house in Petersfield, Hampshire for sale or to rent.
Transport in Petersfield
Please see below transportation links in this area:

- FAQ
- Price Paid By Year
- Property Type Price
Frequently asked questions about Petersfield
What is the average price for a property for sale in Petersfield?
The average price for a property for sale in Petersfield is £562,813. This amount is 34% higher than the average price in Hampshire. There are 6,200 property listings for sale in Petersfield.
What locations have the most expensive properties for sale in Petersfield?
The locations with the most expensive properties for sale in Petersfield are Ropley, Hawkley & Hangers at an average of £3,000,000, Buriton & East Meon at an average of £2,026,666 and Liss at an average of £1,267,500.
What locations have the most affordable properties for sale in Petersfield?
The locations with the most affordable properties for sale in Petersfield are Petersfield St Peters at an average of £372,974, Petersfield Causeway at an average of £445,946 and Petersfield Bell Hill at an average of £455,751.
Which train stations are available in or near Petersfield?
Some of the train stations available in or near Petersfield are Petersfield, Liss and Rowland's Castle.
Property Price Paid in Petersfield by Year
The average sold property price by year was:
| Year | Average Sold Price | Price Change |
Sold Properties
|
|---|---|---|---|
| 2026 | £515,833 | 1% |
3 Properties |
| 2025 | £510,698 | -12% |
237 Properties |
| 2024 | £572,948 | -5% |
289 Properties |
| 2023 | £604,212 | 4% |
231 Properties |
| 2022 | £578,247 | 6% |
289 Properties |
| 2021 | £546,012 | 13% |
404 Properties |
| 2020 | £476,474 | -2% |
307 Properties |
| 2019 | £484,987 | 3% |
346 Properties |
| 2018 | £472,133 | 5% |
330 Properties |
| 2017 | £448,557 | - |
341 Properties |
| 2016 | £448,706 | 13% |
339 Properties |
| 2015 | £392,238 | 3% |
347 Properties |
| 2014 | £380,634 | 7% |
409 Properties |
| 2013 | £354,725 | 8% |
340 Properties |
| 2012 | £327,370 | -11% |
302 Properties |
| 2011 | £362,562 | 4% |
298 Properties |
| 2010 | £349,206 | 16% |
295 Properties |
| 2009 | £292,186 | -12% |
281 Properties |
| 2008 | £326,739 | 3% |
225 Properties |
| 2007 | £316,140 | 1% |
413 Properties |
| 2006 | £314,539 | 14% |
429 Properties |
| 2005 | £269,697 | -0,2% |
479 Properties |
| 2004 | £270,249 | 8% |
461 Properties |
| 2003 | £248,608 | 8% |
410 Properties |
| 2002 | £229,146 | 13% |
395 Properties |
| 2001 | £200,365 | 19% |
423 Properties |
| 2000 | £162,206 | 1% |
420 Properties |
| 1999 | £159,954 | 29% |
477 Properties |
| 1998 | £113,656 | 5% |
402 Properties |
| 1997 | £108,525 | 8% |
362 Properties |
| 1996 | £100,349 | 4% |
411 Properties |
| 1995 | £96,736 | - |
359 Properties |
Property Price per Property Type in Petersfield
Here you can find historic sold price data in order to help with your property search.
The average Property Paid Price for specific property types in the last three years are:
| Property Type | Average Sold Price | Sold Properties |
|---|---|---|
| Semi Detached House | £499,976.00 | 187 Semi Detached Houses |
| Detached House | £930,879.00 | 234 Detached Houses |
| Terraced House | £411,695.00 | 195 Terraced Houses |
| Flat | £250,945.00 | 144 Flats |