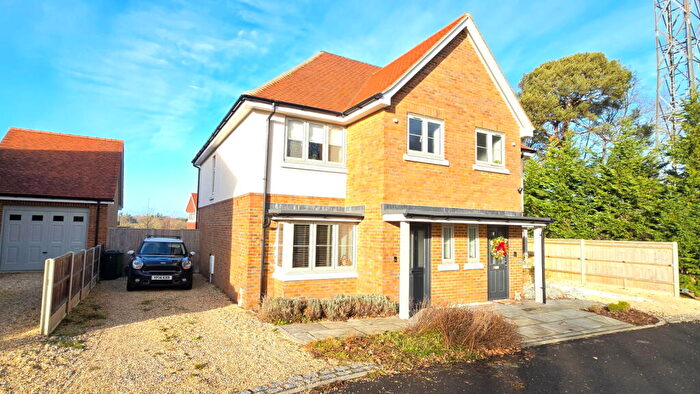
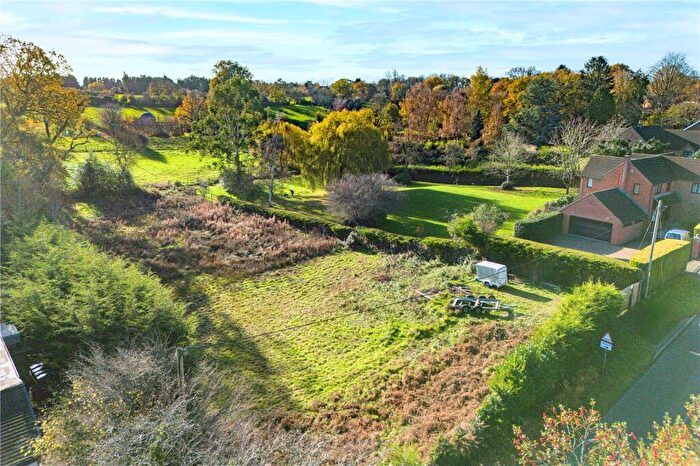
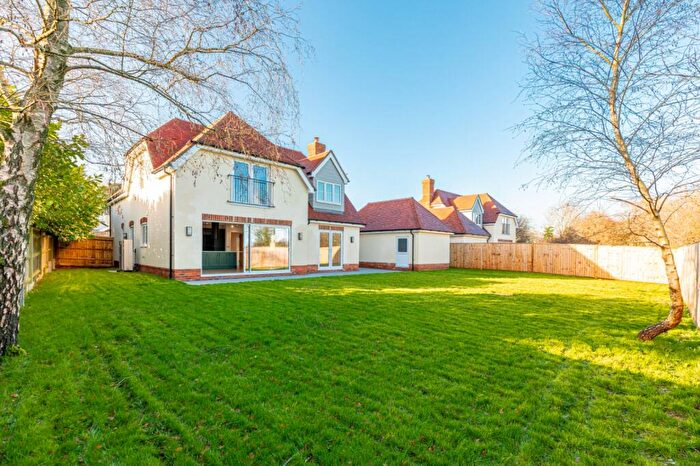
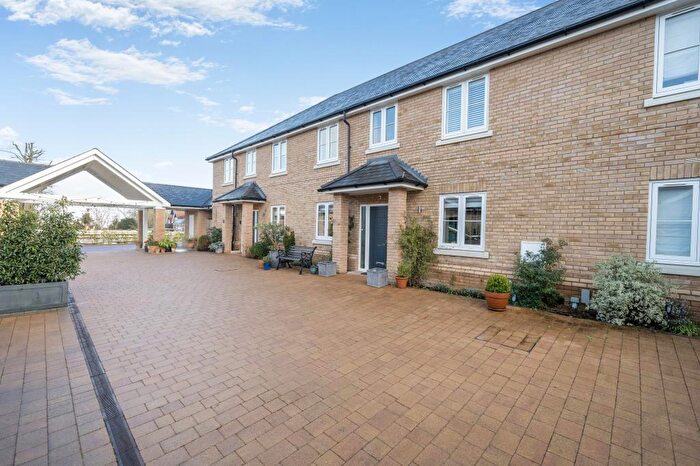
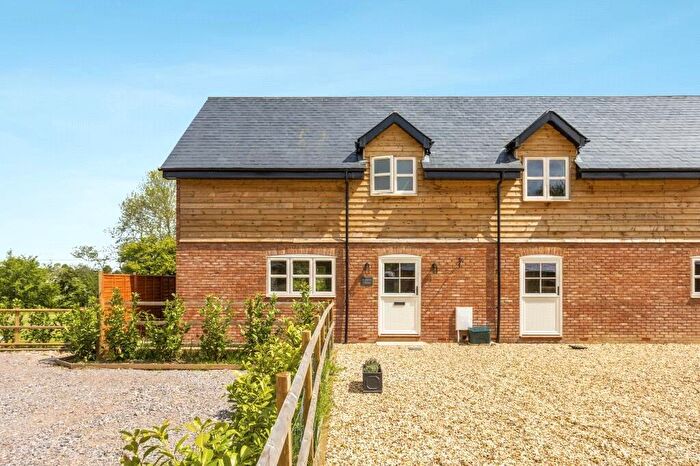
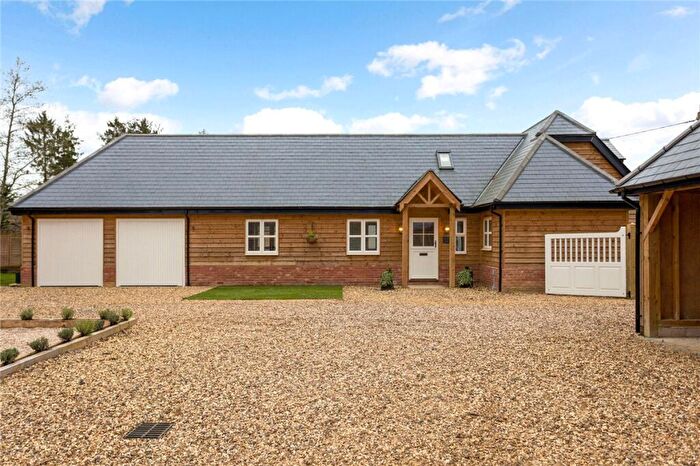
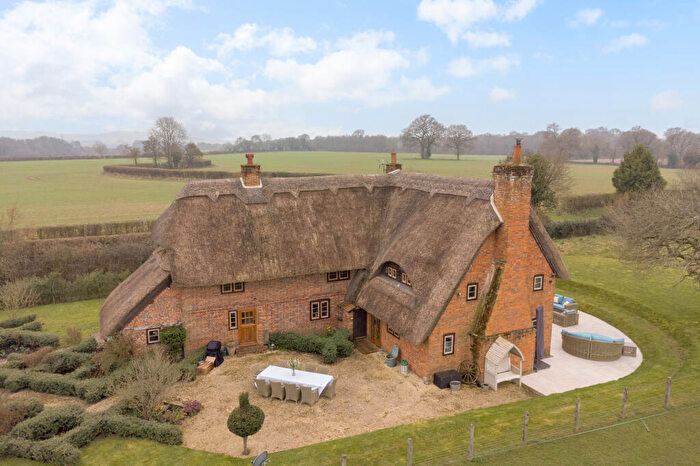
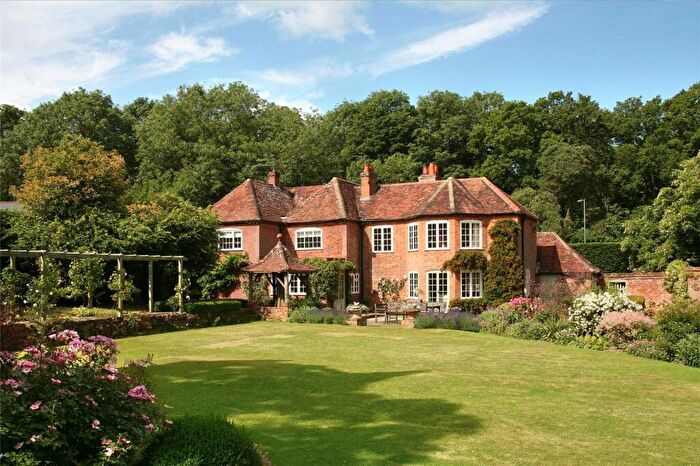
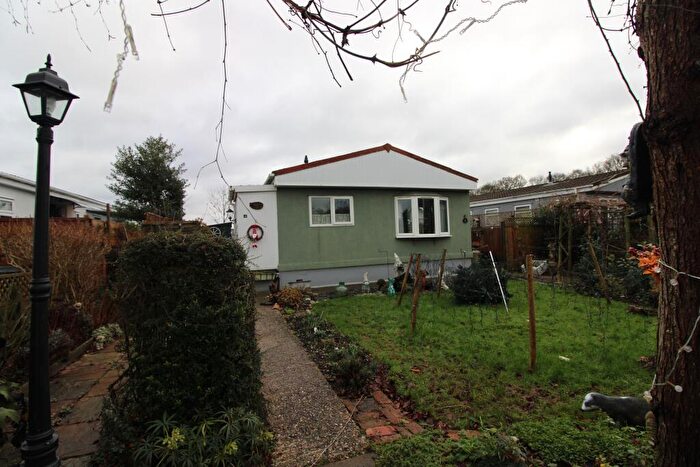
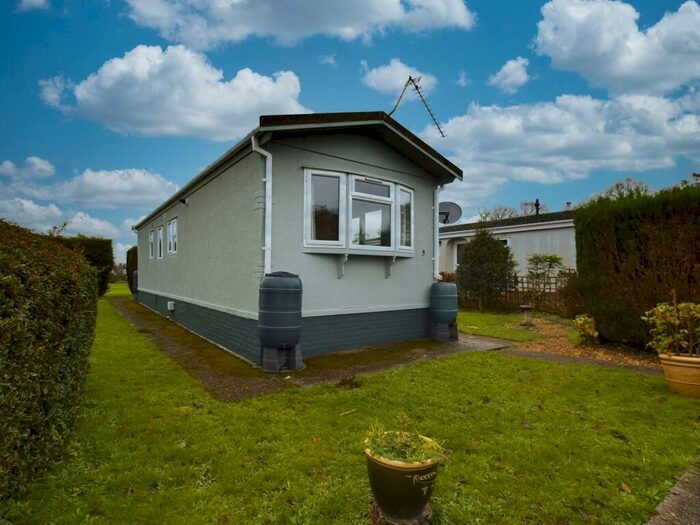
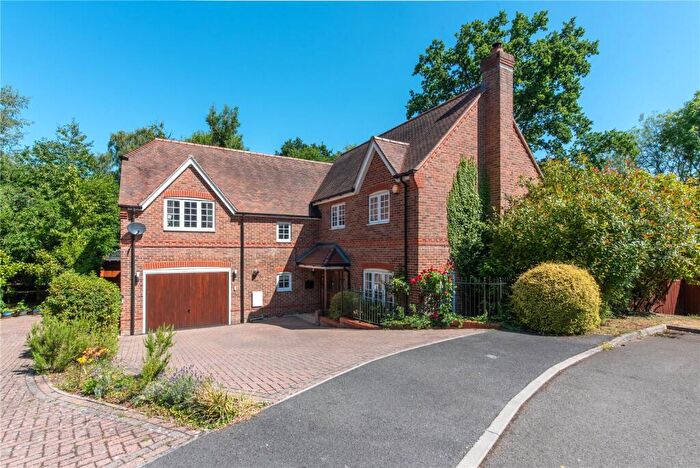
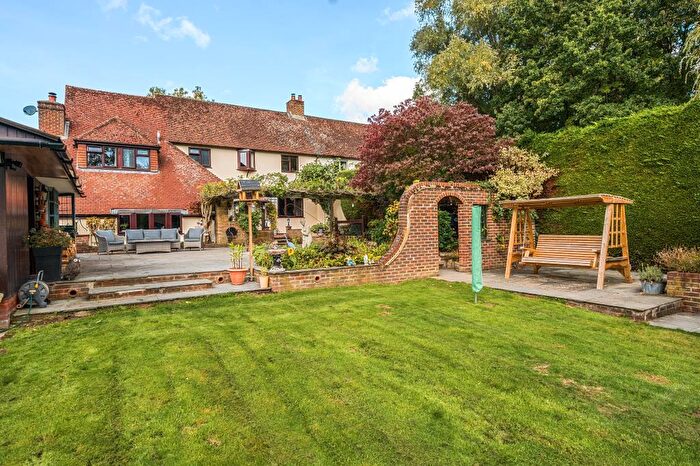
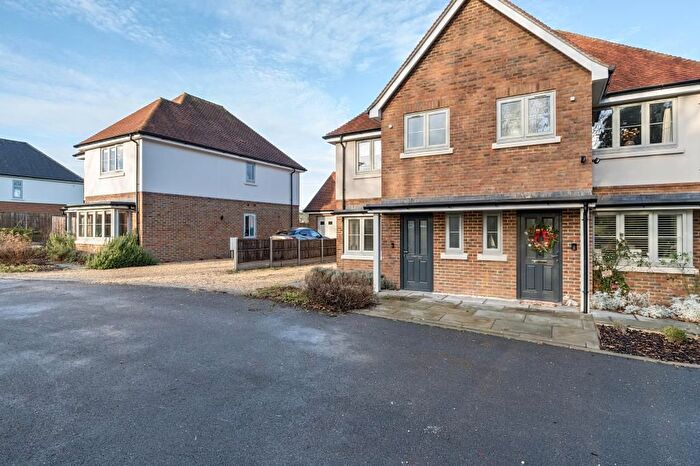
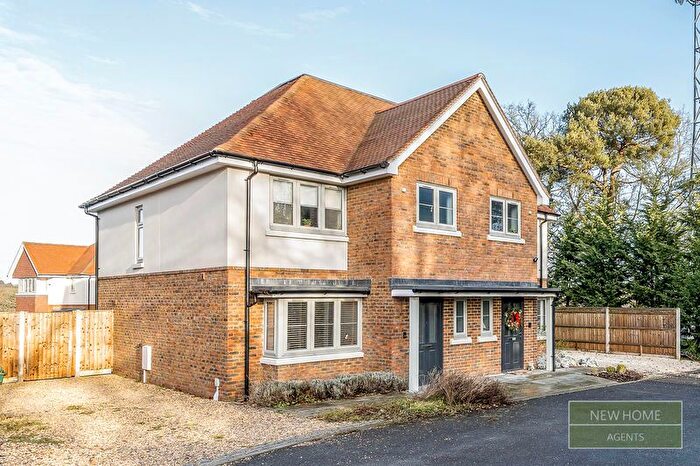
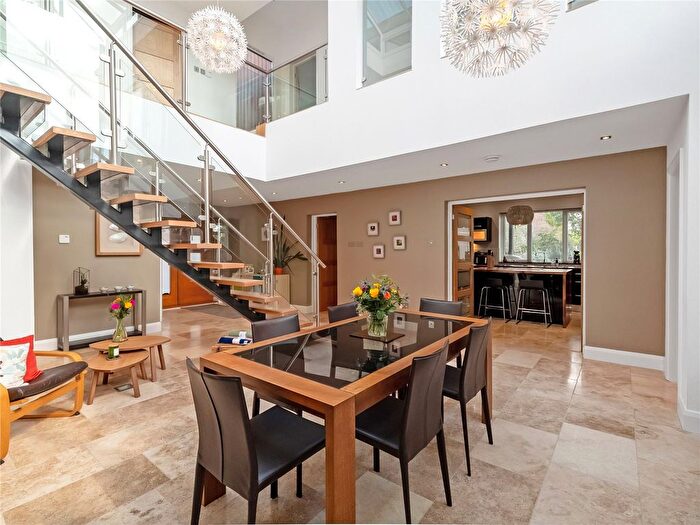
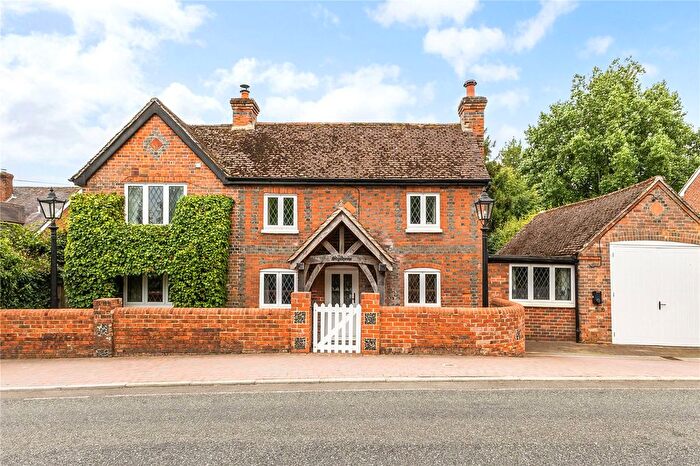
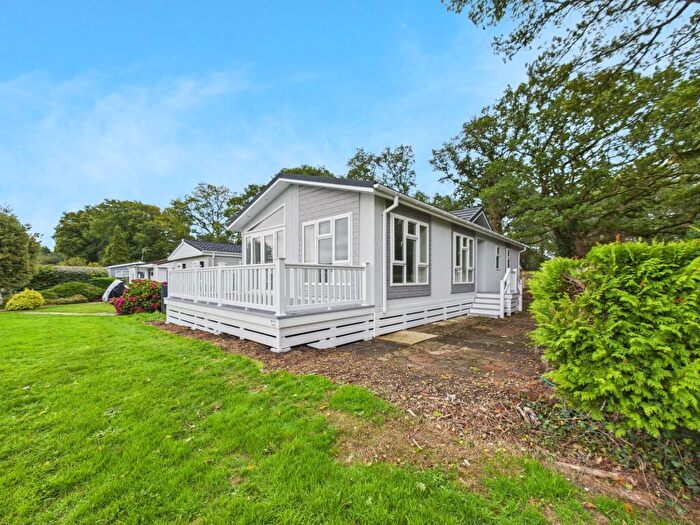
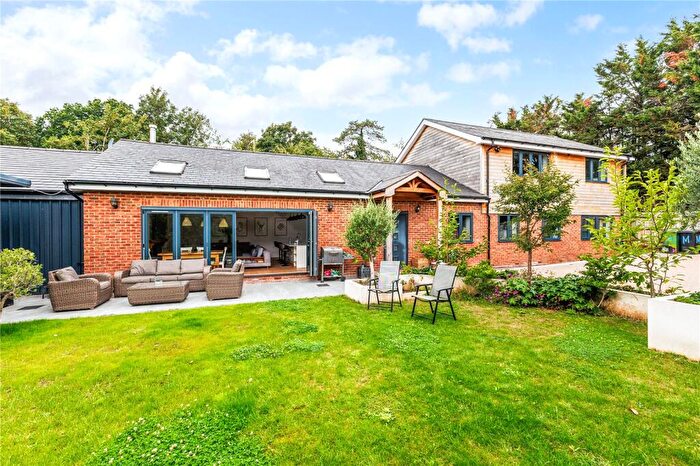
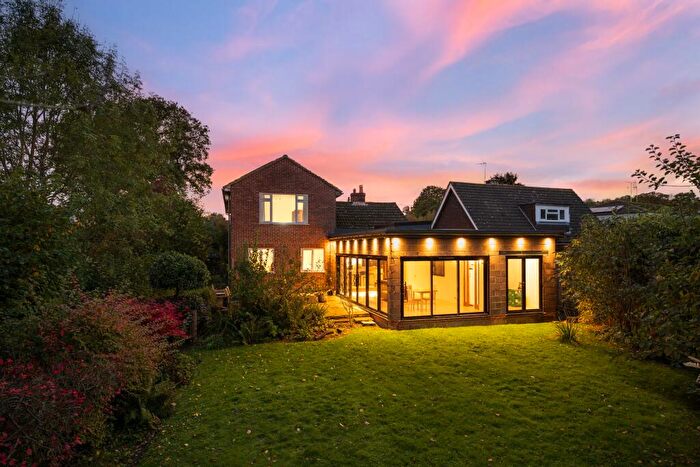
Houses for sale & to rent in Kingsclere, Thatcham
House Prices in Kingsclere
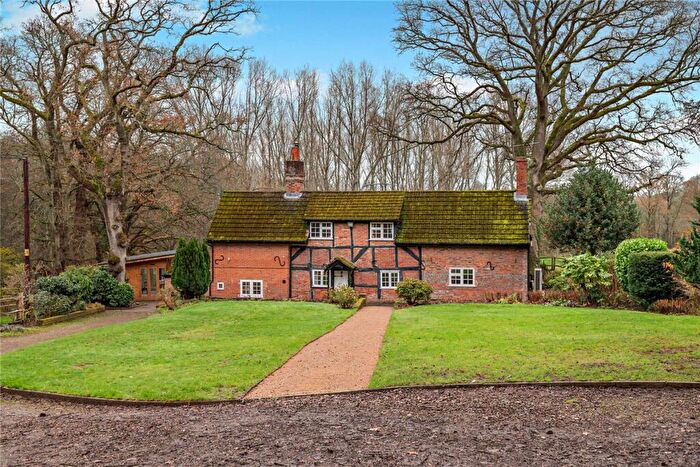
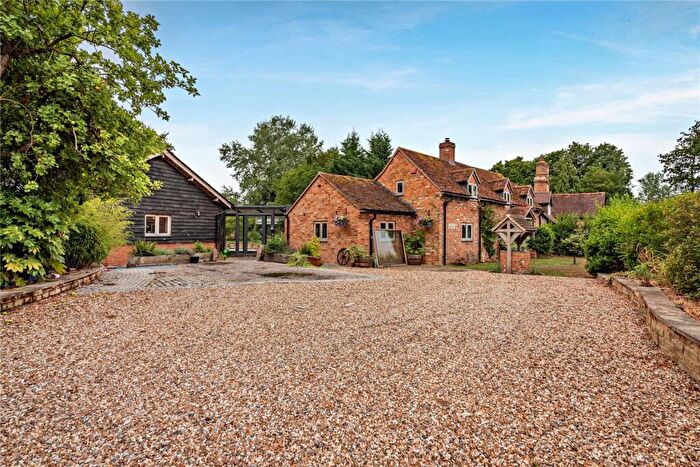
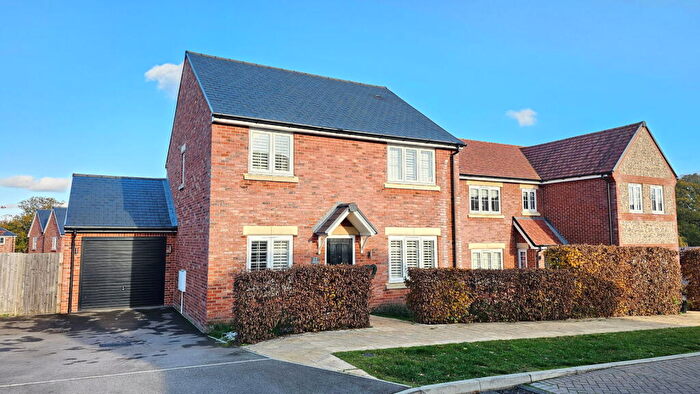
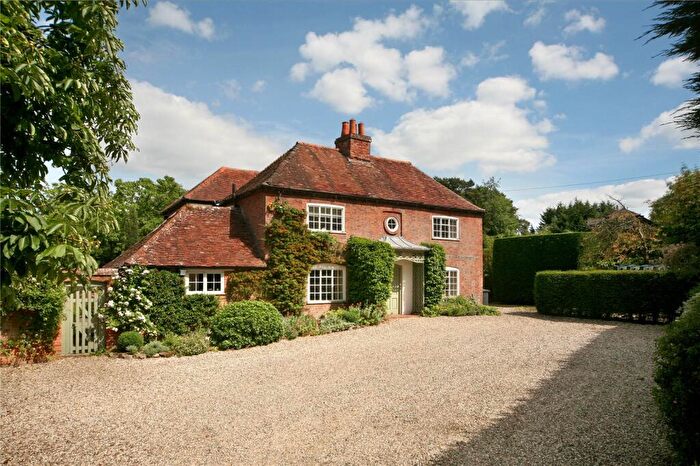
Properties in Kingsclere have an average house price of £782,982.00 and had 31 Property Transactions within the last 3 years¹.
Kingsclere is an area in Thatcham, Hampshire with 423 households², where the most expensive property was sold for £4,000,000.00.
Properties for sale in Kingsclere
Previously listed properties in Kingsclere
Roads and Postcodes in Kingsclere
Navigate through our locations to find the location of your next house in Kingsclere, Thatcham for sale or to rent.
| Streets | Postcodes |
|---|---|
| Ashford Hill | RG19 8AX RG19 8BA RG19 8BJ RG19 8BL RG19 8BN RG19 8BQ |
| Ashford Hill Road | RG19 8AA RG19 8AB RG19 8AJ RG19 8AP RG19 8BB RG19 8BD |
| Benham Lane | RG19 8FG |
| Chapel Lane | RG19 8BE |
| Common Road | RG19 8LS RG19 8LT |
| Evergreen | RG19 8ES |
| Goose Hill | RG19 8AS RG19 8AT RG19 8AU |
| Harrow Drive | RG19 8FH |
| Holdrop Hill | RG19 8LJ |
| Hollycroft | RG19 8BU |
| Holt Cottages | RG19 8BH |
| Knightsbridge Drive | RG19 8JZ |
| Millgreen Lane | RG19 8AN |
| Newbury Road | RG19 8JX RG19 8JY RG19 8LA RG19 8LE RG19 8LF RG19 8LG RG19 8LQ |
| Old Lane | RG19 8BG |
| Paynes Close | RG19 8LY |
| Plastow Green | RG19 8LN RG19 8LP RG19 8LW |
| Ram Alley | RG19 8AY |
| St Peters Close | RG19 8AE |
| Swaits Meadow | RG19 8BT |
| The Cedars | RG19 8FE |
| Thornfield | RG19 8AQ |
| Thornford Road | RG19 8AD RG19 8AG RG19 8AH |
| Union Lane | RG19 8LR |
| RG19 8LL |
Transport near Kingsclere
- FAQ
- Price Paid By Year
- Property Type Price
Frequently asked questions about Kingsclere
What is the average price for a property for sale in Kingsclere?
The average price for a property for sale in Kingsclere is £782,982. This amount is 1% higher than the average price in Thatcham. There are 119 property listings for sale in Kingsclere.
What streets have the most expensive properties for sale in Kingsclere?
The streets with the most expensive properties for sale in Kingsclere are Millgreen Lane at an average of £4,000,000, Ashford Hill at an average of £1,405,666 and Ram Alley at an average of £1,125,000.
What streets have the most affordable properties for sale in Kingsclere?
The streets with the most affordable properties for sale in Kingsclere are Swaits Meadow at an average of £390,000, Harrow Drive at an average of £399,625 and Holt Cottages at an average of £485,000.
Which train stations are available in or near Kingsclere?
Some of the train stations available in or near Kingsclere are Thatcham, Midgham and Newbury Racecourse.
Property Price Paid in Kingsclere by Year
The average sold property price by year was:
| Year | Average Sold Price | Price Change |
Sold Properties
|
|---|---|---|---|
| 2025 | £931,166 | 39% |
15 Properties |
| 2024 | £565,661 | -32% |
9 Properties |
| 2023 | £744,857 | -14% |
7 Properties |
| 2022 | £847,928 | 7% |
16 Properties |
| 2021 | £786,022 | 15% |
22 Properties |
| 2020 | £666,064 | 20% |
17 Properties |
| 2019 | £532,944 | -21% |
9 Properties |
| 2018 | £646,246 | 7% |
14 Properties |
| 2017 | £598,375 | 1% |
16 Properties |
| 2016 | £594,645 | 25% |
10 Properties |
| 2015 | £443,447 | -4% |
21 Properties |
| 2014 | £463,068 | -111% |
29 Properties |
| 2013 | £977,778 | 52% |
7 Properties |
| 2012 | £472,544 | -12% |
17 Properties |
| 2011 | £530,666 | 21% |
6 Properties |
| 2010 | £418,126 | 3% |
19 Properties |
| 2009 | £406,653 | -14% |
13 Properties |
| 2008 | £462,023 | -4% |
15 Properties |
| 2007 | £479,317 | 38% |
28 Properties |
| 2006 | £298,044 | -54% |
19 Properties |
| 2005 | £459,660 | -9% |
19 Properties |
| 2004 | £500,236 | 16% |
19 Properties |
| 2003 | £419,799 | 17% |
15 Properties |
| 2002 | £350,129 | 6% |
24 Properties |
| 2001 | £330,150 | -9% |
20 Properties |
| 2000 | £359,339 | 41% |
17 Properties |
| 1999 | £213,328 | -3% |
17 Properties |
| 1998 | £220,668 | 19% |
16 Properties |
| 1997 | £178,987 | 16% |
20 Properties |
| 1996 | £150,961 | -22% |
13 Properties |
| 1995 | £184,099 | - |
10 Properties |
Property Price per Property Type in Kingsclere
Here you can find historic sold price data in order to help with your property search.
The average Property Paid Price for specific property types in the last three years are:
| Property Type | Average Sold Price | Sold Properties |
|---|---|---|
| Semi Detached House | £479,245.00 | 10 Semi Detached Houses |
| Detached House | £1,034,444.00 | 18 Detached Houses |
| Terraced House | £343,750.00 | 2 Terraced Houses |
| Flat | £172,500.00 | 1 Flat |

