
Houses for sale & to rent in Muswell Hill, London
House Prices in Muswell Hill
Properties in this part of Muswell Hill within London have an average house price of £1,063,665.00 and had 368 Property Transactions within the last 3 years¹. This area has 4,524 households² , where the most expensive property was sold for £4,390,000.00.
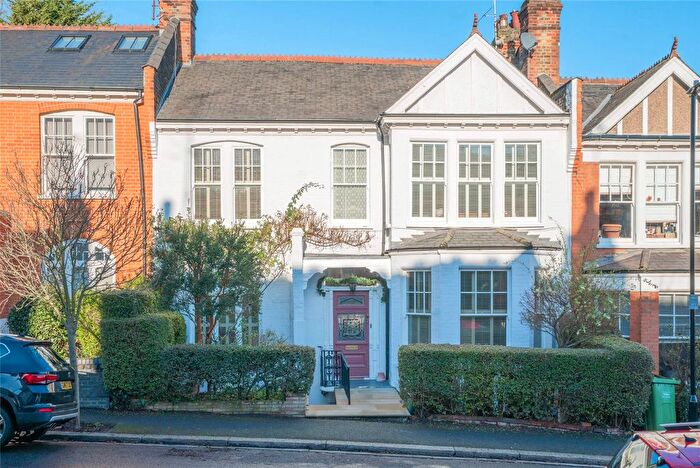
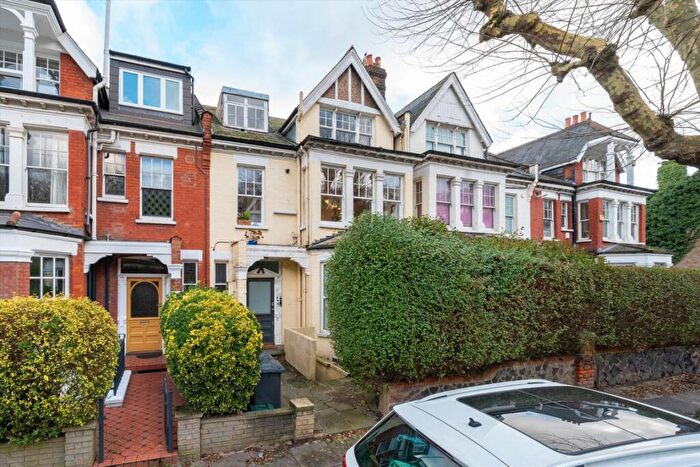
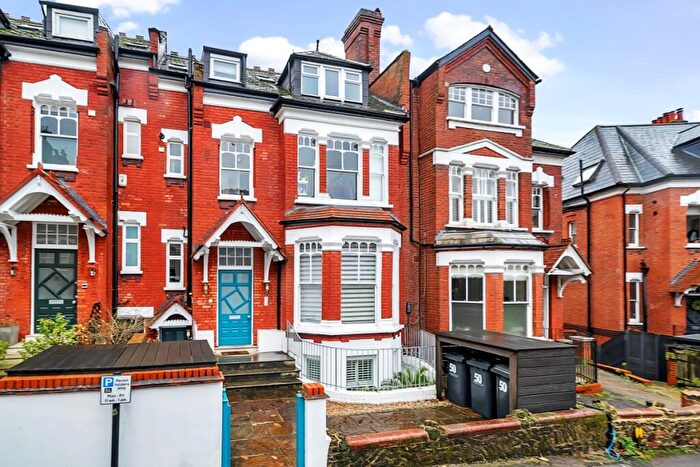
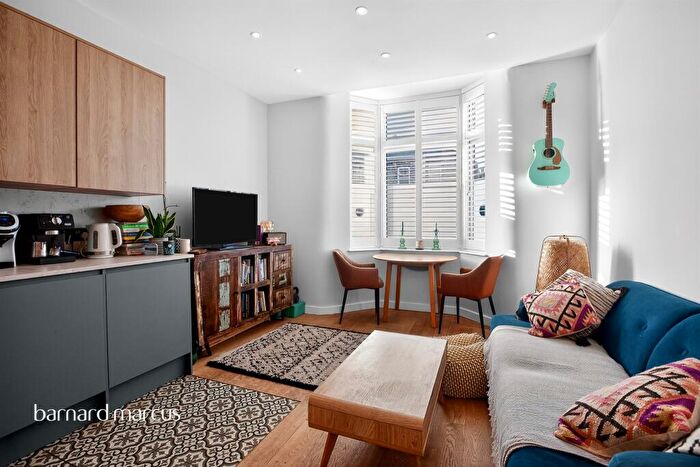
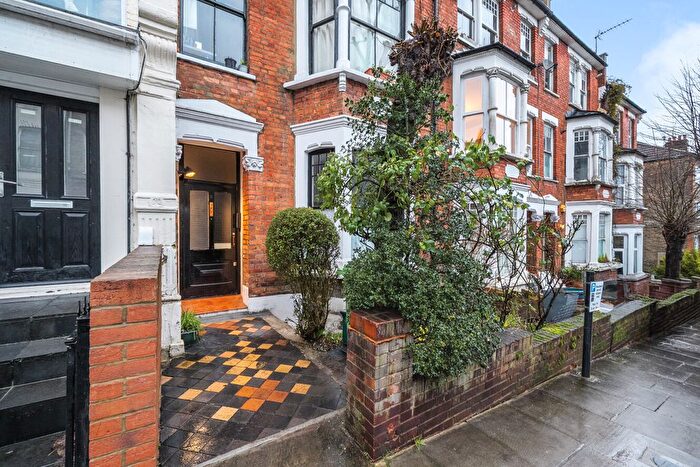
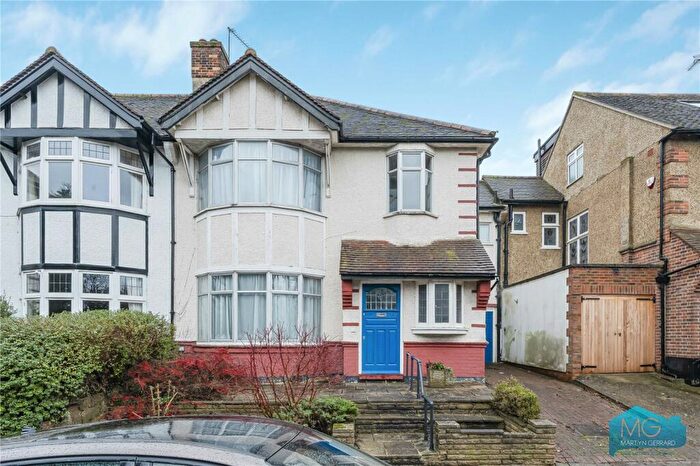
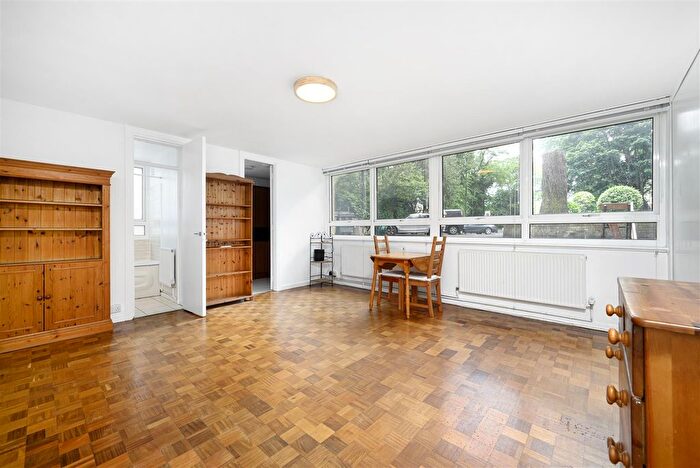
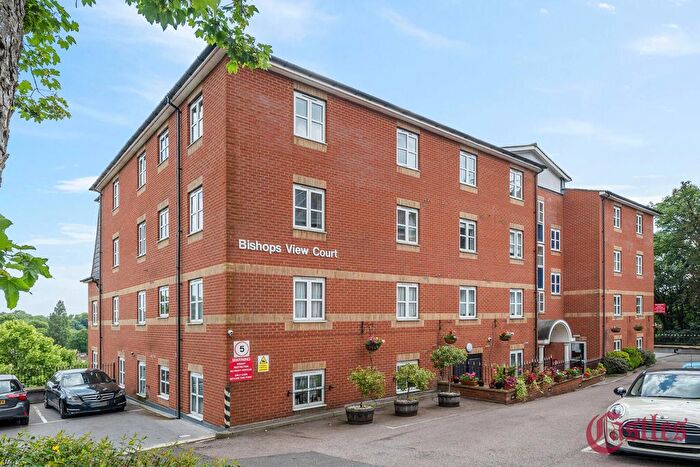
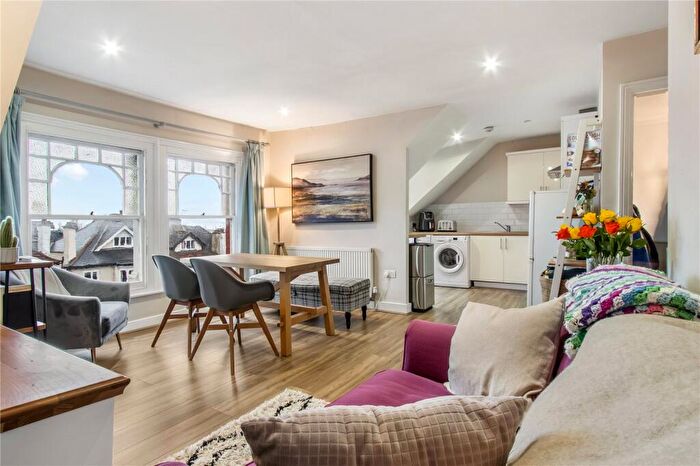
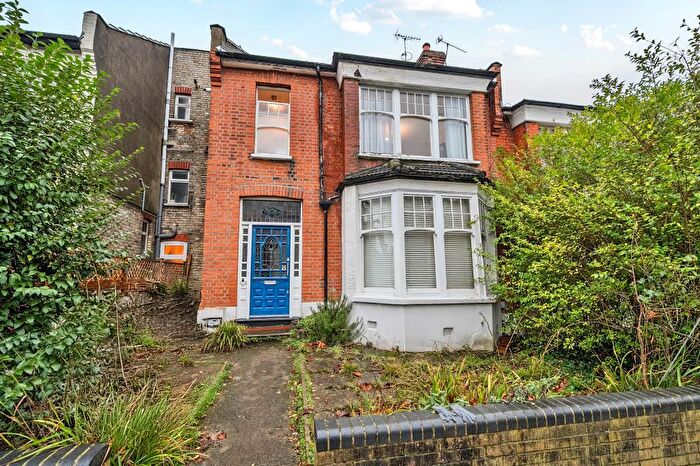
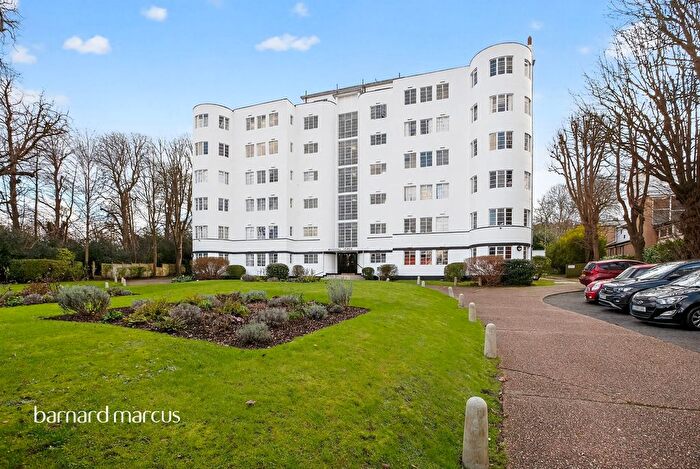
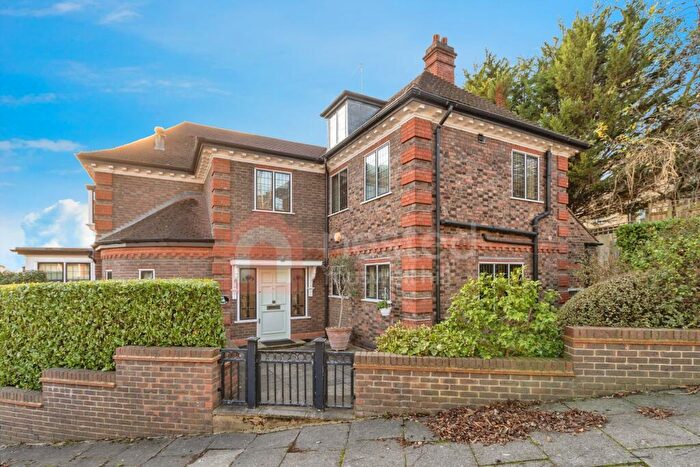
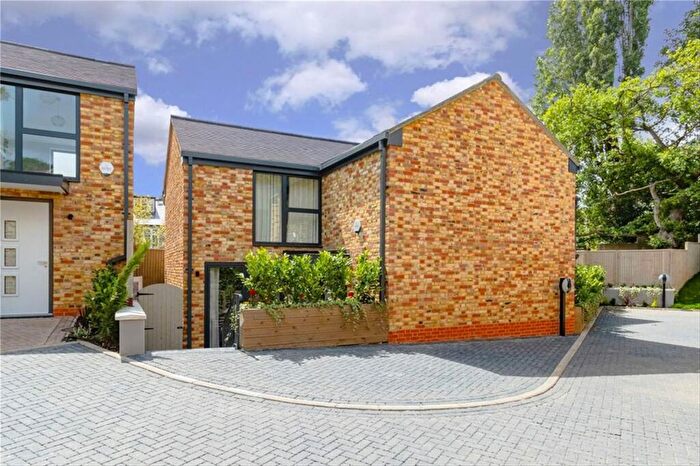
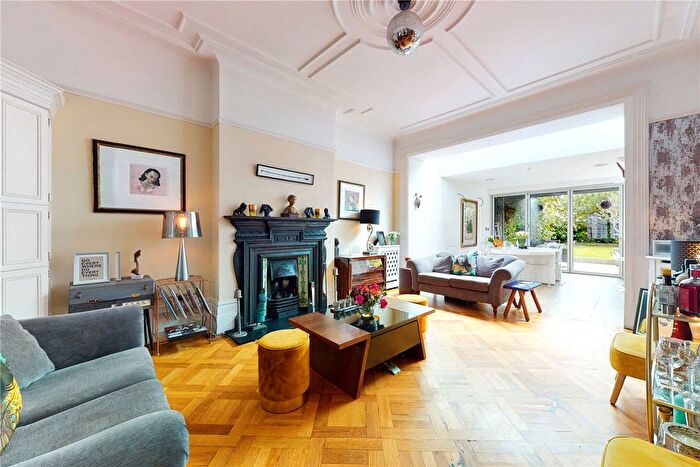
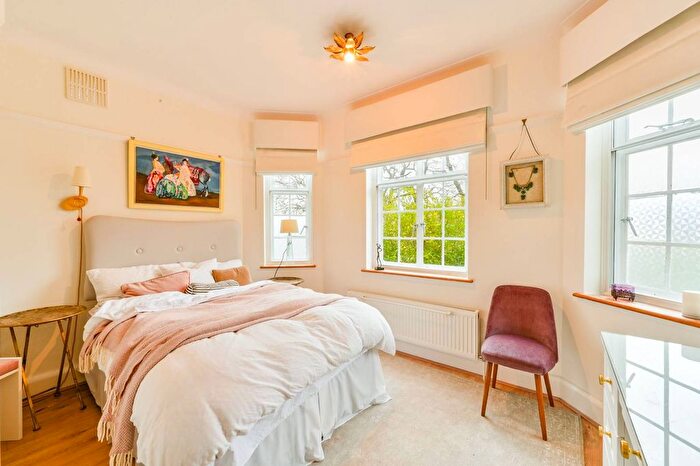
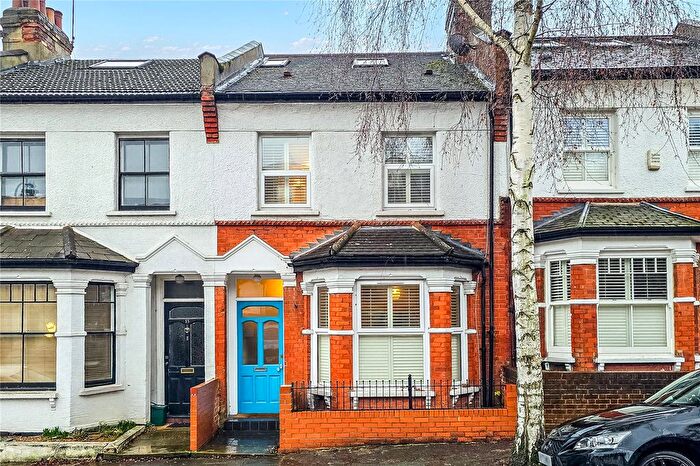
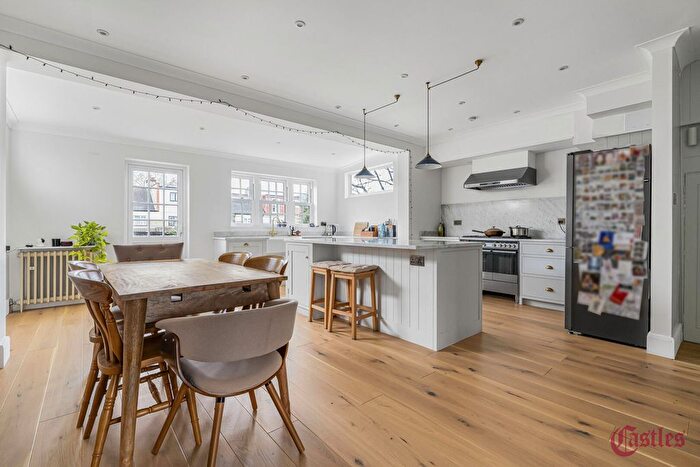
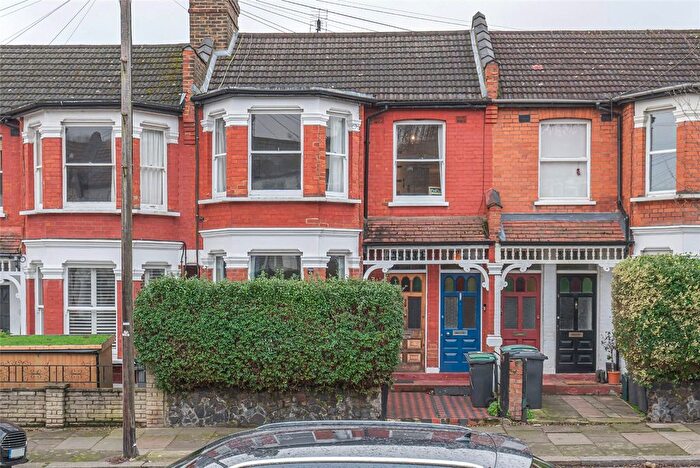
Properties for sale in Muswell Hill
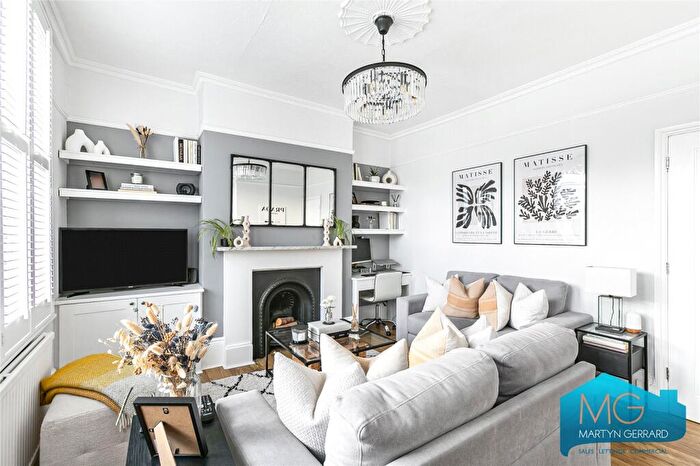
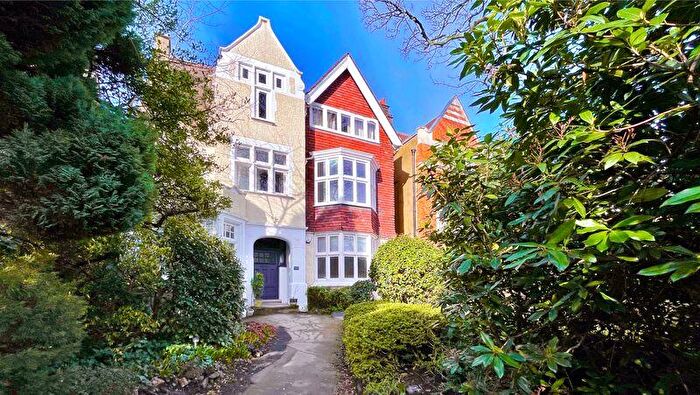
![]()
If you are looking to sell your house, let it out, or receive a property valuation, an expert can help you.
Click the button below to get started.


Roads and Postcodes in Muswell Hill
Navigate through our locations to find the location of your next house in Muswell Hill, London for sale or to rent.
Transport near Muswell Hill
-
 Highgate Station
 -
 Alexandra Palace Station
 -
Hornsey Station
-
East Finchley Station
-
 Crouch Hill Station
 -
Wood Green Station
-
Archway Station
-
Bounds Green Station
-
Turnpike Lane Station
-
Harringay Station
- FAQ
- Price Paid By Year
- Property Type Price
Frequently asked questions about Muswell Hill
What is the average price for a property for sale in Muswell Hill?
The average price for a property for sale in Muswell Hill is £1,063,665. This amount is 50% higher than the average price in London. There are 3,702 property listings for sale in Muswell Hill.
What streets have the most expensive properties for sale in Muswell Hill?
The streets with the most expensive properties for sale in Muswell Hill are Wood Vale at an average of £2,395,756, Grand Avenue at an average of £2,151,666 and Onslow Gardens at an average of £1,745,000.
What streets have the most affordable properties for sale in Muswell Hill?
The streets with the most affordable properties for sale in Muswell Hill are St. James Lane at an average of £225,000, The Grove at an average of £315,000 and Summerland Gardens at an average of £351,250.
Which train stations are available in or near Muswell Hill?
Some of the train stations available in or near Muswell Hill are Alexandra Palace, Hornsey and Crouch Hill.
Which tube stations are available in or near Muswell Hill?
Some of the tube stations available in or near Muswell Hill are Highgate, East Finchley and Wood Green.
Property Price Paid in Muswell Hill by Year
The average sold property price by year was:
| Year | Average Sold Price | Price Change |
Sold Properties
|
|---|---|---|---|
| 2025 | £1,058,334 | 2% |
84 Properties |
| 2024 | £1,037,833 | -5% |
133 Properties |
| 2023 | £1,089,384 | 1% |
151 Properties |
| 2022 | £1,078,777 | 2% |
147 Properties |
| 2021 | £1,059,640 | 4% |
171 Properties |
| 2020 | £1,016,024 | 10% |
124 Properties |
| 2019 | £914,087 | 3% |
169 Properties |
| 2018 | £884,760 | -0,2% |
136 Properties |
| 2017 | £886,233 | -4% |
202 Properties |
| 2016 | £925,225 | 6% |
101 Properties |
| 2015 | £868,783 | -0,3% |
114 Properties |
| 2014 | £871,511 | 10% |
140 Properties |
| 2013 | £780,726 | 20% |
176 Properties |
| 2012 | £627,742 | -3% |
173 Properties |
| 2011 | £644,510 | 15% |
125 Properties |
| 2010 | £547,479 | -5% |
149 Properties |
| 2009 | £572,961 | 9% |
121 Properties |
| 2008 | £520,277 | -19% |
96 Properties |
| 2007 | £618,351 | 23% |
213 Properties |
| 2006 | £473,961 | 16% |
247 Properties |
| 2005 | £396,586 | 8% |
162 Properties |
| 2004 | £364,395 | -4% |
188 Properties |
| 2003 | £379,168 | 5% |
163 Properties |
| 2002 | £360,873 | 6% |
232 Properties |
| 2001 | £339,010 | 16% |
209 Properties |
| 2000 | £283,295 | 20% |
185 Properties |
| 1999 | £227,820 | 7% |
280 Properties |
| 1998 | £212,540 | 28% |
218 Properties |
| 1997 | £152,591 | 4% |
271 Properties |
| 1996 | £146,580 | 7% |
235 Properties |
| 1995 | £136,587 | - |
211 Properties |
Property Price per Property Type in Muswell Hill
Here you can find historic sold price data in order to help with your property search.
The average Property Paid Price for specific property types in the last three years are:
| Property Type | Average Sold Price | Sold Properties |
|---|---|---|
| Flat | £609,570.00 | 191 Flats |
| Semi Detached House | £1,631,877.00 | 53 Semi Detached Houses |
| Detached House | £1,598,000.00 | 10 Detached Houses |
| Terraced House | £1,513,434.00 | 114 Terraced Houses |