
Houses for sale & to rent in London, Haringey London Borough
House Prices in London, Haringey London Borough
Properties in this part of London within the Haringey London Borough have an average house price of £712k and had 6,647 Property Transactions within the last 3 years.¹ This area has 102,012 households² , where the most expensive property was sold for £10.75M.
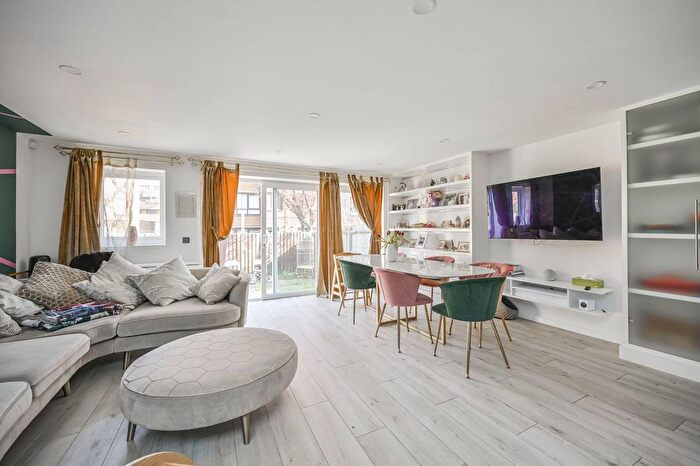
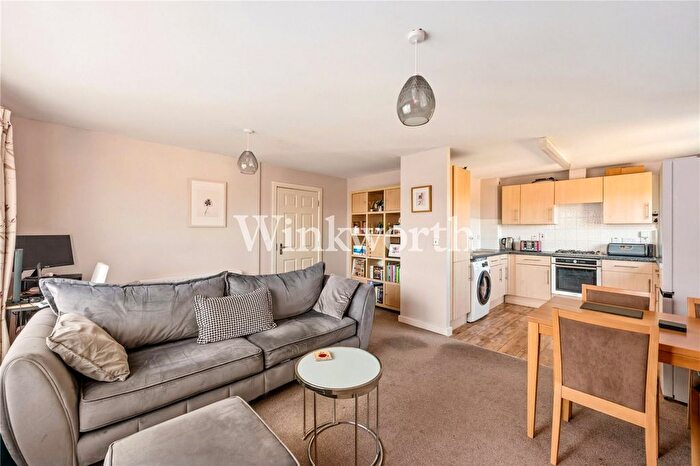
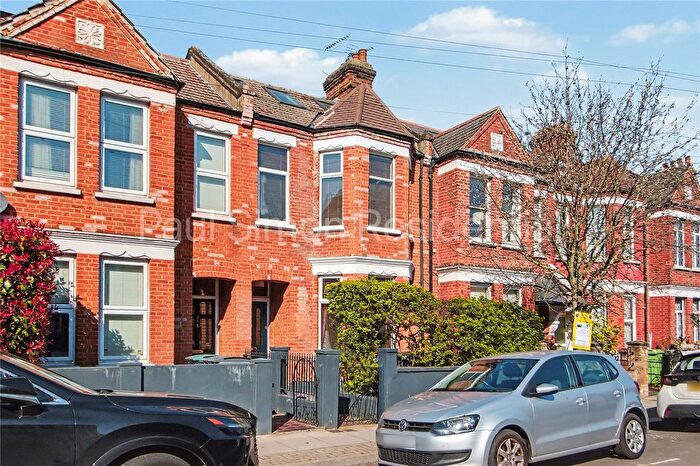
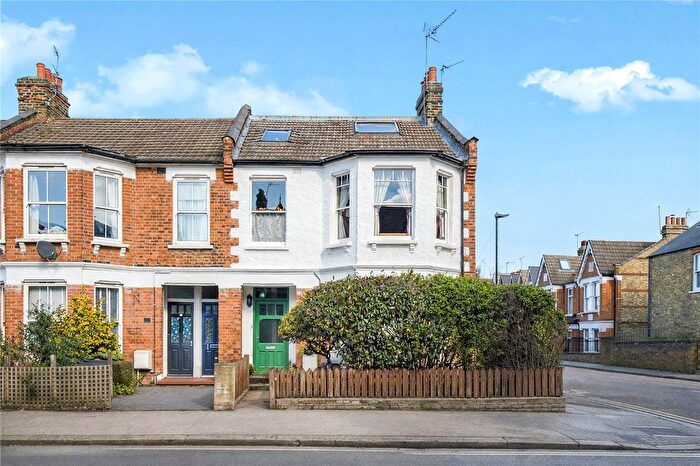
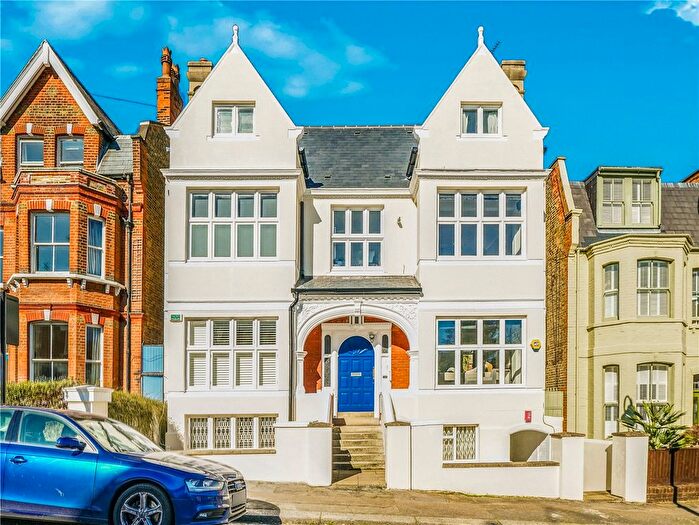
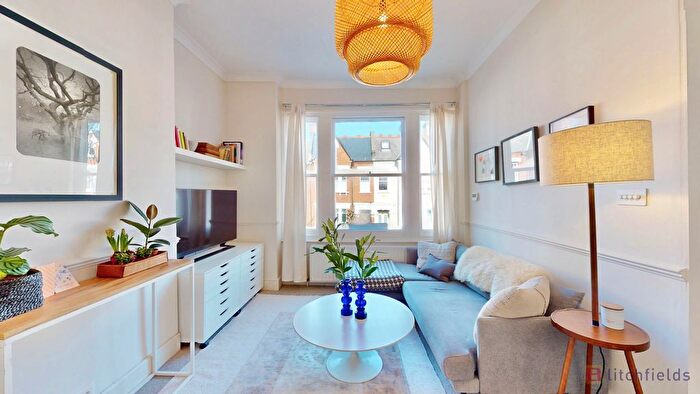
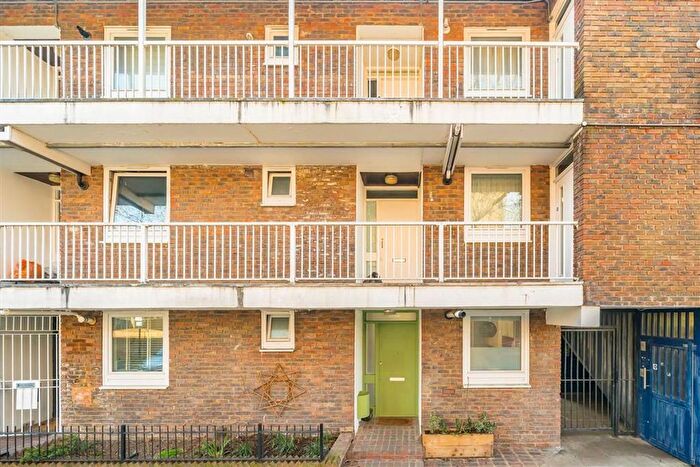
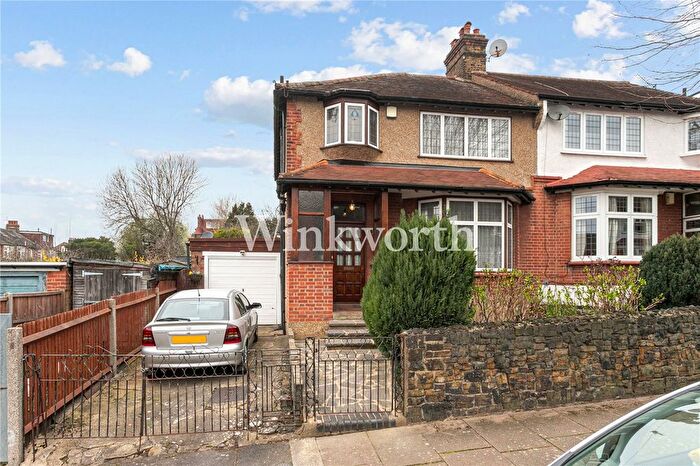
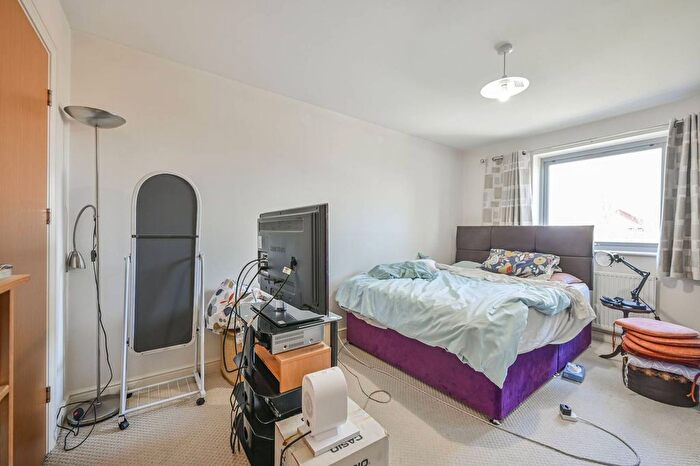
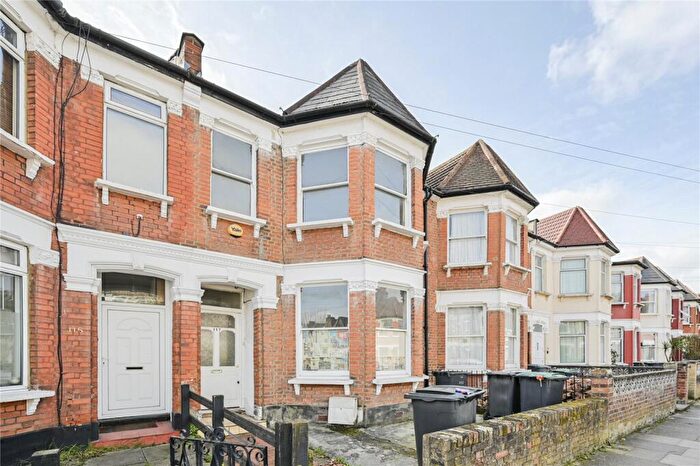
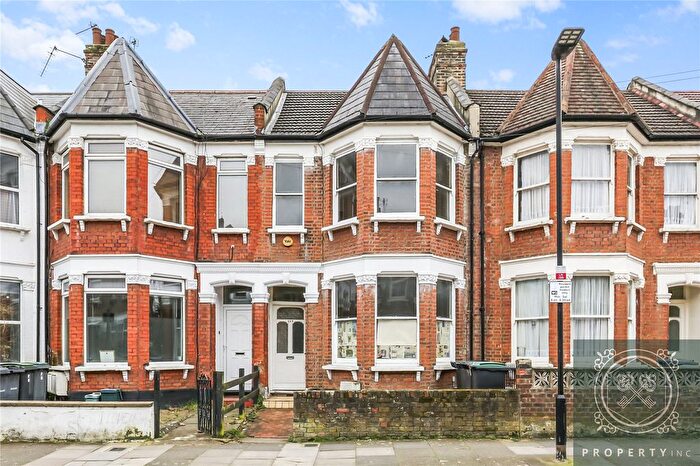
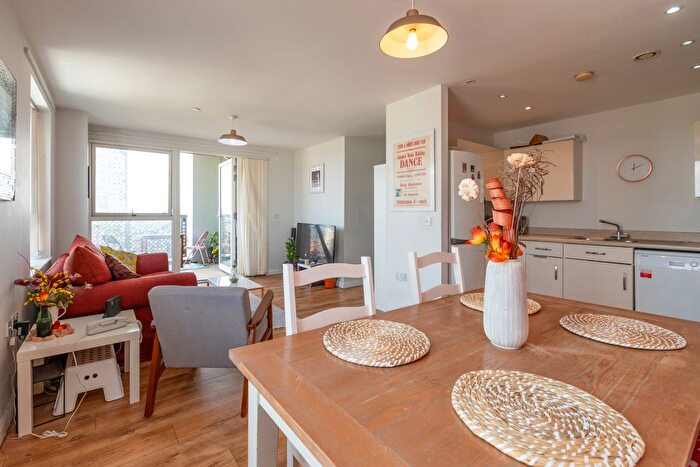
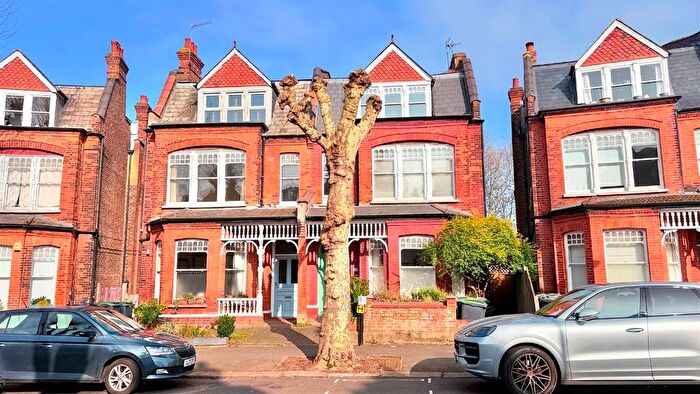
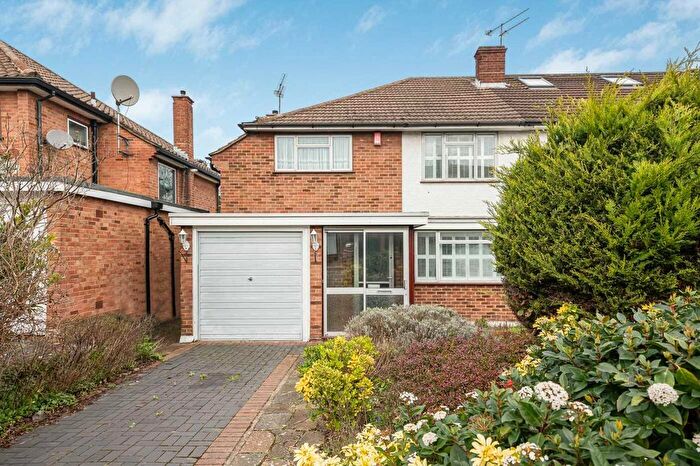
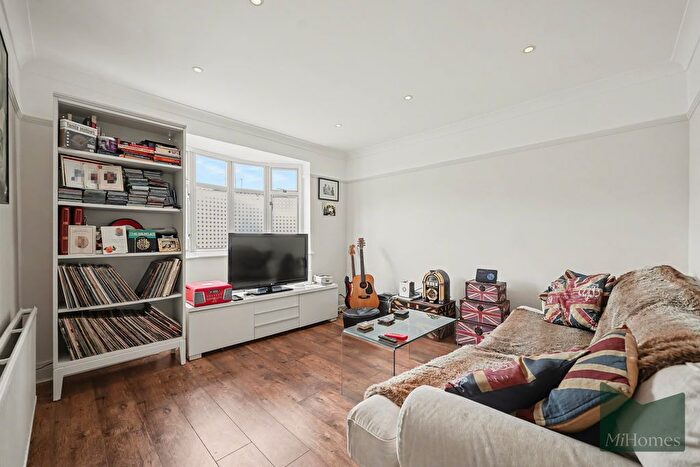
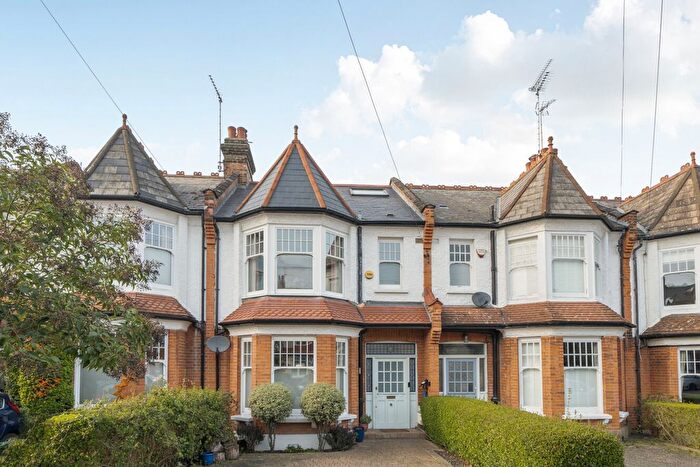
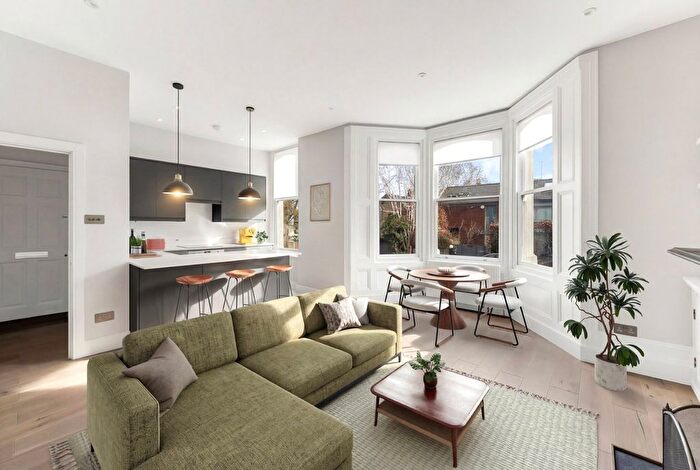
Properties for sale in London, Haringey London Borough
![]()
If you are looking to sell your house, let it out, or receive a property valuation, an expert can help you.
Click the button below to get started.
Neighbourhoods in London, Haringey London Borough
Navigate through our locations to find the location of your next house in London, Haringey London Borough for sale or to rent.
Transport in London, Haringey London Borough
Please see below transportation links in this area:
-
 Turnpike Lane Station
 -
 Hornsey Station
 -
Wood Green Station
-
Harringay Station
-
Alexandra Palace Station
-
 Harringay Green Lanes Station
 -
Seven Sisters Station
-
Bowes Park Station
-
Manor House Station
-
Crouch Hill Station
- FAQ
- Price Paid By Year
- Property Type Price
Frequently asked questions about London, Haringey London Borough
What is the average price for a property for sale in London, Haringey London Borough?
The average price for a property for sale in London, Haringey London Borough is £711,621. There are more than 10,000 property listings for sale in London, Haringey London Borough.
What locations have the most expensive properties for sale in London, Haringey London Borough?
The locations with the most expensive properties for sale in London, Haringey London Borough are Highgate at an average of £1,276,939, Muswell Hill at an average of £1,060,694 and Alexandra at an average of £1,045,263.
What locations have the most affordable properties for sale in London, Haringey London Borough?
The locations with the most affordable properties for sale in London, Haringey London Borough are Northumberland Park at an average of £377,968, Tottenham Hale at an average of £418,425 and White Hart Lane at an average of £421,996.
Which train stations are available in or near London, Haringey London Borough?
Some of the train stations available in or near London, Haringey London Borough are Hornsey, Harringay and Alexandra Palace.
Which tube stations are available in or near London, Haringey London Borough?
Some of the tube stations available in or near London, Haringey London Borough are Turnpike Lane, Wood Green and Seven Sisters.
Property Price Paid in London, Haringey London Borough by Year
The average sold property price by year was:
| Year | Average Sold Price | Price Change |
Sold Properties
|
|---|---|---|---|
| 2025 | £692,097 | -3% |
1,944 Properties |
| 2024 | £709,872 | -3% |
2,455 Properties |
| 2023 | £730,413 | -3% |
2,248 Properties |
| 2022 | £748,750 | 7% |
2,768 Properties |
| 2021 | £696,278 | 3% |
3,177 Properties |
| 2020 | £674,288 | 6% |
2,125 Properties |
| 2019 | £636,996 | -0,1% |
2,331 Properties |
| 2018 | £637,777 | -2% |
2,425 Properties |
| 2017 | £653,496 | 11% |
2,333 Properties |
| 2016 | £579,950 | 5% |
2,758 Properties |
| 2015 | £553,709 | 4% |
3,012 Properties |
| 2014 | £533,479 | 9% |
3,073 Properties |
| 2013 | £483,242 | 14% |
2,716 Properties |
| 2012 | £417,051 | 1% |
2,439 Properties |
| 2011 | £411,968 | 4% |
2,306 Properties |
| 2010 | £396,428 | 12% |
2,351 Properties |
| 2009 | £350,674 | 1% |
1,862 Properties |
| 2008 | £347,537 | -2% |
2,027 Properties |
| 2007 | £352,846 | 13% |
4,344 Properties |
| 2006 | £305,562 | 10% |
4,670 Properties |
| 2005 | £274,353 | 5% |
3,530 Properties |
| 2004 | £259,660 | 8% |
4,296 Properties |
| 2003 | £238,081 | 5% |
3,817 Properties |
| 2002 | £226,929 | 15% |
4,638 Properties |
| 2001 | £193,537 | 13% |
4,606 Properties |
| 2000 | £169,287 | 15% |
4,191 Properties |
| 1999 | £143,484 | 14% |
4,754 Properties |
| 1998 | £124,055 | 14% |
4,180 Properties |
| 1997 | £106,859 | 4% |
4,547 Properties |
| 1996 | £102,678 | 13% |
3,904 Properties |
| 1995 | £89,690 | - |
3,373 Properties |
Property Price per Property Type in London, Haringey London Borough
Here you can find historic sold price data in order to help with your property search.
The average Property Paid Price for specific property types in the last three years are:
| Property Type | Average Sold Price | Sold Properties |
|---|---|---|
| Semi Detached House | £1,389,155.00 | 358 Semi Detached Houses |
| Terraced House | £866,193.00 | 2,487 Terraced Houses |
| Detached House | £2,548,872.00 | 116 Detached Houses |
| Flat | £483,704.00 | 3,686 Flats |