
Houses for sale & to rent in Cranham, Hornchurch
House Prices in Cranham
Properties in this part of Cranham within Hornchurch have an average house price of £460,417.00 and had 95 Property Transactions within the last 3 years¹. This area has 624 households² , where the most expensive property was sold for £710,000.00.
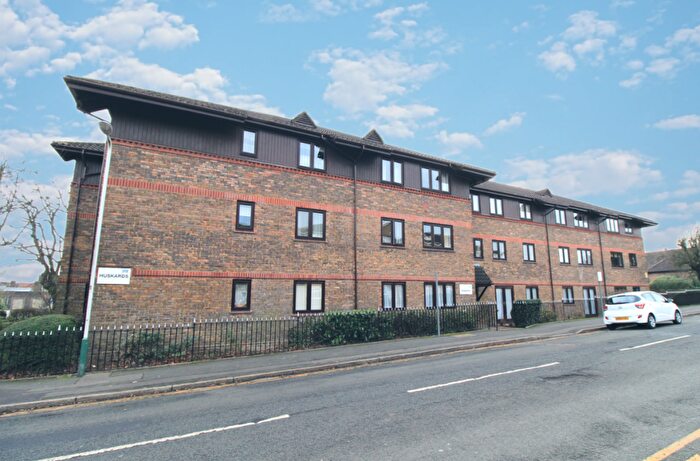
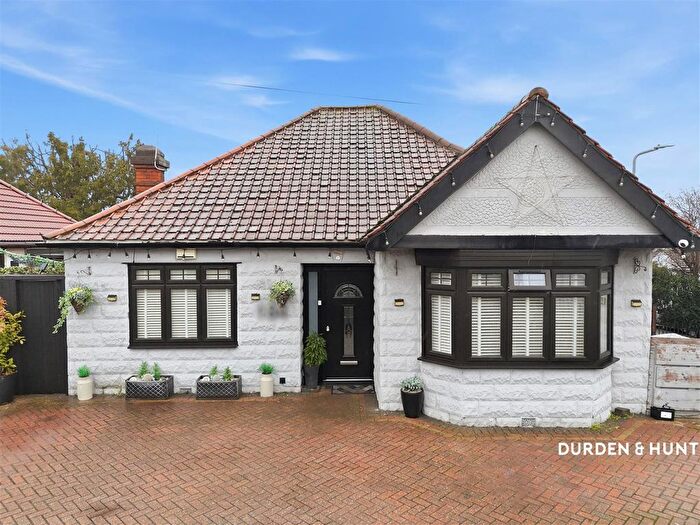
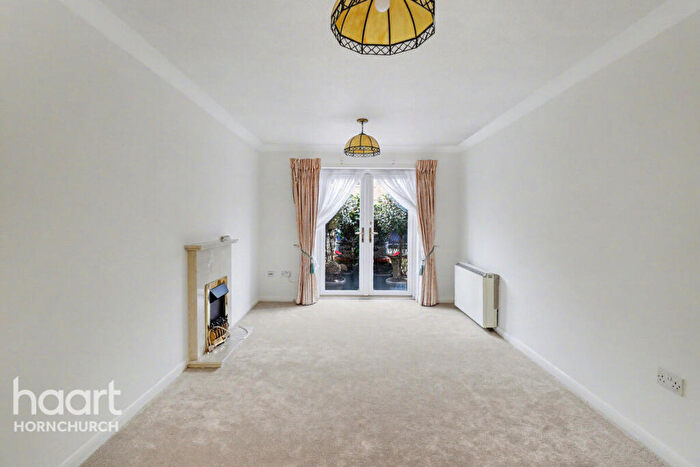
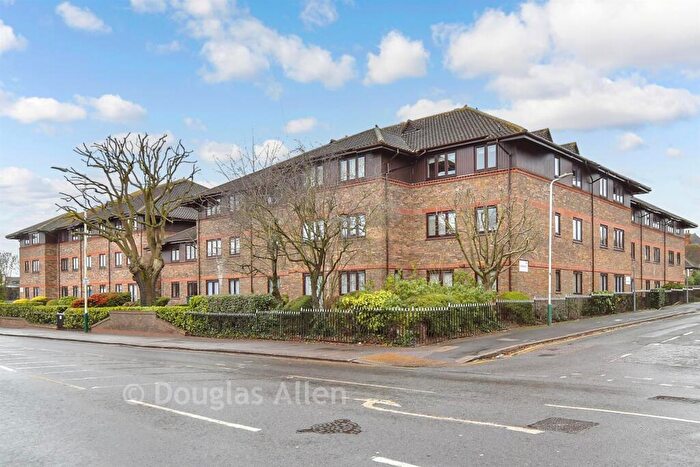
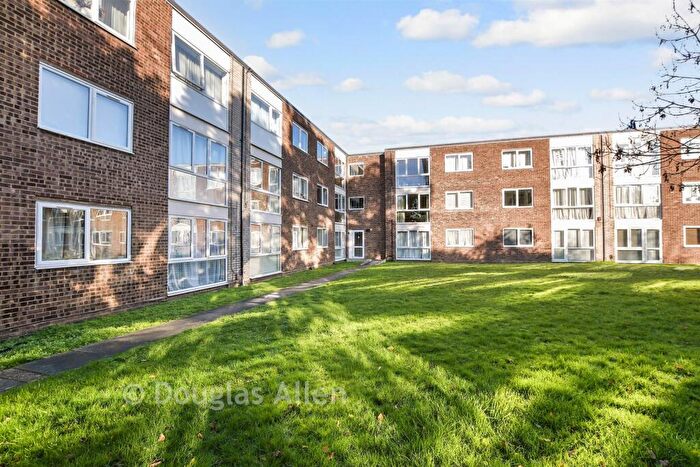
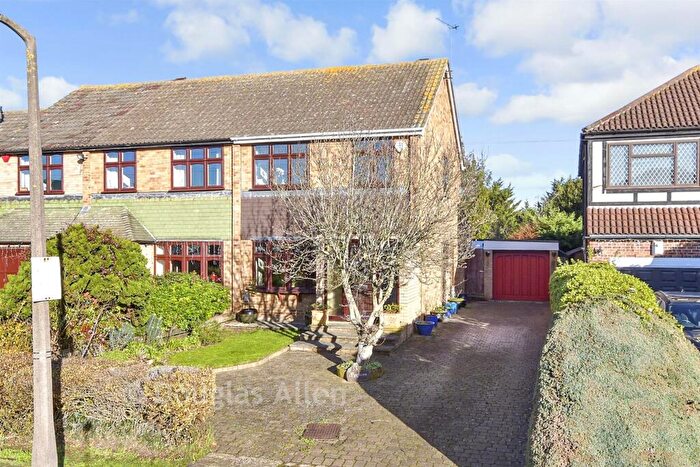
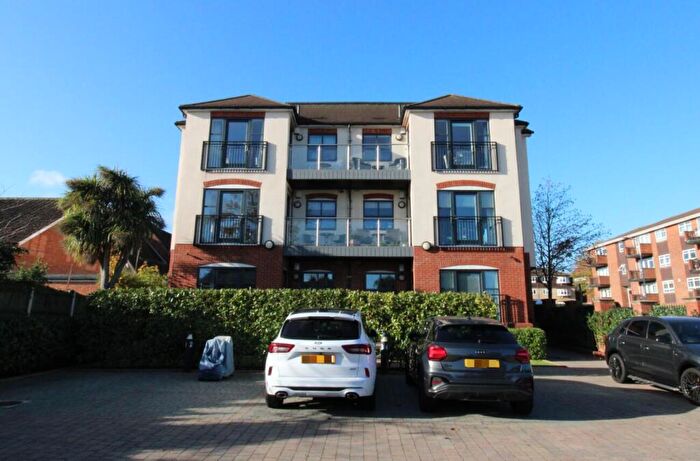
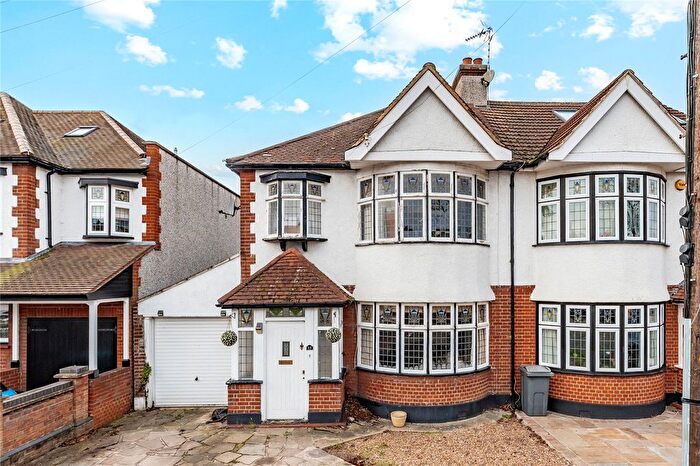
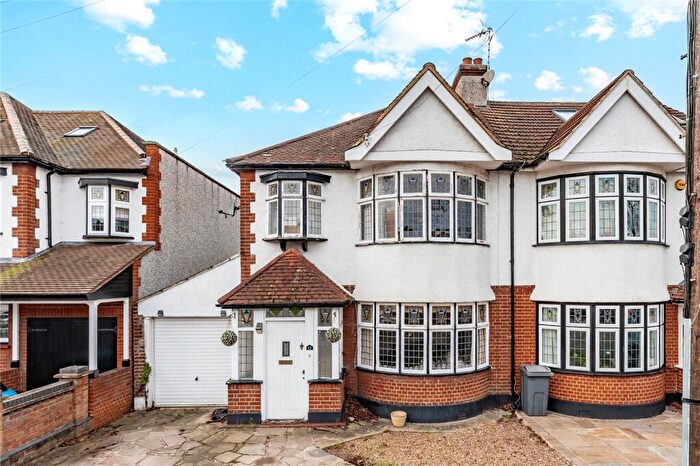
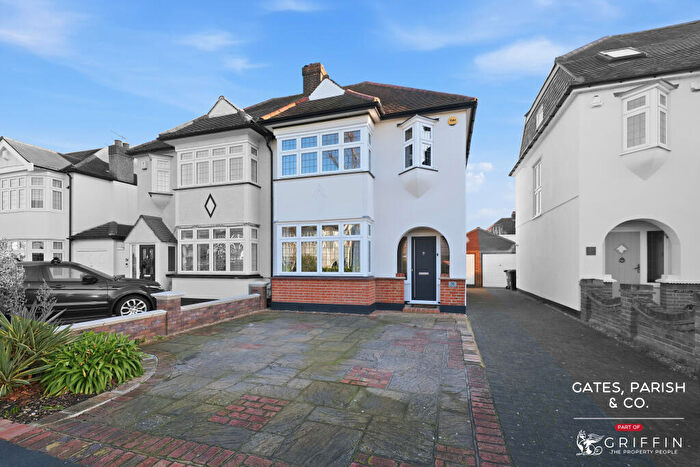
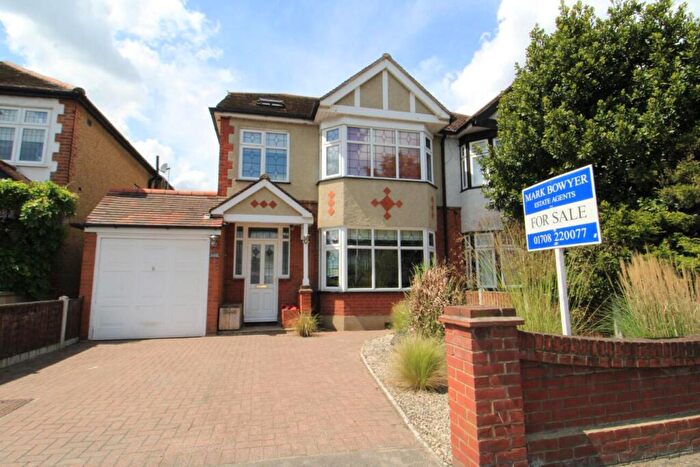
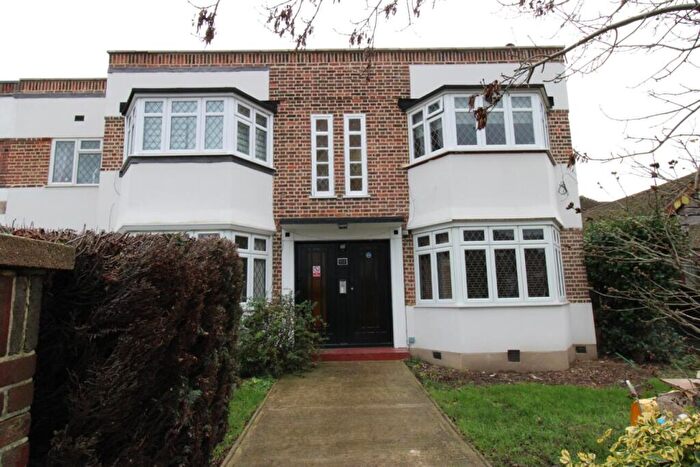
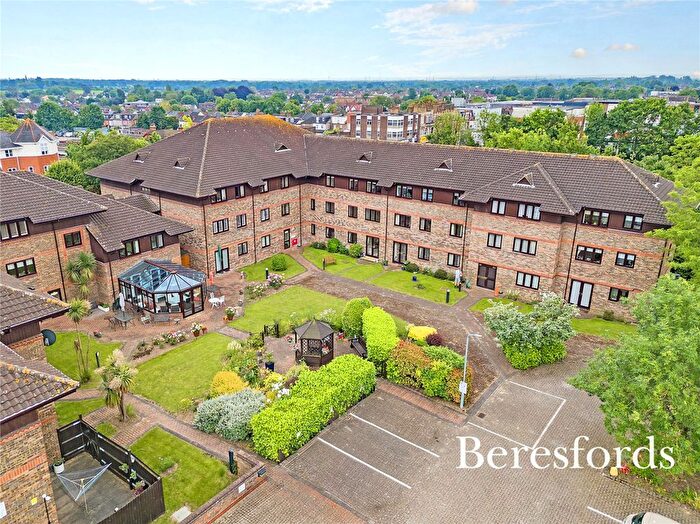
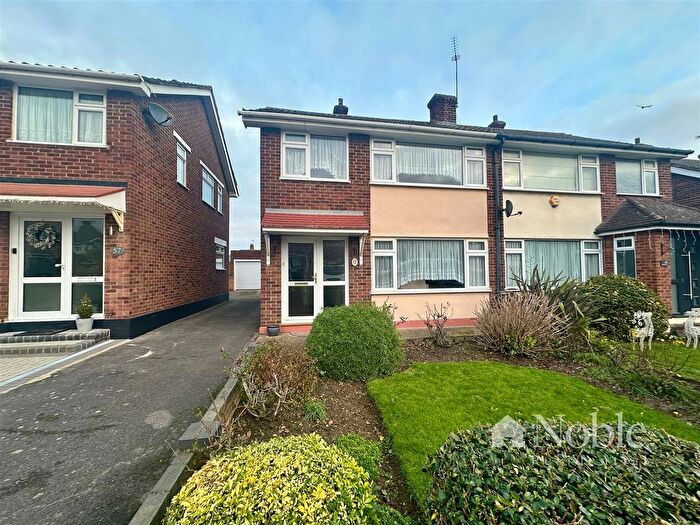
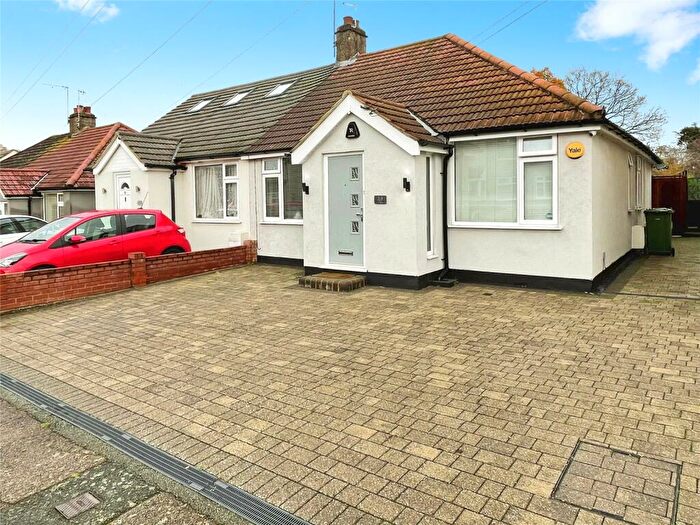
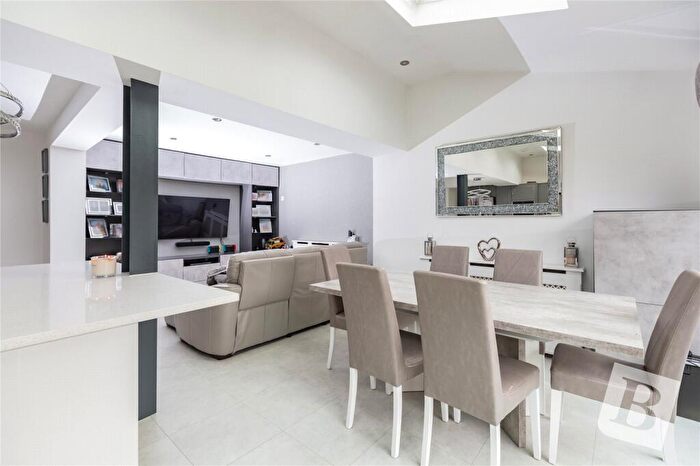
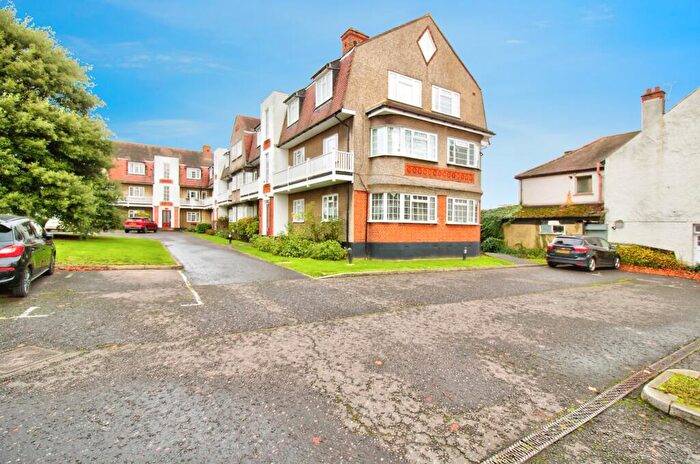
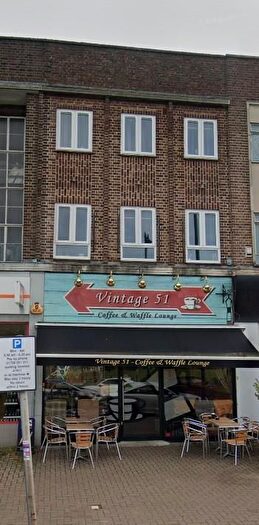
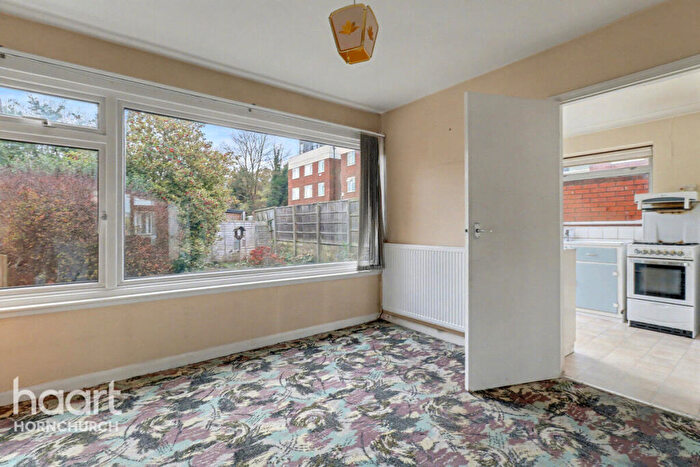
Properties for sale in Cranham
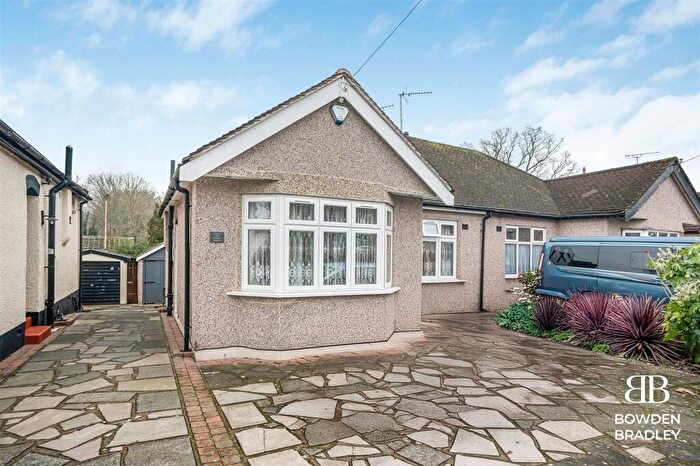
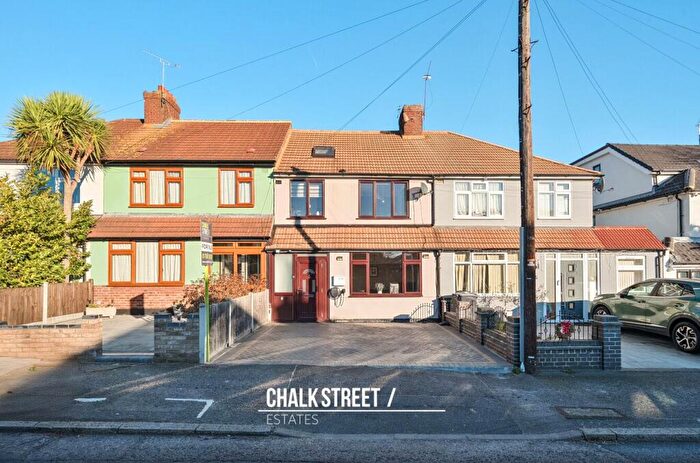
![]()
If you are looking to sell your house, let it out, or receive a property valuation, an expert can help you.
Click the button below to get started.
Roads and Postcodes in Cranham
Navigate through our locations to find the location of your next house in Cranham, Hornchurch for sale or to rent.
| Streets | Postcodes |
|---|---|
| Ashby Close | RM11 3QR |
| Benets Road | RM11 3PS RM11 3PT RM11 3PU |
| Berkeley Close | RM11 3QB |
| Berkeley Drive | RM11 3JP RM11 3PY RM11 3PZ |
| Caernarvon Close | RM11 3QL |
| Carisbrooke Close | RM11 3QP |
| Dunster Crescent | RM11 3QD |
| Dury Falls Close | RM11 3AX |
| Falkirk Close | RM11 3QJ RM11 3QX |
| Frimley Avenue | RM11 3PX |
| Hedingham Road | RM11 3QA RM11 3QH |
| Holme Road | RM11 3QS |
| Lee Gardens Avenue | RM11 3BA |
| Somerset Gardens | RM11 3QT RM11 3QU |
| Tiptree Close | RM11 3BD |
Transport near Cranham
-
 Upminster Bridge Station
 -

 Upminster Station
 -
Emerson Park Station
-
Hornchurch Station
-
 Gidea Park Station
 -
Elm Park Station
-
Harold Wood Station
-
Romford Station
- FAQ
- Price Paid By Year
- Property Type Price
Frequently asked questions about Cranham
What is the average price for a property for sale in Cranham?
The average price for a property for sale in Cranham is £460,417. This amount is 8% lower than the average price in Hornchurch. There are 1,071 property listings for sale in Cranham.
What streets have the most expensive properties for sale in Cranham?
The streets with the most expensive properties for sale in Cranham are Dury Falls Close at an average of £566,750, Holme Road at an average of £535,000 and Berkeley Close at an average of £520,000.
What streets have the most affordable properties for sale in Cranham?
The streets with the most affordable properties for sale in Cranham are Somerset Gardens at an average of £395,875, Dunster Crescent at an average of £397,625 and Falkirk Close at an average of £420,368.
Which train stations are available in or near Cranham?
Some of the train stations available in or near Cranham are Upminster, Emerson Park and Gidea Park.
Which tube stations are available in or near Cranham?
Some of the tube stations available in or near Cranham are Upminster Bridge, Upminster and Hornchurch.
Property Price Paid in Cranham by Year
The average sold property price by year was:
| Year | Average Sold Price | Price Change |
Sold Properties
|
|---|---|---|---|
| 2025 | £497,625 | 8% |
20 Properties |
| 2024 | £457,250 | -0,1% |
21 Properties |
| 2023 | £457,822 | 3% |
20 Properties |
| 2022 | £442,014 | 7% |
34 Properties |
| 2021 | £411,404 | 5% |
43 Properties |
| 2020 | £390,417 | -3% |
20 Properties |
| 2019 | £401,626 | 7% |
16 Properties |
| 2018 | £375,089 | -1% |
21 Properties |
| 2017 | £379,914 | 6% |
24 Properties |
| 2016 | £357,928 | 15% |
28 Properties |
| 2015 | £302,500 | 7% |
24 Properties |
| 2014 | £282,498 | 12% |
32 Properties |
| 2013 | £247,777 | 10% |
27 Properties |
| 2012 | £222,718 | -4% |
16 Properties |
| 2011 | £232,117 | -4% |
17 Properties |
| 2010 | £241,422 | 15% |
26 Properties |
| 2009 | £204,777 | -13% |
18 Properties |
| 2008 | £230,605 | -4% |
19 Properties |
| 2007 | £239,999 | 9% |
30 Properties |
| 2006 | £218,354 | 9% |
31 Properties |
| 2005 | £198,375 | 3% |
24 Properties |
| 2004 | £191,614 | 6% |
39 Properties |
| 2003 | £180,147 | 15% |
37 Properties |
| 2002 | £153,356 | 15% |
37 Properties |
| 2001 | £131,017 | 16% |
26 Properties |
| 2000 | £110,452 | 16% |
34 Properties |
| 1999 | £92,569 | 6% |
35 Properties |
| 1998 | £86,803 | 15% |
19 Properties |
| 1997 | £74,086 | -5% |
26 Properties |
| 1996 | £77,745 | 9% |
23 Properties |
| 1995 | £70,528 | - |
24 Properties |
Property Price per Property Type in Cranham
Here you can find historic sold price data in order to help with your property search.
The average Property Paid Price for specific property types in the last three years are:
| Property Type | Average Sold Price | Sold Properties |
|---|---|---|
| Semi Detached House | £500,755.00 | 46 Semi Detached Houses |
| Terraced House | £427,897.00 | 39 Terraced Houses |
| Flat | £296,991.00 | 6 Flats |
| Detached House | £558,750.00 | 4 Detached Houses |