
Houses for sale in Havering London Borough, England
House Prices in Havering London Borough
Properties in Havering London Borough have
an average house price of
£458k
and had 10,552 Property Transactions
within the last 3 years.¹
Havering London Borough is a location in
England with
101,790 households², where the most expensive property was sold for £3.35M.
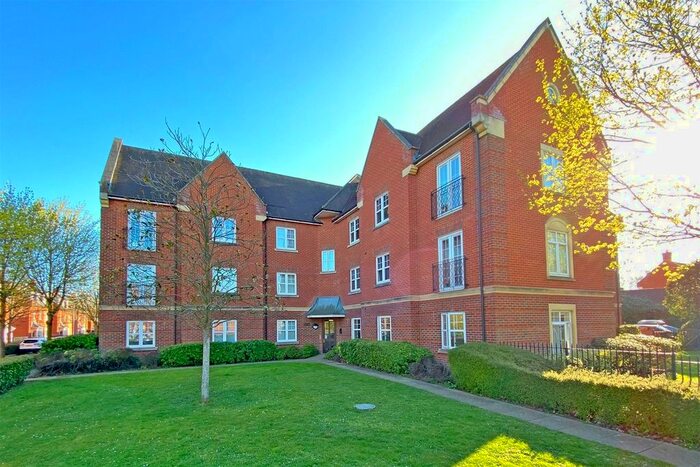
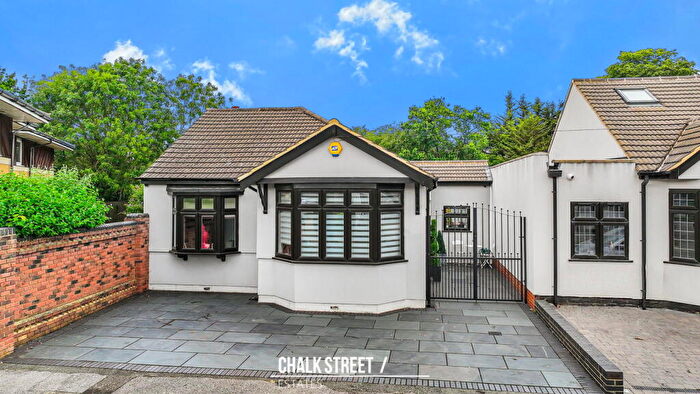
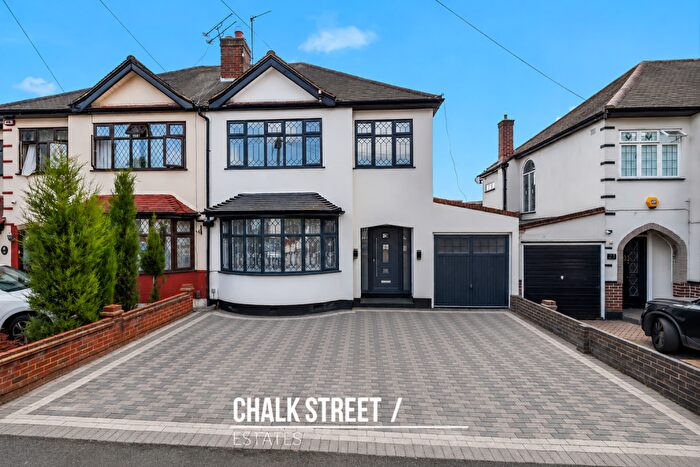
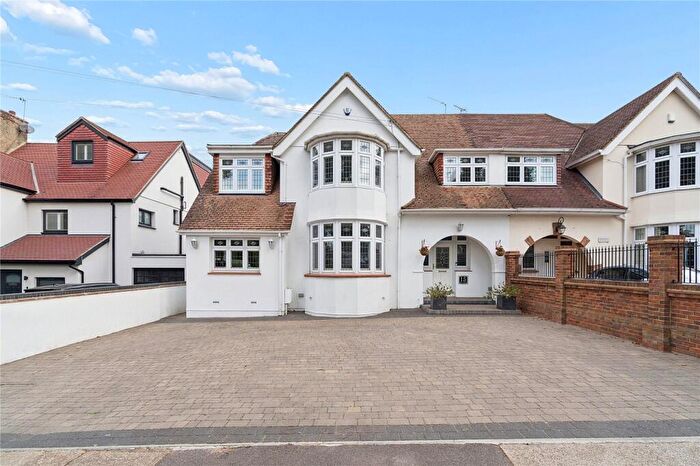
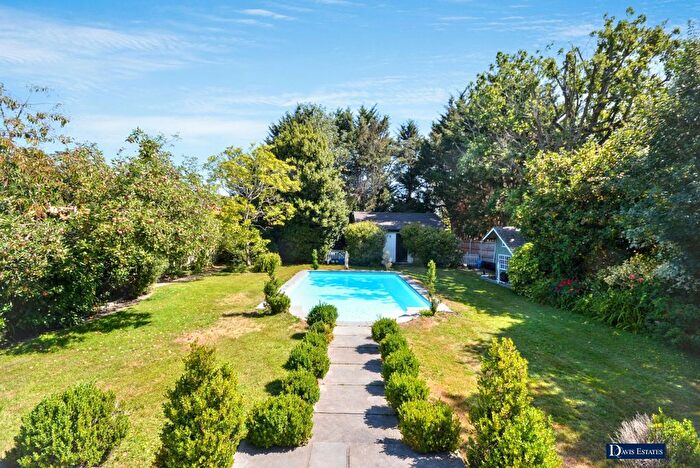
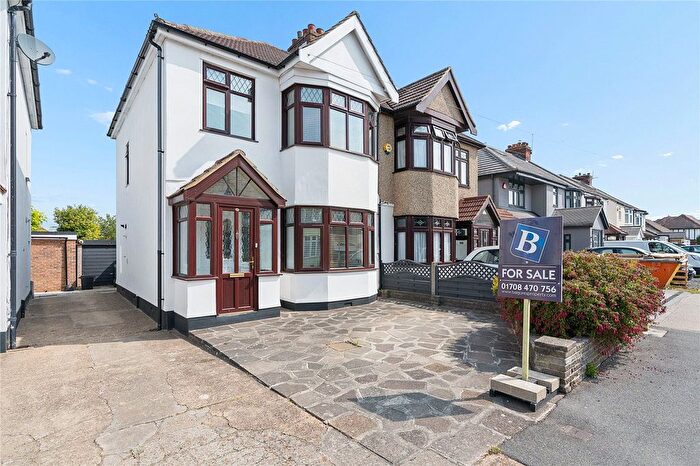
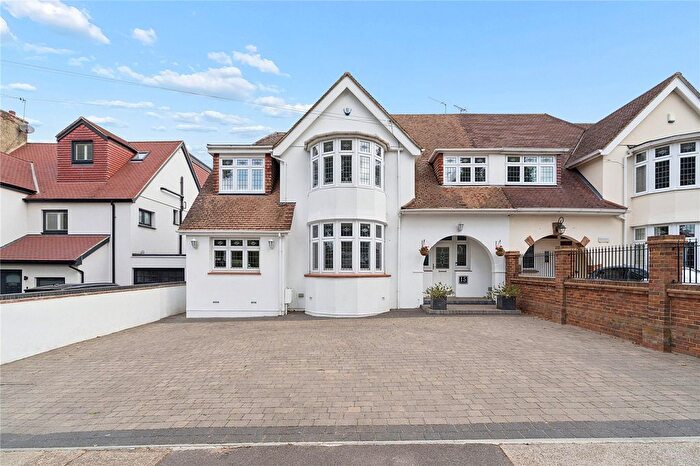
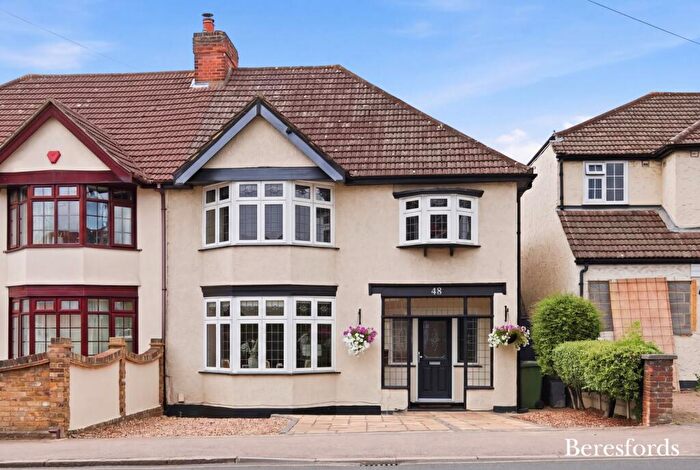
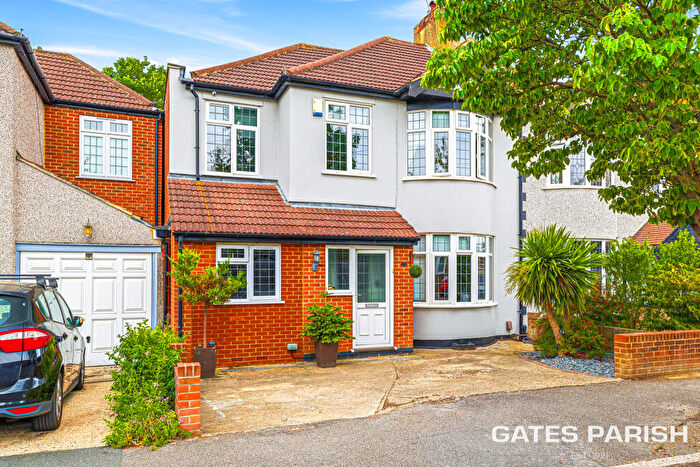
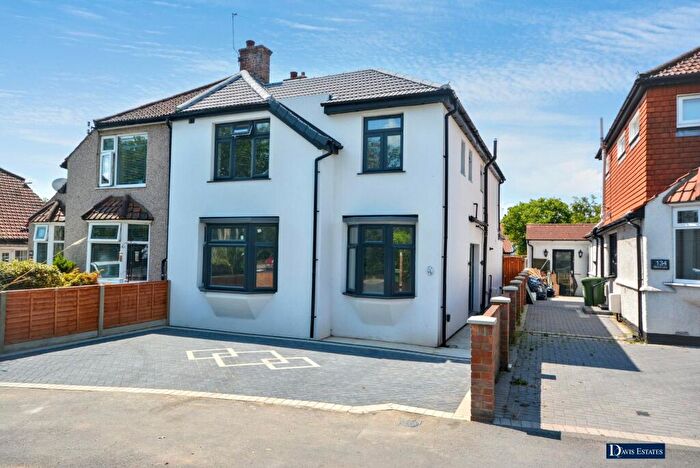
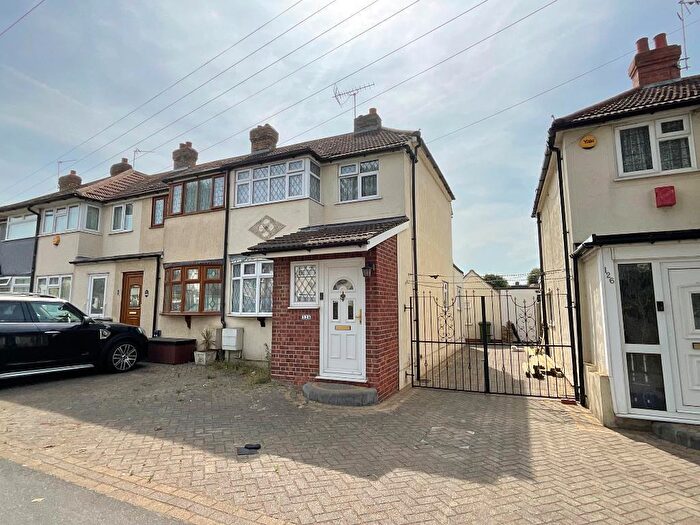
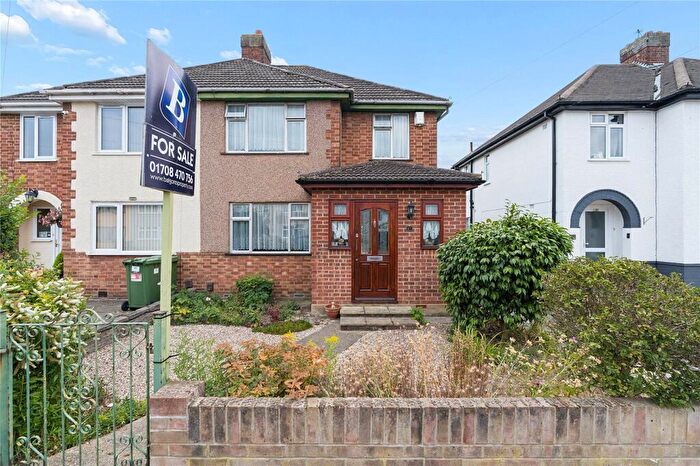
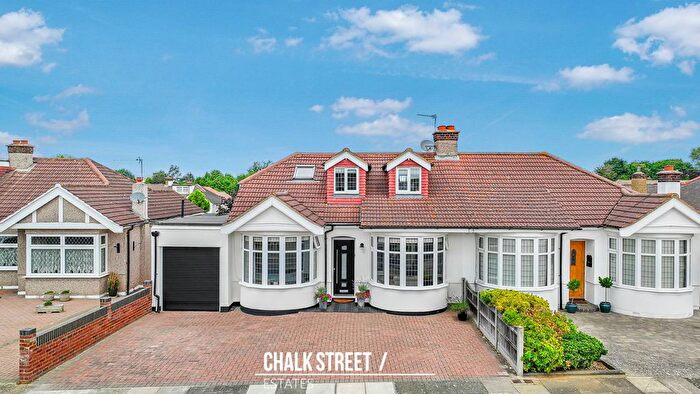
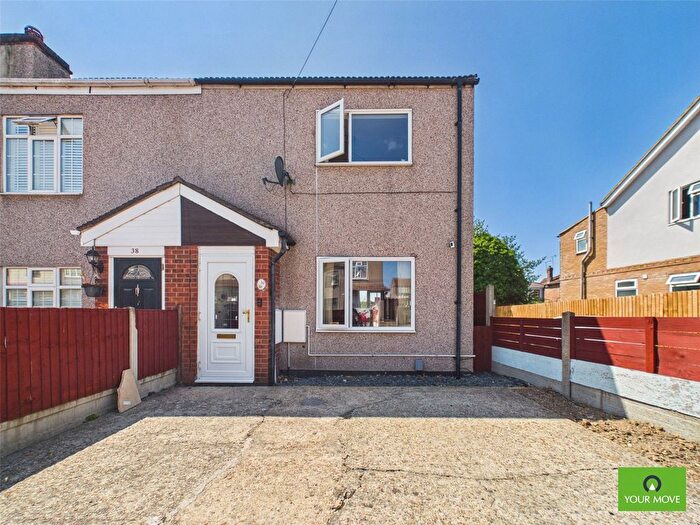
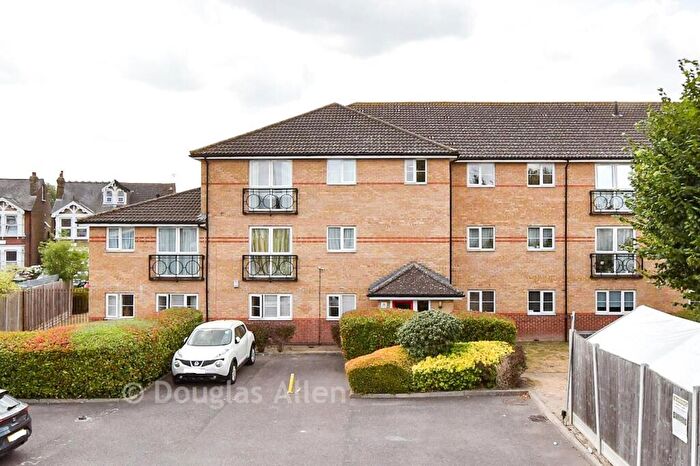
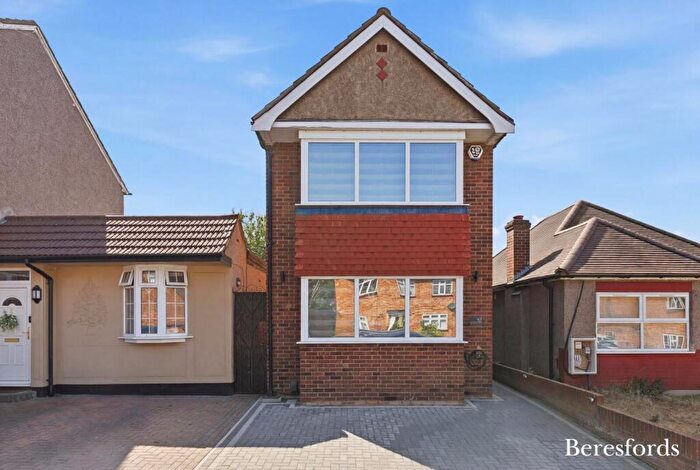
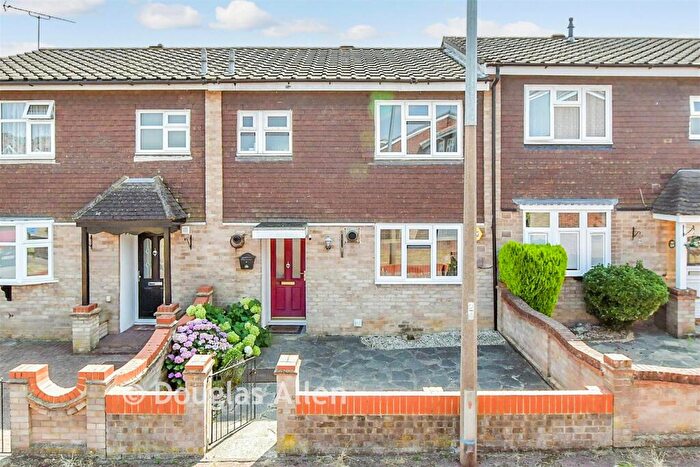
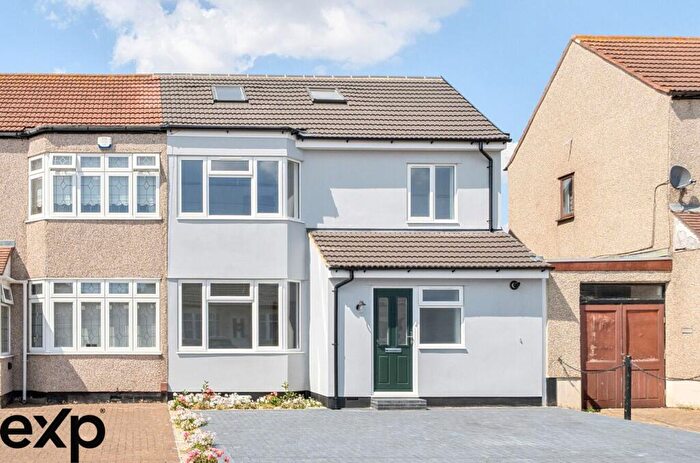
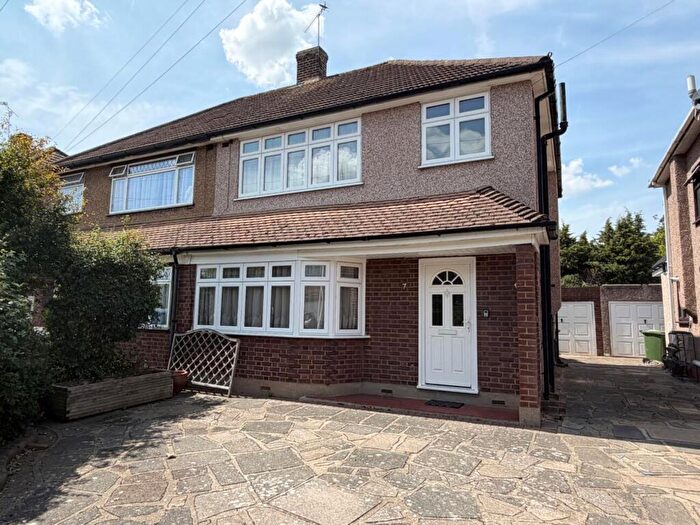
Properties for sale in Havering London Borough

![]()
If you are looking to sell your house, let it out, or receive a property valuation, an expert can help you.
Click the button below to get started.


Towns in Havering London Borough
Navigate through our locations to find the location of your next house in Havering, England for sale or to rent.
Property price trends in Havering London Borough
According to the latest Land Registry data, the average home in Havering London Borough sold for £453,234 in 2026. That figure comes from a substantial record of 119,726 sales logged over the past 31 years.
Prices have held fairly steady over the last three years. Compared with 2023, when the typical sale came in around £453,057, values are broadly unchanged.
Looking back five years, average prices are up about 5.7% since 2021, a gain of around £24,445 in cash terms.
Zoom out to the past decade for the fuller picture. Back in 2016, homes here averaged £354,219, so the typical sold price has climbed about 28% since then, roughly 2.5% a year. Stretch the view to fifteen years and that annual pace edges up closer to 4.1%.
Frequently asked questions about Havering London Borough
What is the average price for a property for sale in Havering London Borough?
The average price for a property for sale in Havering London Borough is £458,106. This amount is 28% higher than the average price in England. There are more than 10,000 property listings for sale in Havering London Borough.
What locations have the most expensive properties for sale in Havering London Borough?
The locations with the most expensive properties for sale in Havering London Borough are Upminster at an average of £590,072 and Hornchurch at an average of £500,057.
What locations have the most affordable properties for sale in Havering London Borough?
The locations with the most affordable properties for sale in Havering London Borough are Rainham at an average of £402,804 and Romford at an average of £420,228.
Which train stations are available in or near Havering London Borough?
Some of the train stations available in or near Havering London Borough are Gidea Park, Emerson Park and Romford.
Which tube stations are available in or near Havering London Borough?
Some of the tube stations available in or near Havering London Borough are Hornchurch, Upminster Bridge and Elm Park.
Property Price Paid in Havering London Borough by Year
The average sold property price by year was:
| Year | Average Sold Price | Price Change |
Sold Properties
|
|---|---|---|---|
| 2026 | £453,234 | -4% |
675 Properties |
| 2025 | £469,412 | 4% |
3,405 Properties |
| 2024 | £452,332 | -0,2% |
3,488 Properties |
| 2023 | £453,057 | -1% |
2,984 Properties |
| 2022 | £457,012 | 6% |
3,693 Properties |
| 2021 | £428,789 | 6% |
5,075 Properties |
| 2020 | £403,705 | 4% |
3,267 Properties |
| 2019 | £387,895 | 1% |
3,578 Properties |
| 2018 | £385,166 | 1% |
3,758 Properties |
| 2017 | £383,187 | 8% |
3,810 Properties |
Property Price per Property Type in Havering London Borough
Here you can find historic sold price data in order to help with your property search.
The average Property Paid Price for specific property types in the last three years are:
| Property Type | Average Sold Price | Sold Properties |
|---|---|---|
| Semi Detached House | £516,969.00 | 3,908 Semi Detached Houses |
| Terraced House | £435,735.00 | 3,385 Terraced Houses |
| Detached House | £743,428.00 | 1,038 Detached Houses |
| Flat | £255,281.00 | 2,221 Flats |
Transport in Havering London Borough
Please see below transportation links in this area:


