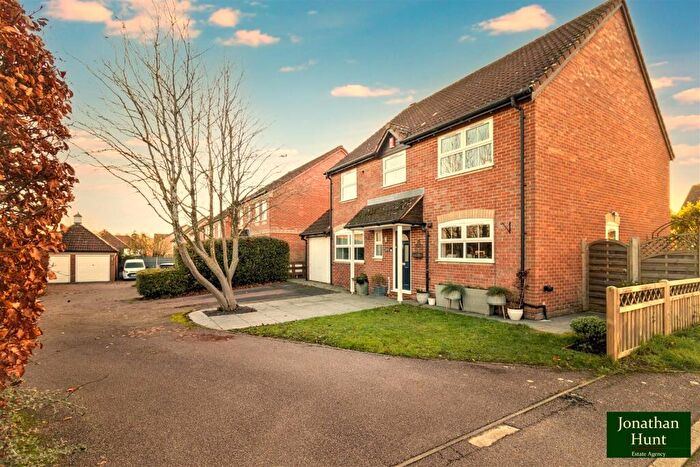
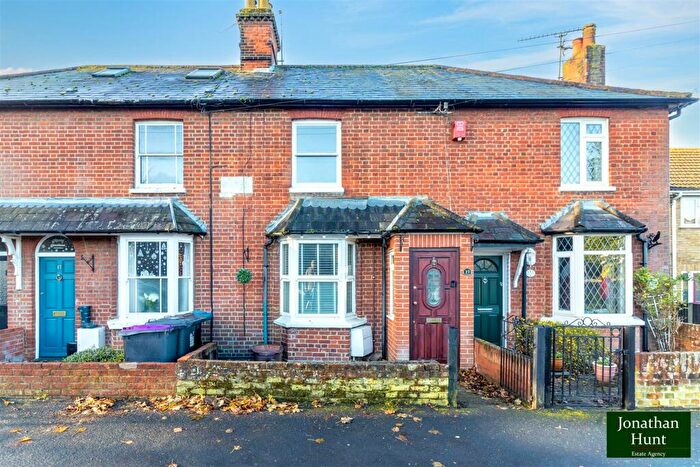
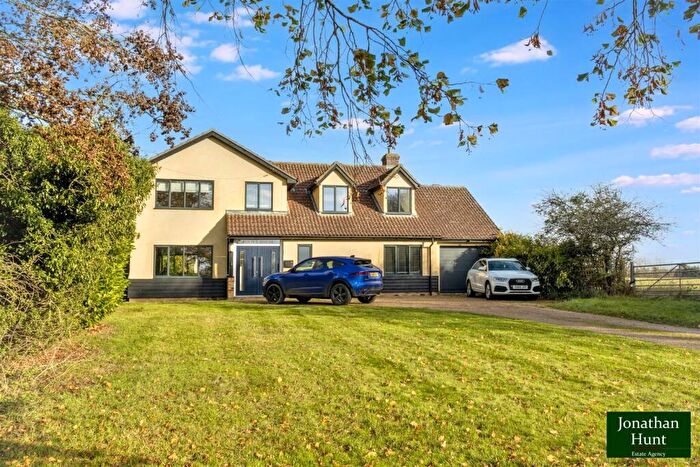
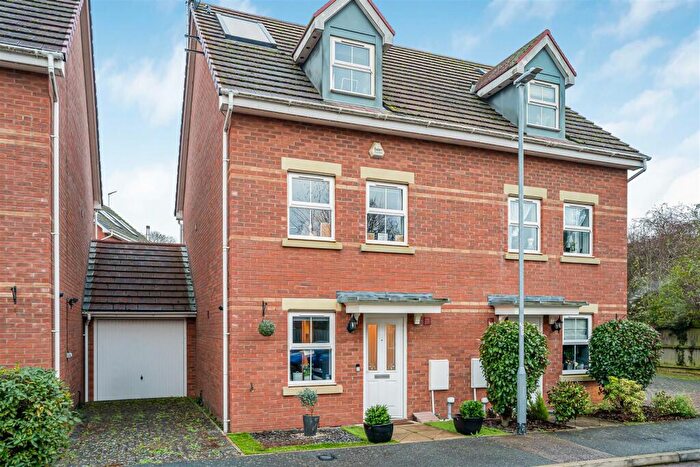
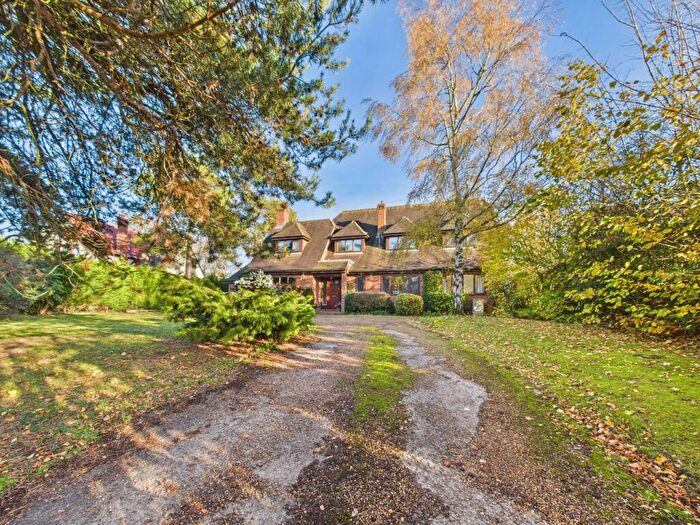
Houses for sale & to rent in Mundens And Cottered, Buntingford
House Prices in Mundens And Cottered
Properties in Mundens And Cottered have an average house price of £761,852.00 and had 44 Property Transactions within the last 3 years¹.
Mundens And Cottered is an area in Buntingford, Hertfordshire with 478 households², where the most expensive property was sold for £1,760,000.00.
Properties for sale in Mundens And Cottered
Roads and Postcodes in Mundens And Cottered
Navigate through our locations to find the location of your next house in Mundens And Cottered, Buntingford for sale or to rent.
| Streets | Postcodes |
|---|---|
| Baldock Road | SG9 9RH SG9 9ER |
| Broadfield | SG9 9RD |
| Brook End | SG9 9QR |
| Cherry Green | SG9 9NQ |
| Cherry Green Lane | SG9 9LD SG9 9LE SG9 9LF |
| Coopers Coppice | SG9 9PZ |
| Cottered Road | SG9 9RR |
| Flint Cottages | SG9 9LN |
| Home Close | SG9 9QW |
| Jubilee Cottages | SG9 9PF |
| Lower Farm Cottages | SG9 9RW |
| Middle Farm Cottages | SG9 9RN |
| Peasecroft | SG9 9QS |
| Royston Road | SG9 9RT |
| Sandon Lane | SG9 0RY |
| Station Hill | SG9 9NG |
| Stocking Hill | SG9 9PY |
| The Crescent | SG9 9QU SG9 9QX SG9 9QY |
| The Rookery | SG9 9JZ |
| The Street | SG9 9ST |
| The Terrace | SG9 9LP |
| Throcking Road | SG9 9RA SG9 9RB |
| Warren Lane | SG9 9QD SG9 9QG SG9 9QH |
| SG9 9LA SG9 9LB SG9 9LH SG9 9LJ SG9 9LL SG9 9LQ SG9 9LS SG9 9LT SG9 9LU SG9 9LW SG9 9LX SG9 9PB SG9 9PD SG9 9PE SG9 9PG SG9 9PJ SG9 9PS SG9 9PU SG9 9PW SG9 9QB SG9 9QJ SG9 9QL SG9 9QN SG9 9QP SG9 9QT SG9 9QZ SG9 9RU SG9 9LG SG9 9LR SG9 9LY SG9 9NH SG9 9NJ SG9 9NL SG9 9NN SG9 9NW SG9 9PH SG9 9PT SG9 9PX SG9 9QA SG9 9RJ SG9 9RL SG9 9RP |
Transport near Mundens And Cottered
-
Watton-At-Stone Station
-
Ashwell and Morden Station
-
Baldock Station
-
Stevenage Station
-
Knebworth Station
-
Royston Station
-
Letchworth Station
-
Ware Station
-
Hitchin Station
-
Hertford East Station
- FAQ
- Price Paid By Year
- Property Type Price
Frequently asked questions about Mundens And Cottered
What is the average price for a property for sale in Mundens And Cottered?
The average price for a property for sale in Mundens And Cottered is £761,852. This amount is 47% higher than the average price in Buntingford. There are 1,126 property listings for sale in Mundens And Cottered.
What streets have the most expensive properties for sale in Mundens And Cottered?
The streets with the most expensive properties for sale in Mundens And Cottered are Warren Lane at an average of £1,303,500, Brook End at an average of £1,212,500 and Cottered Road at an average of £712,500.
What streets have the most affordable properties for sale in Mundens And Cottered?
The streets with the most affordable properties for sale in Mundens And Cottered are Coopers Coppice at an average of £410,000, The Crescent at an average of £540,000 and Cherry Green Lane at an average of £652,000.
Which train stations are available in or near Mundens And Cottered?
Some of the train stations available in or near Mundens And Cottered are Watton-At-Stone, Ashwell and Morden and Baldock.
Property Price Paid in Mundens And Cottered by Year
The average sold property price by year was:
| Year | Average Sold Price | Price Change |
Sold Properties
|
|---|---|---|---|
| 2025 | £573,750 | -48% |
4 Properties |
| 2024 | £850,357 | 10% |
14 Properties |
| 2023 | £766,750 | 4% |
8 Properties |
| 2022 | £732,638 | -39% |
18 Properties |
| 2021 | £1,016,563 | 33% |
19 Properties |
| 2020 | £680,458 | 23% |
12 Properties |
| 2019 | £523,588 | -31% |
17 Properties |
| 2018 | £686,421 | 25% |
14 Properties |
| 2017 | £516,152 | -46% |
16 Properties |
| 2016 | £754,088 | 29% |
17 Properties |
| 2015 | £537,566 | -24% |
15 Properties |
| 2014 | £665,210 | 14% |
19 Properties |
| 2013 | £574,305 | 25% |
10 Properties |
| 2012 | £432,400 | -13% |
9 Properties |
| 2011 | £489,749 | 12% |
12 Properties |
| 2010 | £432,499 | 3% |
7 Properties |
| 2009 | £420,800 | -31% |
10 Properties |
| 2008 | £551,350 | -8% |
10 Properties |
| 2007 | £593,260 | 21% |
19 Properties |
| 2006 | £468,012 | 17% |
22 Properties |
| 2005 | £389,383 | 4% |
22 Properties |
| 2004 | £373,880 | 5% |
21 Properties |
| 2003 | £356,787 | -21% |
20 Properties |
| 2002 | £430,540 | 18% |
21 Properties |
| 2001 | £354,307 | 28% |
13 Properties |
| 2000 | £253,721 | 3% |
18 Properties |
| 1999 | £247,125 | 9% |
24 Properties |
| 1998 | £225,730 | 21% |
13 Properties |
| 1997 | £179,389 | 5% |
23 Properties |
| 1996 | £170,157 | -24% |
25 Properties |
| 1995 | £211,113 | - |
11 Properties |
Property Price per Property Type in Mundens And Cottered
Here you can find historic sold price data in order to help with your property search.
The average Property Paid Price for specific property types in the last three years are:
| Property Type | Average Sold Price | Sold Properties |
|---|---|---|
| Semi Detached House | £548,545.00 | 11 Semi Detached Houses |
| Detached House | £978,673.00 | 23 Detached Houses |
| Terraced House | £497,800.00 | 10 Terraced Houses |

