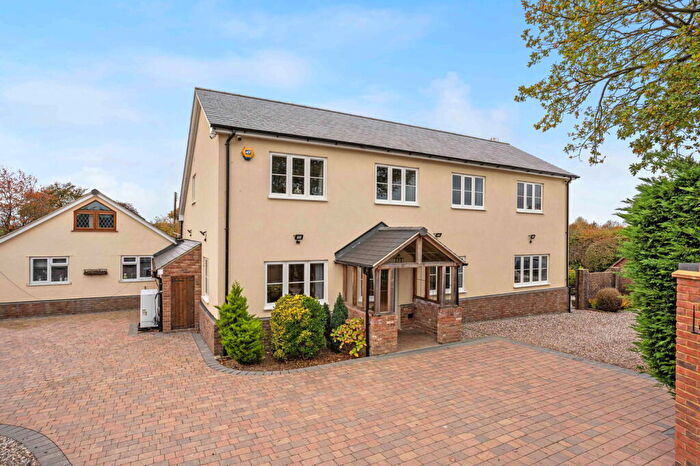
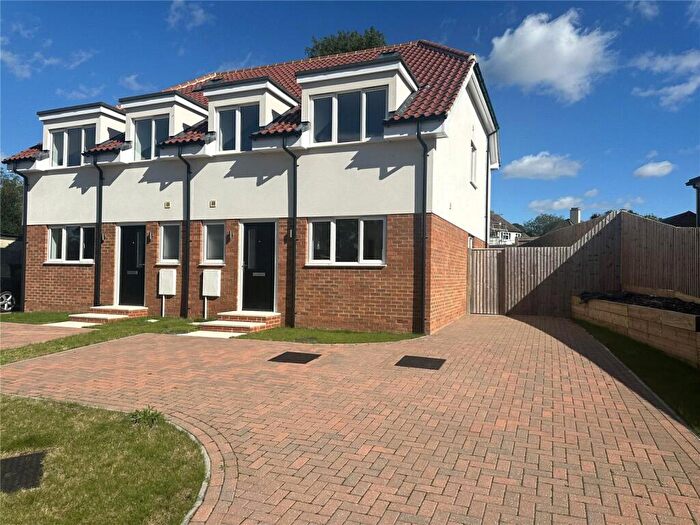
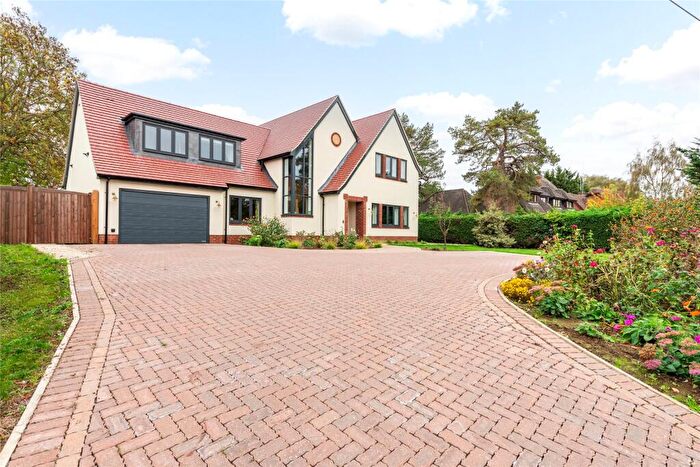
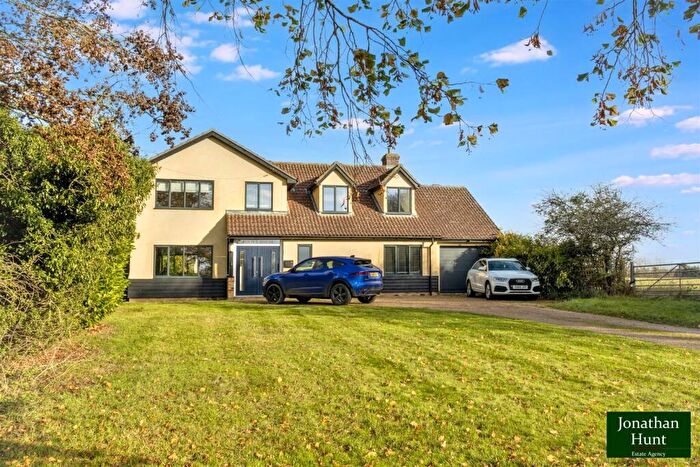
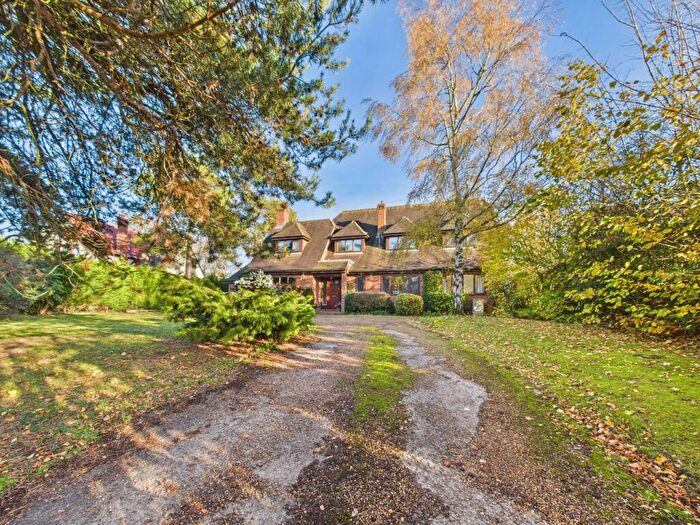
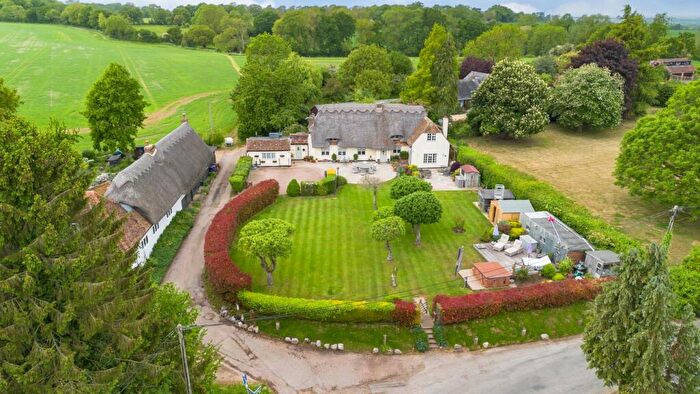
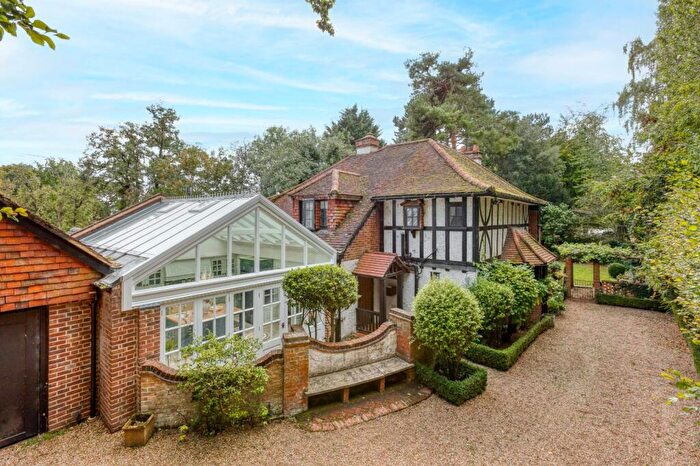
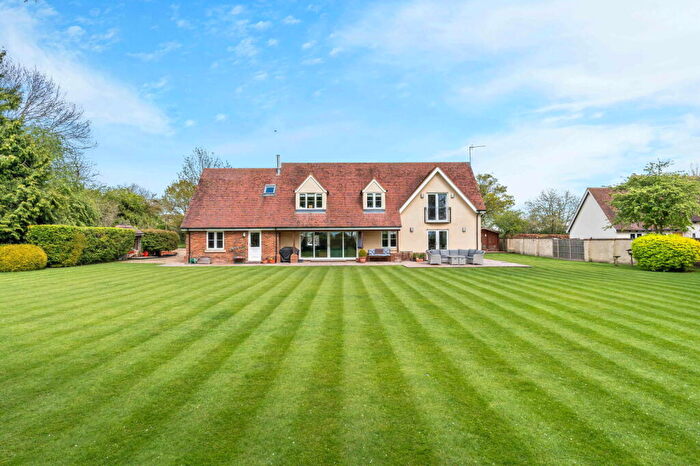
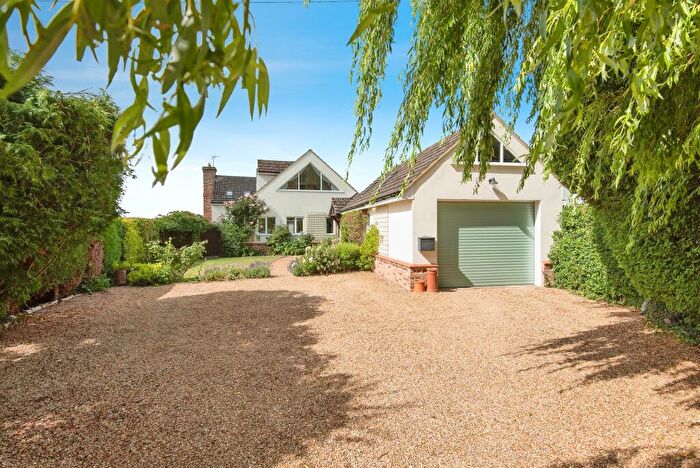
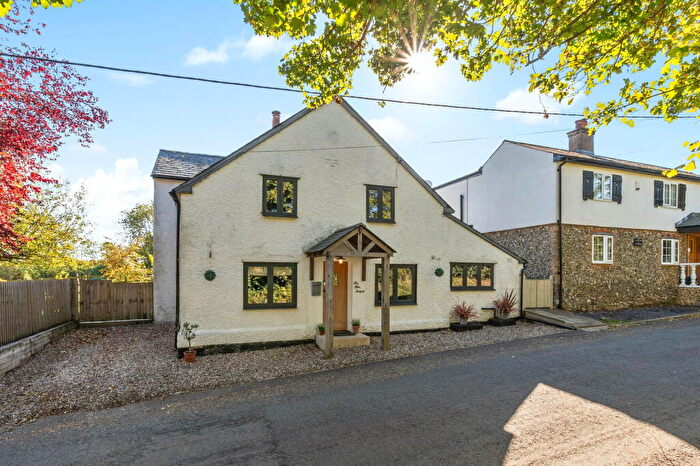
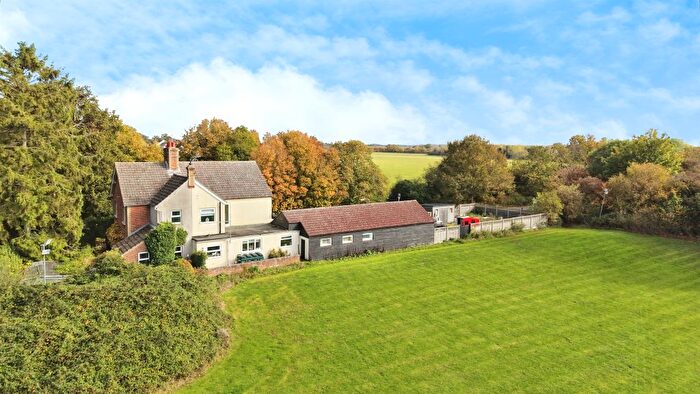
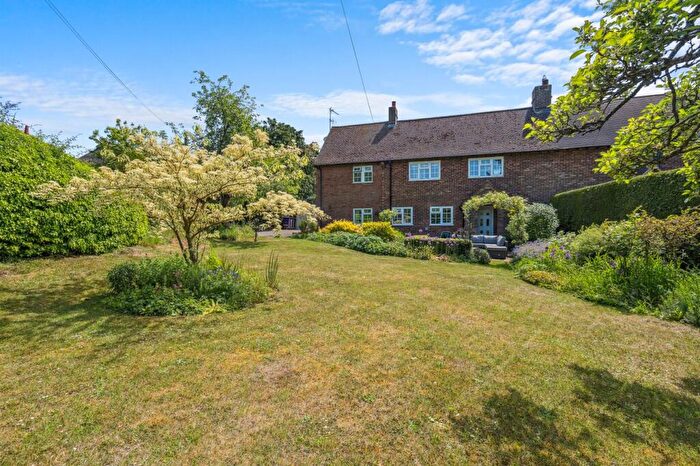
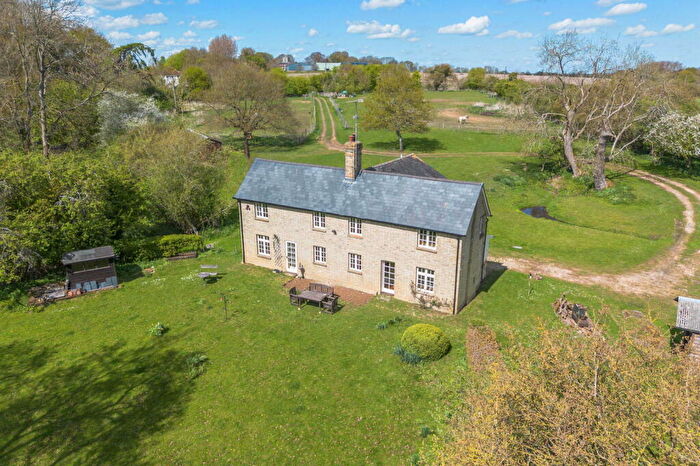
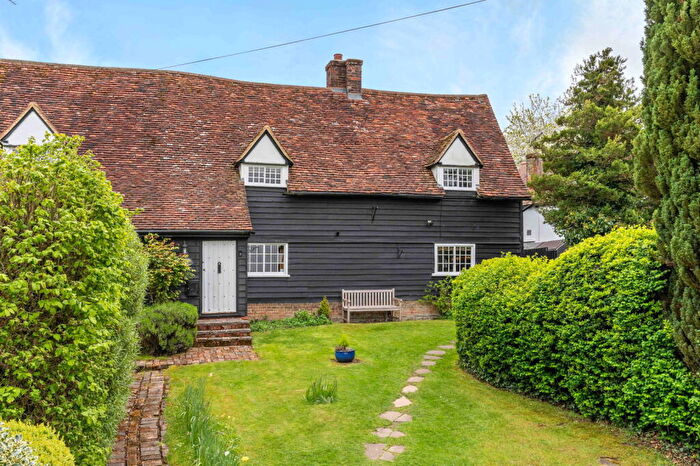
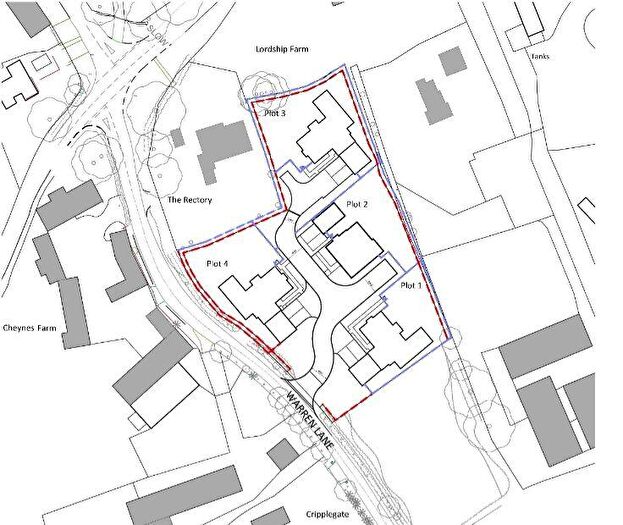
Houses for sale & to rent in Weston And Sandon, Buntingford
House Prices in Weston And Sandon
Properties in Weston And Sandon have an average house price of £767,083.00 and had 18 Property Transactions within the last 3 years¹.
Weston And Sandon is an area in Buntingford, Hertfordshire with 302 households², where the most expensive property was sold for £1,400,000.00.
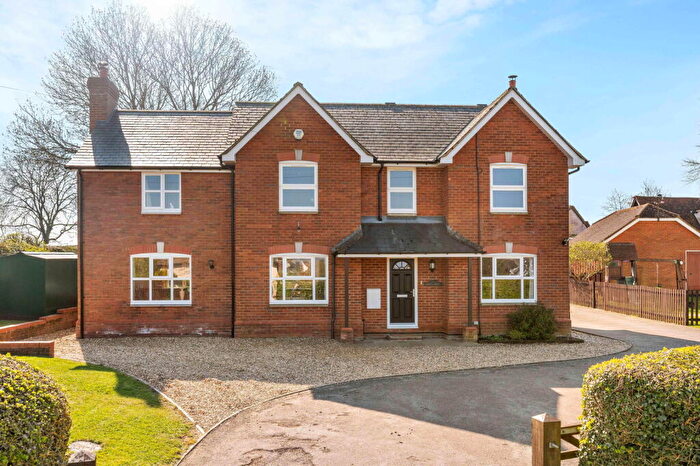
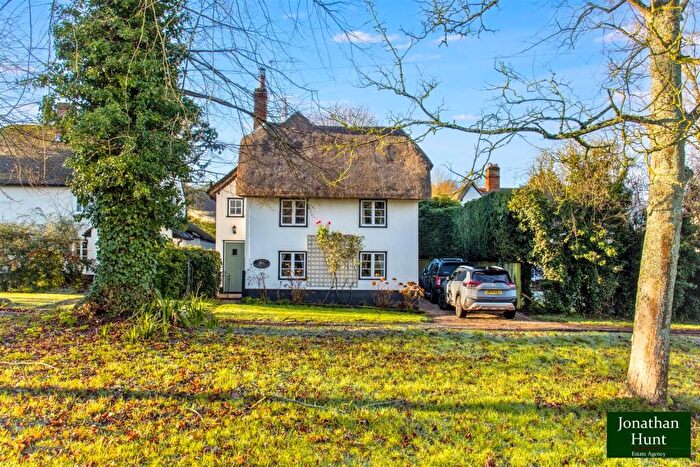
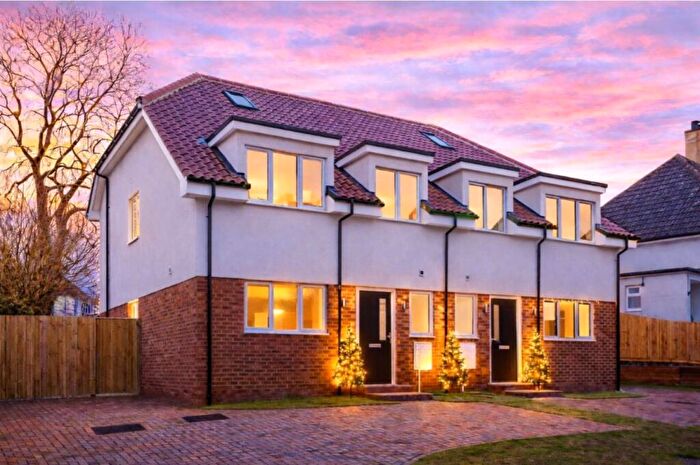
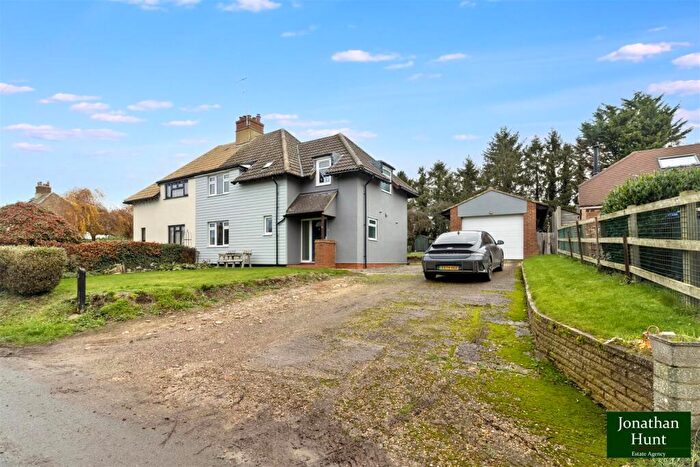
Properties for sale in Weston And Sandon
Previously listed properties in Weston And Sandon
Roads and Postcodes in Weston And Sandon
Navigate through our locations to find the location of your next house in Weston And Sandon, Buntingford for sale or to rent.
| Streets | Postcodes |
|---|---|
| Cumberlow Green | SG9 0QD |
| Dark Lane | SG9 0QT |
| Gannock Green | SG9 0RH |
| Green End | SG9 0RG SG9 0RL SG9 0RQ |
| Hope Close | SG9 0DS |
| Julians Park | SG9 0TD |
| Mill End | SG9 0RN SG9 0RS SG9 0RW SG9 0TA SG9 0TB SG9 0RP SG9 0RR SG9 0SU SG9 0SZ |
| Offley Green | SG9 0TE SG9 0TF |
| Payne End | SG9 0QU |
| Redhill | SG9 0TG SG9 0TH SG9 0TQ |
| Roe Green | SG9 0QE SG9 0QG SG9 0QJ SG9 0QF SG9 0QQ |
| Rushden Road | SG9 0QN SG9 0QR SG9 0QS SG9 0QP |
| Sandon Lane | SG9 0RT |
| Sayfield Cottages | SG9 0QL |
| Southern Green | SG9 0SP SG9 0SR SG9 0SW SG9 0SX SG9 0SY SG9 0SS SG9 0ST |
| Treacle Lane | SG9 0SL |
| SG9 0QX SG9 0RA SG9 0SG SG9 0SH SG9 0SJ SG9 0SN SG9 0QH SG9 0QY SG9 0RB SG9 0RE SG9 0RF SG9 0RJ SG9 0RU SG9 0SQ |
Transport near Weston And Sandon
-
Ashwell and Morden Station
-
Baldock Station
-
Royston Station
-
Letchworth Station
-
Stevenage Station
-
Hitchin Station
-
Arlesey Station
-
Meldreth Station
-
Watton-At-Stone Station
-
Knebworth Station
- FAQ
- Price Paid By Year
- Property Type Price
Frequently asked questions about Weston And Sandon
What is the average price for a property for sale in Weston And Sandon?
The average price for a property for sale in Weston And Sandon is £767,083. This amount is 48% higher than the average price in Buntingford. There are 144 property listings for sale in Weston And Sandon.
What streets have the most expensive properties for sale in Weston And Sandon?
The streets with the most expensive properties for sale in Weston And Sandon are Green End at an average of £1,400,000, Roe Green at an average of £1,275,000 and Gannock Green at an average of £1,037,500.
What streets have the most affordable properties for sale in Weston And Sandon?
The streets with the most affordable properties for sale in Weston And Sandon are Payne End at an average of £560,000, Redhill at an average of £695,000 and Rushden Road at an average of £765,000.
Which train stations are available in or near Weston And Sandon?
Some of the train stations available in or near Weston And Sandon are Ashwell and Morden, Baldock and Royston.
Property Price Paid in Weston And Sandon by Year
The average sold property price by year was:
| Year | Average Sold Price | Price Change |
Sold Properties
|
|---|---|---|---|
| 2025 | £695,000 | -21% |
1 Property |
| 2024 | £839,750 | 15% |
10 Properties |
| 2023 | £711,000 | 18% |
5 Properties |
| 2022 | £580,000 | -24% |
2 Properties |
| 2021 | £720,833 | 17% |
6 Properties |
| 2020 | £596,722 | 2% |
9 Properties |
| 2019 | £585,208 | -27% |
6 Properties |
| 2018 | £740,707 | 21% |
8 Properties |
| 2017 | £581,666 | -6% |
3 Properties |
| 2016 | £614,825 | 25% |
6 Properties |
| 2015 | £458,944 | -35% |
9 Properties |
| 2014 | £620,000 | -18% |
10 Properties |
| 2013 | £731,428 | 20% |
7 Properties |
| 2012 | £584,750 | 34% |
6 Properties |
| 2011 | £386,002 | -42% |
6 Properties |
| 2010 | £546,400 | -3% |
15 Properties |
| 2009 | £562,415 | 1% |
6 Properties |
| 2008 | £556,428 | 2% |
7 Properties |
| 2007 | £544,277 | 31% |
9 Properties |
| 2006 | £374,624 | -31% |
8 Properties |
| 2005 | £491,833 | 19% |
3 Properties |
| 2004 | £398,628 | 1% |
14 Properties |
| 2003 | £394,812 | -2% |
8 Properties |
| 2002 | £400,833 | 29% |
12 Properties |
| 2001 | £283,009 | -3% |
8 Properties |
| 2000 | £291,650 | 19% |
8 Properties |
| 1999 | £237,461 | -2% |
13 Properties |
| 1998 | £241,500 | 27% |
9 Properties |
| 1997 | £176,863 | -2% |
11 Properties |
| 1996 | £180,458 | -5% |
12 Properties |
| 1995 | £189,886 | - |
11 Properties |
Property Price per Property Type in Weston And Sandon
Here you can find historic sold price data in order to help with your property search.
The average Property Paid Price for specific property types in the last three years are:
| Property Type | Average Sold Price | Sold Properties |
|---|---|---|
| Semi Detached House | £540,000.00 | 3 Semi Detached Houses |
| Detached House | £870,192.00 | 13 Detached Houses |
| Terraced House | £437,500.00 | 2 Terraced Houses |

