
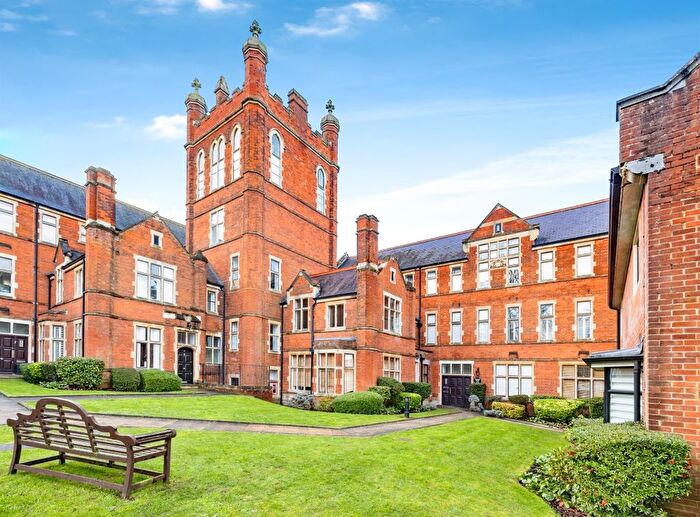
Houses for sale & to rent in Oxhey, Bushey
House Prices in Oxhey
Properties in Oxhey have an average house price of £388k and had 3 Property Transactions within the last 3 years¹.
Oxhey is an area in Bushey, Hertfordshire with 113 households², where the most expensive property was sold for £550k.
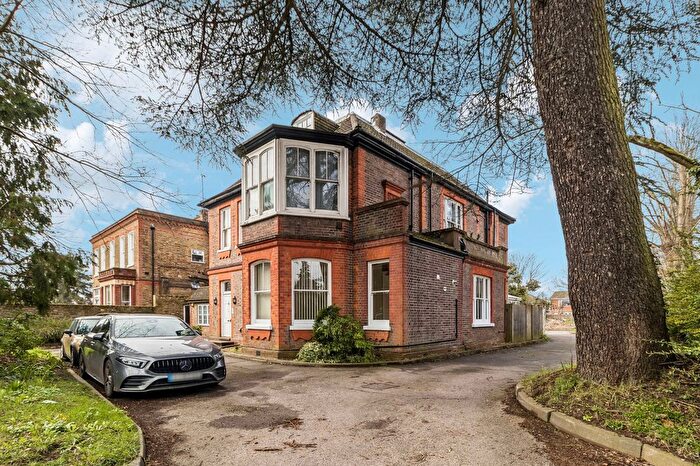
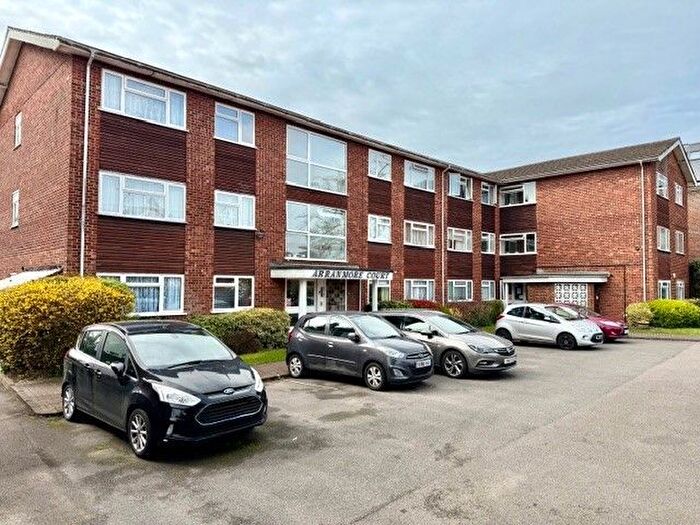
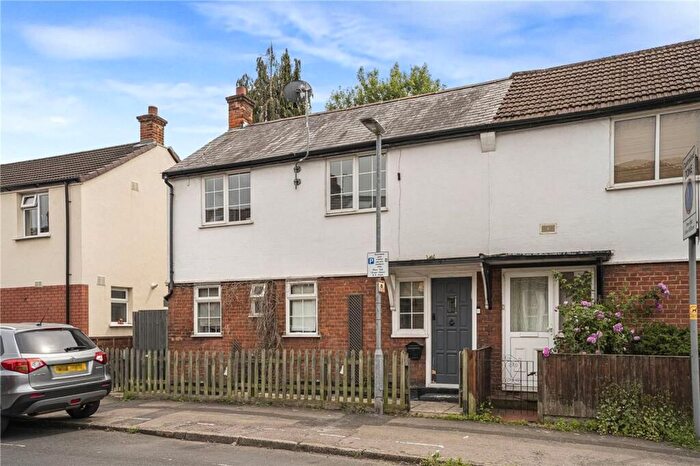
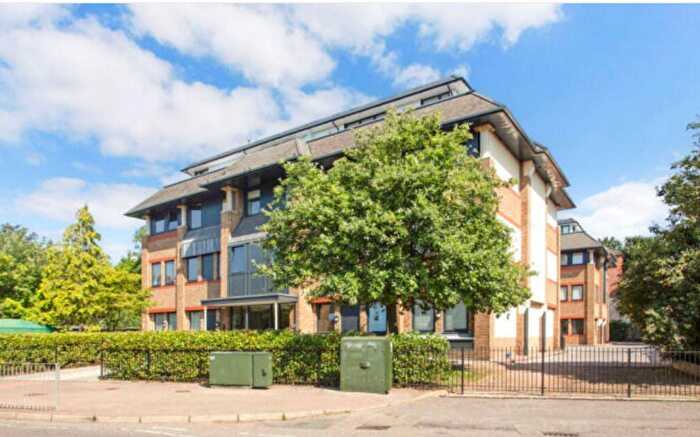
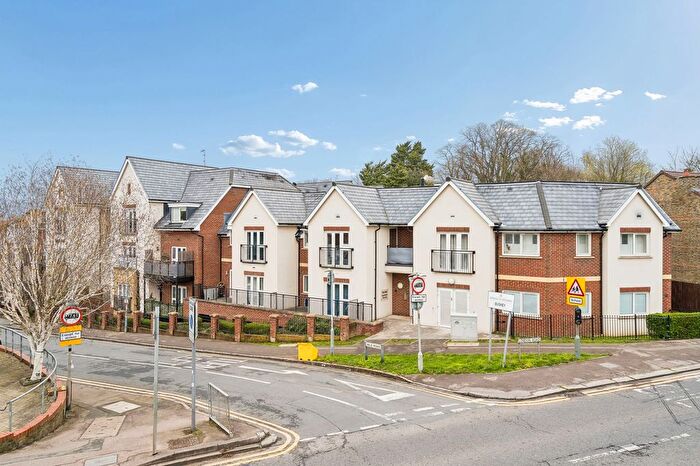
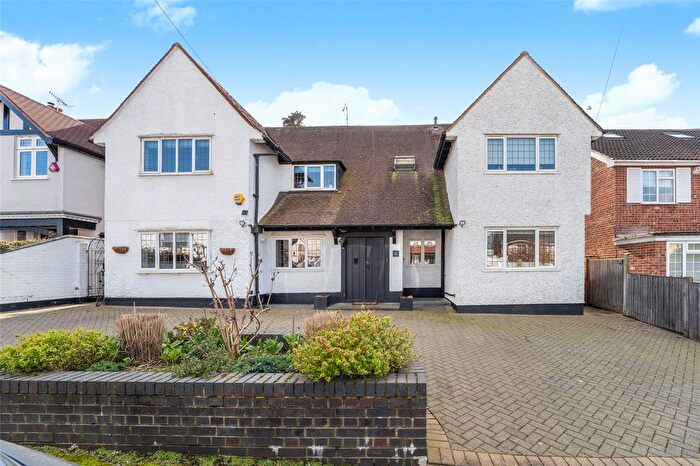
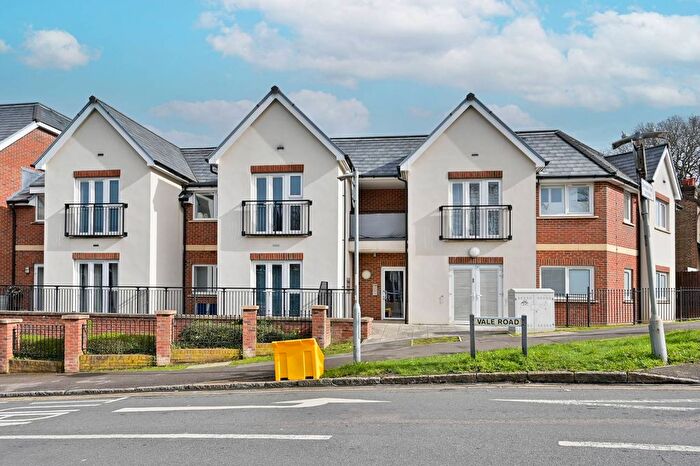
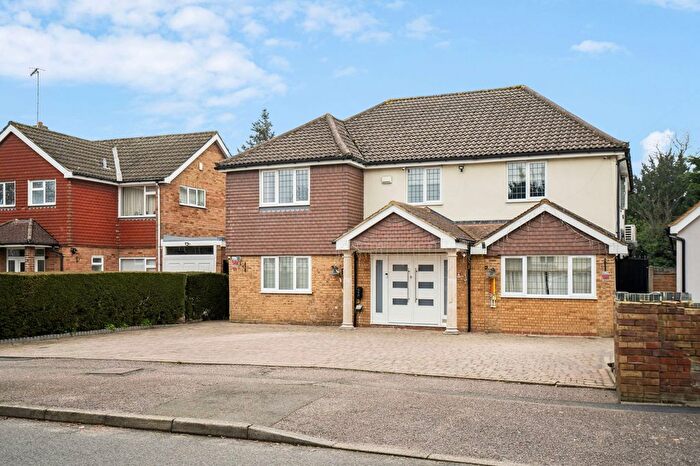
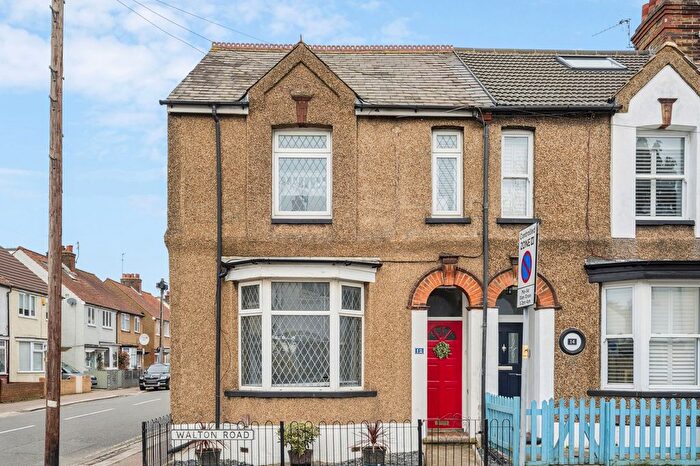
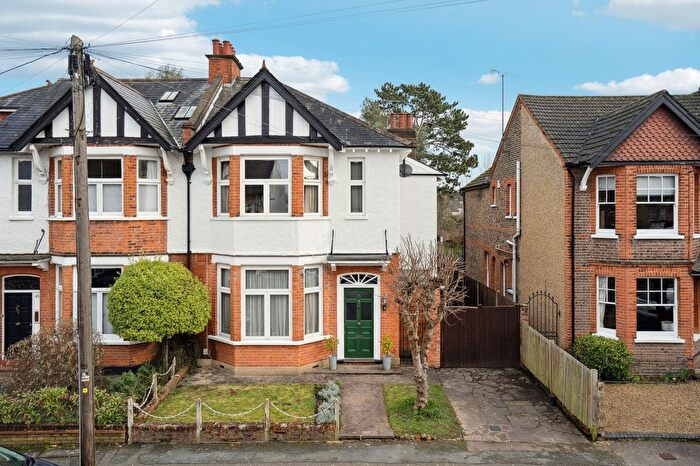
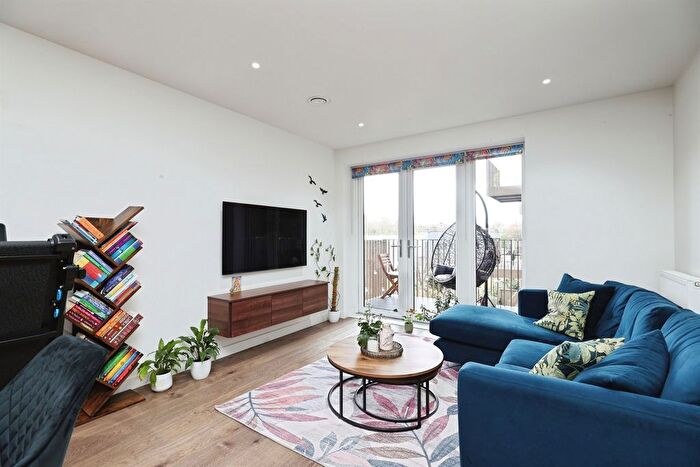
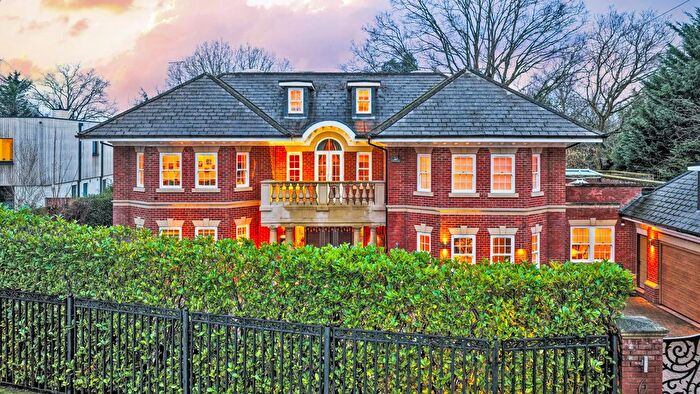
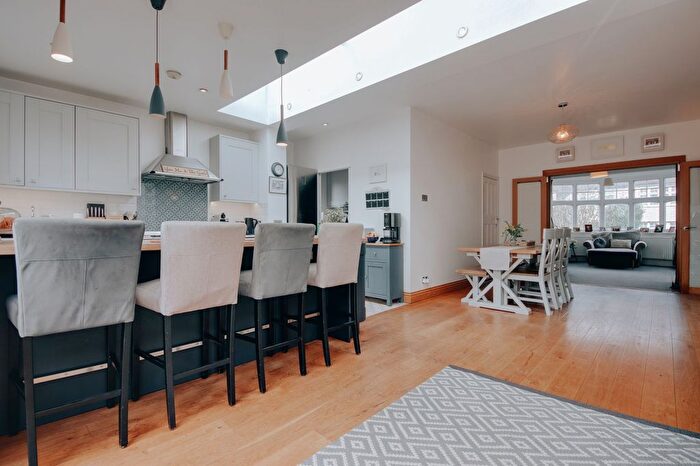
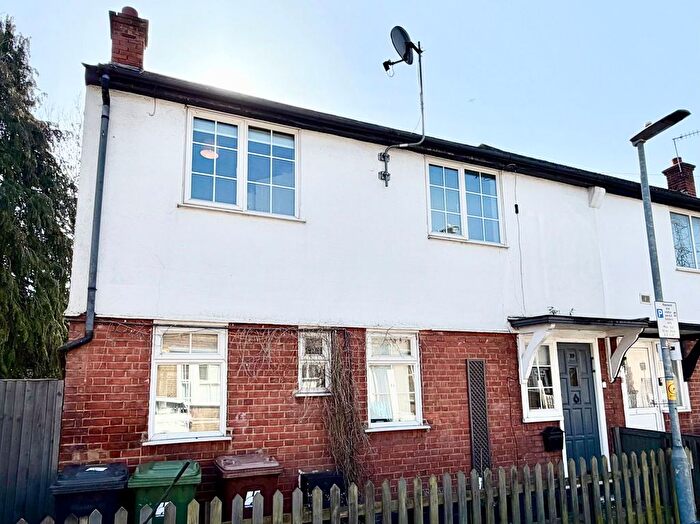
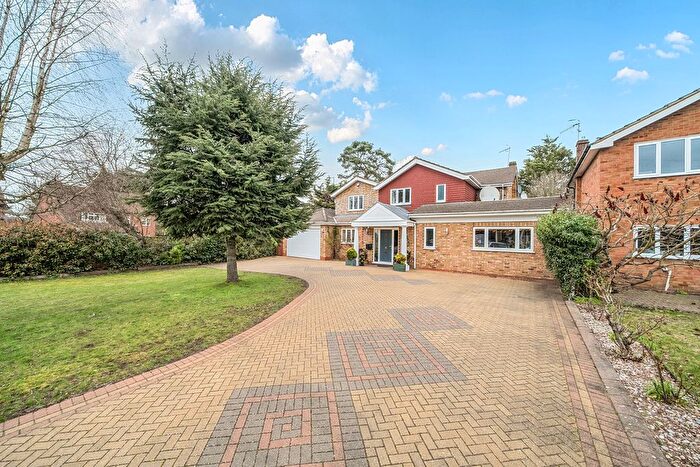
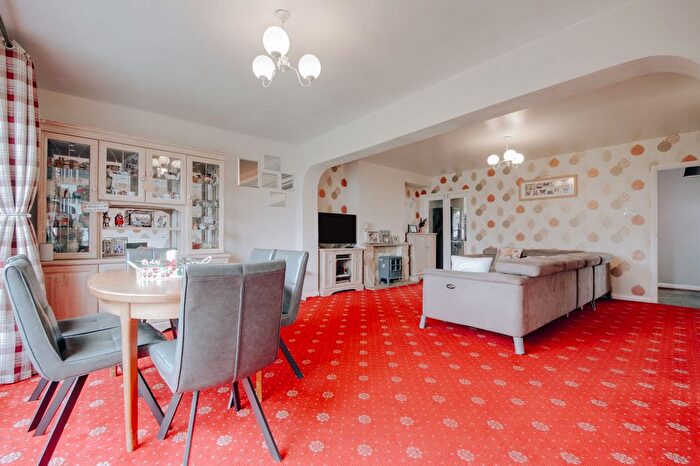
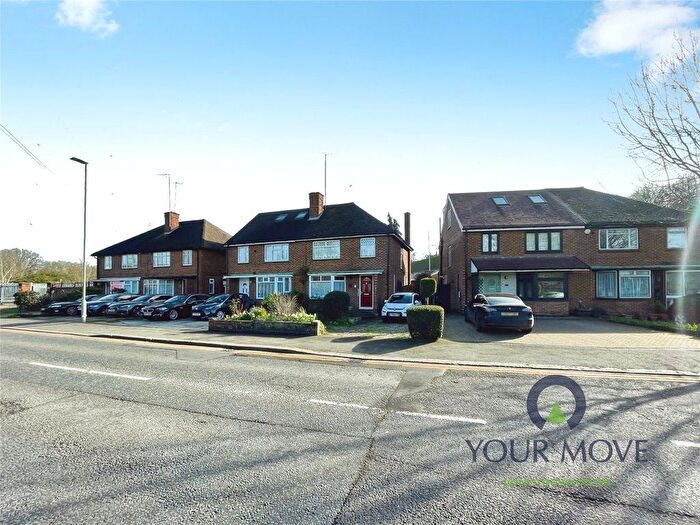
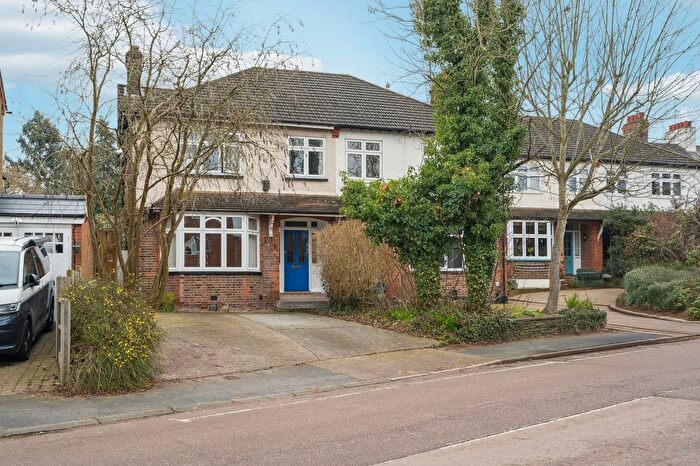
Properties for sale in Oxhey
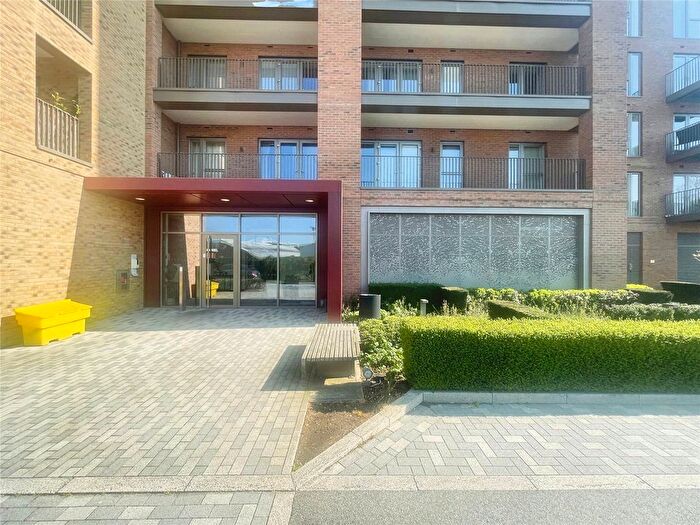
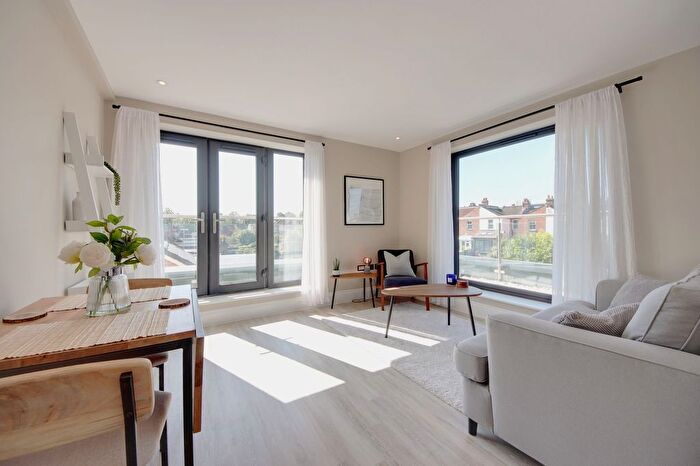
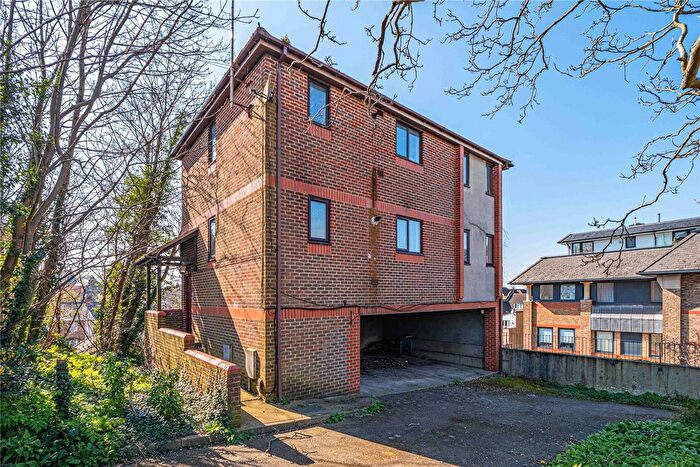
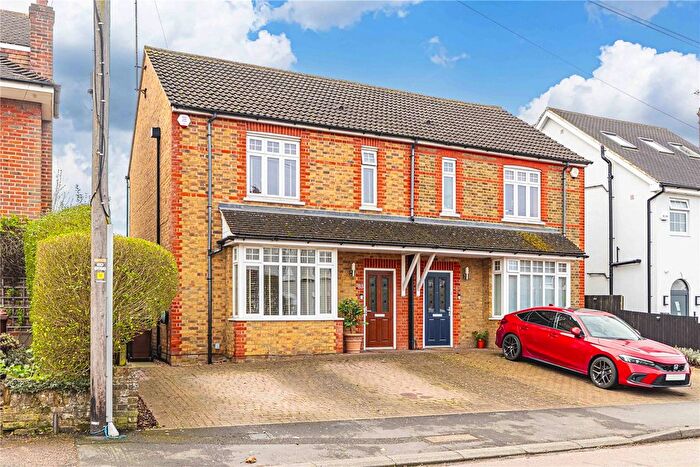
![]()
If you are looking to sell your house, let it out, or receive a property valuation, an expert can help you.
Click the button below to get started.

Roads and Postcodes in Oxhey
Navigate through our locations to find the location of your next house in Oxhey, Bushey for sale or to rent.
Transport near Oxhey
-

 Bushey Station
 -
Watford High Street Station
-
Watford Junction Station
-
Carpenders Park Station
-
 Watford Station
 -
Watford North Station
-
Moor Park Station
-
Croxley Station
-
Hatch End Station
-
Garston (Hertfordshire) Station
- FAQ
- Price Paid By Year
- Property Type Price
Frequently asked questions about Oxhey
What is the average price for a property for sale in Oxhey?
The average price for a property for sale in Oxhey is £387,500. This amount is 33% lower than the average price in Bushey. There are 1,476 property listings for sale in Oxhey.
Which train stations are available in or near Oxhey?
Some of the train stations available in or near Oxhey are Bushey, Watford High Street and Watford Junction.
Which tube stations are available in or near Oxhey?
Some of the tube stations available in or near Oxhey are Watford, Moor Park and Croxley.
Property Price Paid in Oxhey by Year
The average sold property price by year was:
| Year | Average Sold Price | Price Change |
Sold Properties
|
|---|---|---|---|
| 2024 | £292,500 | -49% |
1 Property |
| 2023 | £435,000 | 41% |
2 Properties |
| 2022 | £254,983 | -78% |
3 Properties |
| 2021 | £454,125 | 49% |
4 Properties |
| 2020 | £232,750 | -249% |
2 Properties |
| 2019 | £811,500 | 68% |
1 Property |
| 2018 | £259,500 | -29% |
2 Properties |
| 2017 | £335,666 | -90% |
3 Properties |
| 2016 | £637,500 | 42% |
2 Properties |
| 2015 | £368,333 | 33% |
3 Properties |
| 2014 | £246,593 | -45% |
8 Properties |
| 2013 | £358,000 | 59% |
1 Property |
| 2012 | £147,000 | -31% |
1 Property |
| 2011 | £192,500 | 39% |
2 Properties |
| 2010 | £117,737 | -18% |
4 Properties |
| 2009 | £139,000 | -194% |
2 Properties |
| 2008 | £408,750 | 53% |
2 Properties |
| 2007 | £191,380 | -3% |
13 Properties |
| 2006 | £197,100 | 0,2% |
5 Properties |
| 2005 | £196,666 | 13% |
6 Properties |
| 2004 | £171,833 | -15% |
6 Properties |
| 2003 | £197,916 | 33% |
6 Properties |
| 2002 | £133,316 | 20% |
3 Properties |
| 2001 | £106,000 | -2% |
5 Properties |
| 2000 | £108,400 | 37% |
5 Properties |
| 1999 | £68,450 | -23% |
11 Properties |
| 1998 | £84,456 | 26% |
8 Properties |
| 1997 | £62,392 | 34% |
7 Properties |
| 1996 | £41,000 | -48% |
1 Property |
| 1995 | £60,785 | - |
7 Properties |
Property Price per Property Type in Oxhey
Here you can find historic sold price data in order to help with your property search.
The average Property Paid Price for specific property types in the last three years are:
| Property Type | Average Sold Price | Sold Properties |
|---|---|---|
| Semi Detached House | £550,000.00 | 1 Semi Detached House |
| Flat | £306,250.00 | 2 Flats |