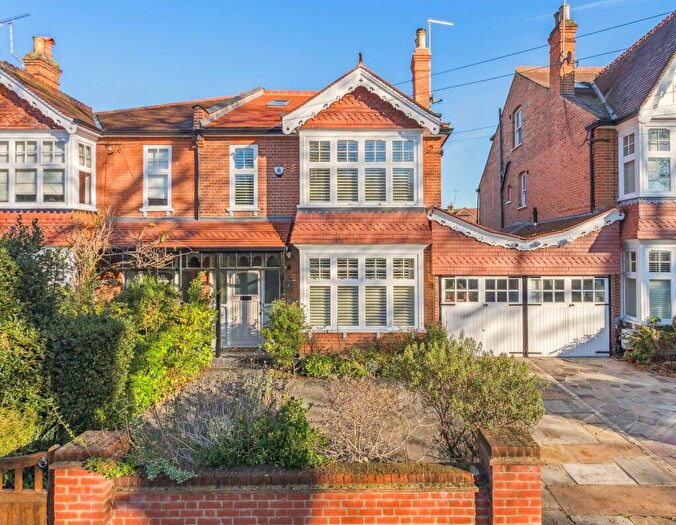
Houses for sale & to rent in Bushey, Hertfordshire
House Prices in Bushey
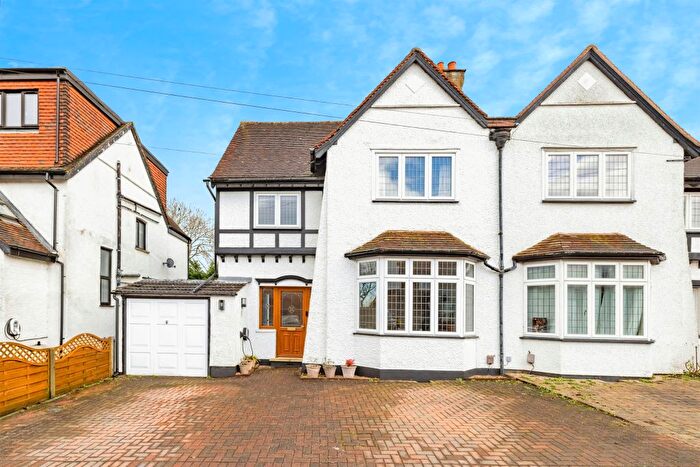
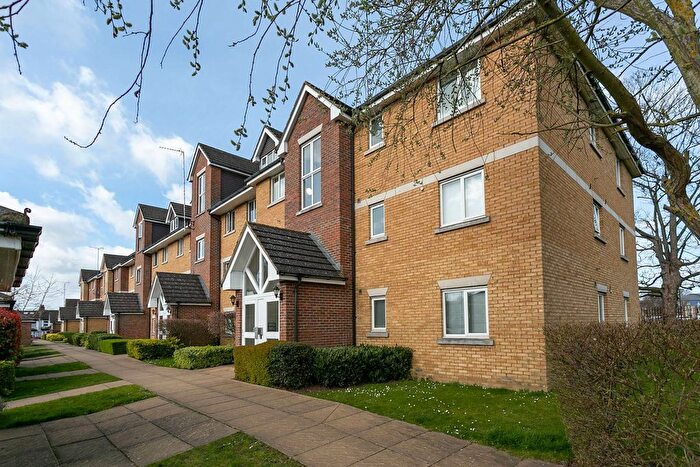
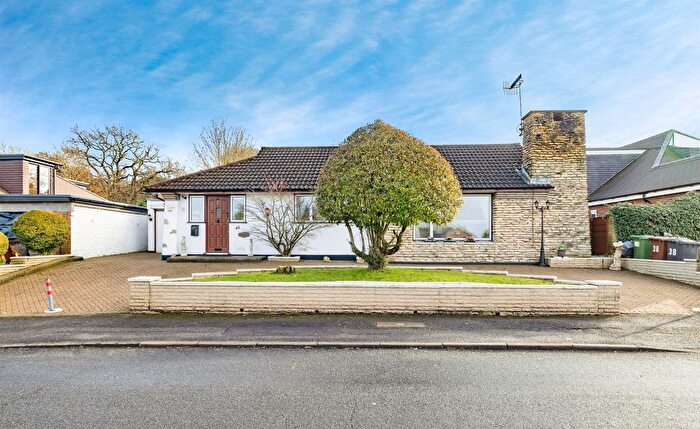
Properties in Bushey have an average house price of £576,036.00 and had 1,003 Property Transactions within the last 3 years.¹
Bushey is an area in Hertfordshire with 10,180 households², where the most expensive property was sold for £4,250,000.00.
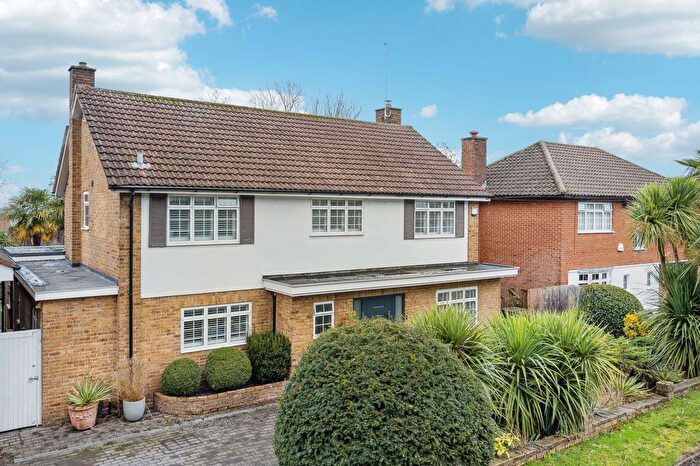
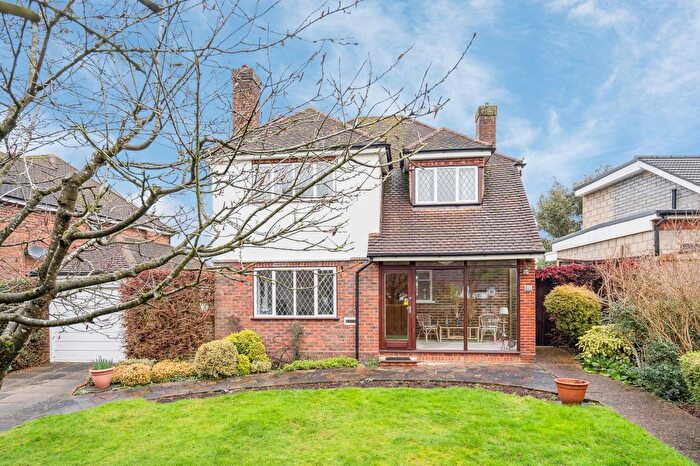
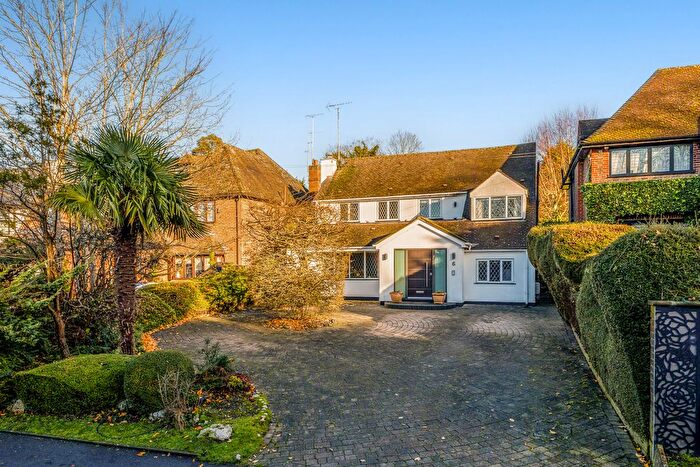
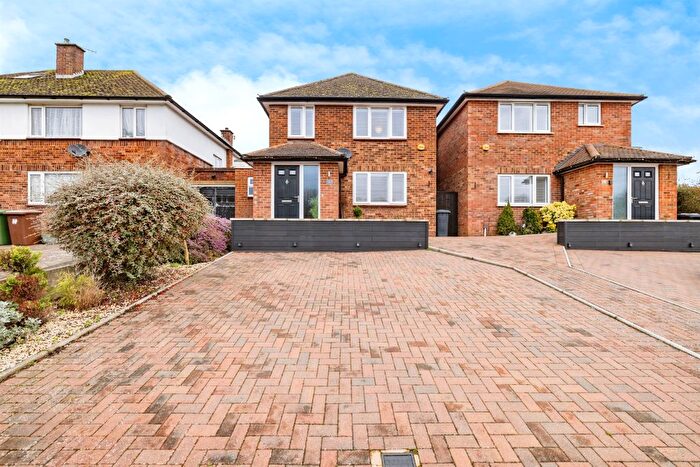
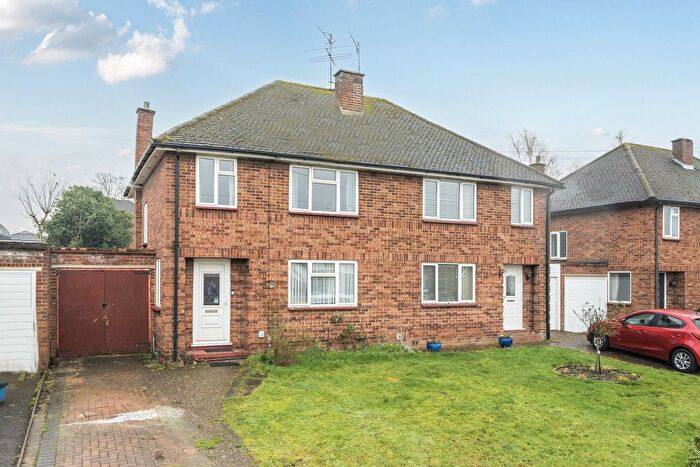
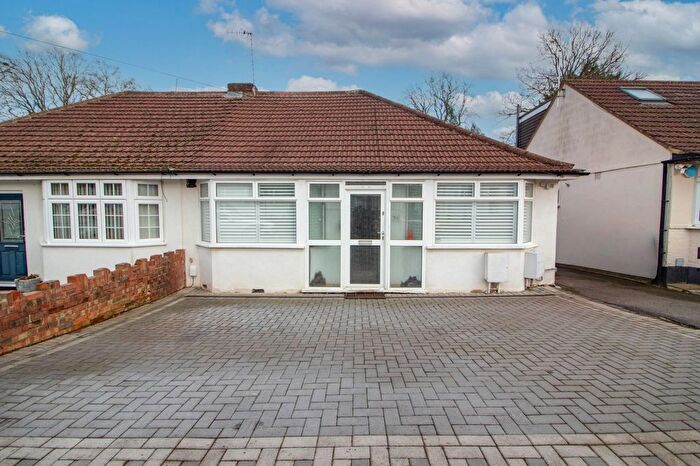
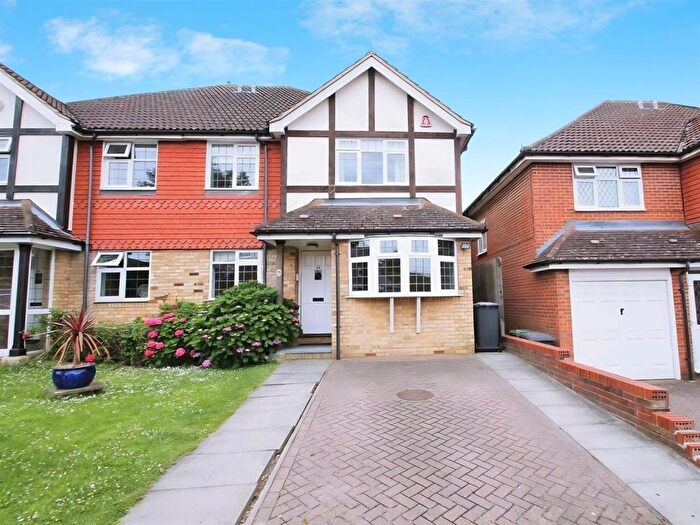
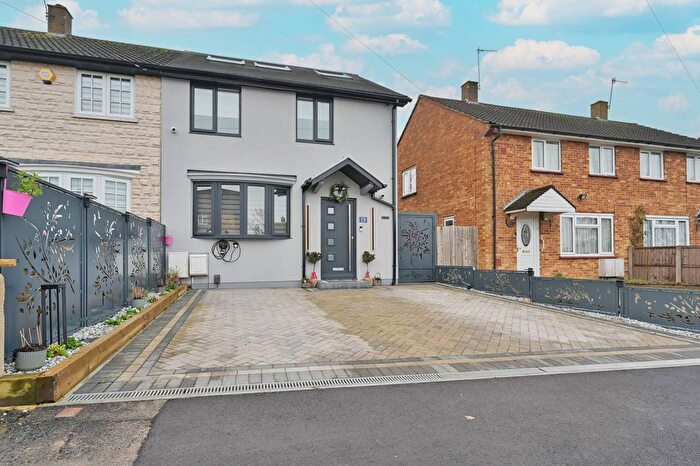
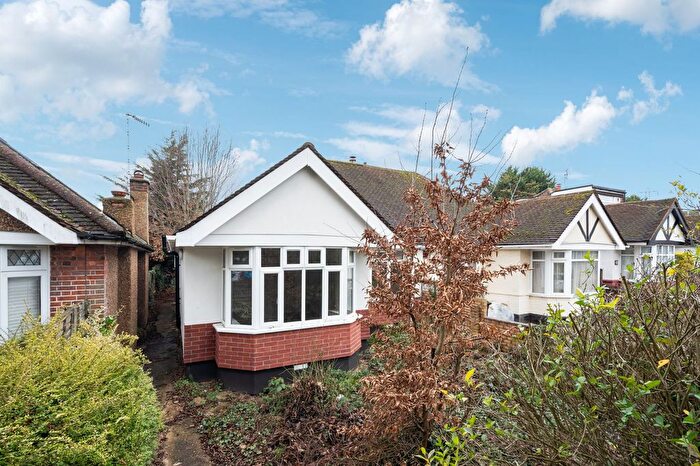
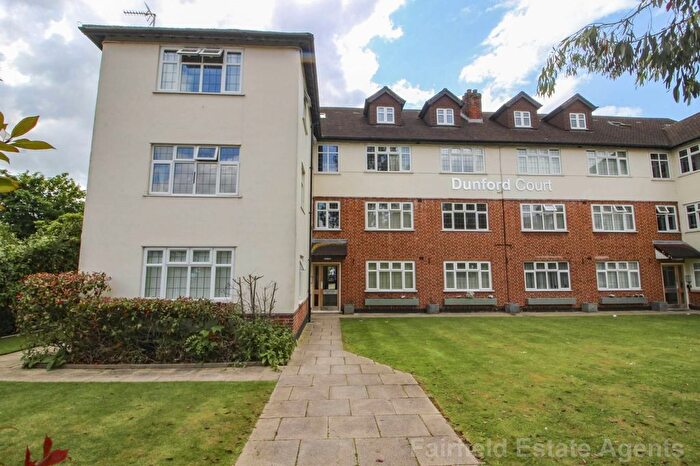
Properties for sale in Bushey
Neighbourhoods in Bushey
Navigate through our locations to find the location of your next house in Bushey, Hertfordshire for sale or to rent.
Transport in Bushey
Please see below transportation links in this area:
-
Bushey Station
-
Watford High Street Station
-
Carpenders Park Station
-
Watford Junction Station
-
Hatch End Station
-
Watford North Station
-
Watford Station
-
Headstone Lane Station
-
Stanmore Station
- FAQ
- Price Paid By Year
- Property Type Price
Frequently asked questions about Bushey
What is the average price for a property for sale in Bushey?
The average price for a property for sale in Bushey is £576,036. This amount is 8% higher than the average price in Hertfordshire. There are 6,885 property listings for sale in Bushey.
What locations have the most expensive properties for sale in Bushey?
The locations with the most expensive properties for sale in Bushey are Bushey Heath at an average of £666,183, Bushey St James at an average of £585,731 and Bushey Park at an average of £555,632.
What locations have the most affordable properties for sale in Bushey?
The locations with the most affordable properties for sale in Bushey are Oxhey at an average of £387,500 and Bushey North at an average of £474,739.
Which train stations are available in or near Bushey?
Some of the train stations available in or near Bushey are Bushey, Watford High Street and Carpenders Park.
Which tube stations are available in or near Bushey?
Some of the tube stations available in or near Bushey are Watford and Stanmore.
Property Price Paid in Bushey by Year
The average sold property price by year was:
| Year | Average Sold Price | Price Change |
Sold Properties
|
|---|---|---|---|
| 2025 | £594,950 | 8% |
308 Properties |
| 2024 | £545,946 | -9% |
391 Properties |
| 2023 | £595,574 | -1% |
304 Properties |
| 2022 | £600,025 | 4% |
416 Properties |
| 2021 | £578,387 | 10% |
523 Properties |
| 2020 | £522,252 | 3% |
407 Properties |
| 2019 | £506,770 | -8% |
437 Properties |
| 2018 | £545,206 | - |
401 Properties |
| 2017 | £545,256 | 1% |
478 Properties |
| 2016 | £540,052 | 9% |
485 Properties |
| 2015 | £494,018 | 8% |
524 Properties |
| 2014 | £453,558 | 14% |
548 Properties |
| 2013 | £389,752 | 9% |
471 Properties |
| 2012 | £356,219 | 5% |
341 Properties |
| 2011 | £336,782 | -5% |
374 Properties |
| 2010 | £355,259 | 11% |
353 Properties |
| 2009 | £315,314 | -18% |
331 Properties |
| 2008 | £372,833 | 13% |
316 Properties |
| 2007 | £323,930 | 10% |
565 Properties |
| 2006 | £290,853 | 3% |
574 Properties |
| 2005 | £282,335 | 3% |
439 Properties |
| 2004 | £274,332 | 5% |
467 Properties |
| 2003 | £261,213 | 13% |
535 Properties |
| 2002 | £228,191 | 6% |
617 Properties |
| 2001 | £215,002 | 19% |
594 Properties |
| 2000 | £173,539 | 4% |
516 Properties |
| 1999 | £166,562 | 17% |
603 Properties |
| 1998 | £138,429 | 11% |
614 Properties |
| 1997 | £122,894 | 12% |
539 Properties |
| 1996 | £108,093 | 3% |
478 Properties |
| 1995 | £104,310 | - |
452 Properties |
Property Price per Property Type in Bushey
Here you can find historic sold price data in order to help with your property search.
The average Property Paid Price for specific property types in the last three years are:
| Property Type | Average Sold Price | Sold Properties |
|---|---|---|
| Semi Detached House | £615,645.00 | 248 Semi Detached Houses |
| Detached House | £941,724.00 | 200 Detached Houses |
| Terraced House | £484,971.00 | 218 Terraced Houses |
| Flat | £388,770.00 | 337 Flats |

