
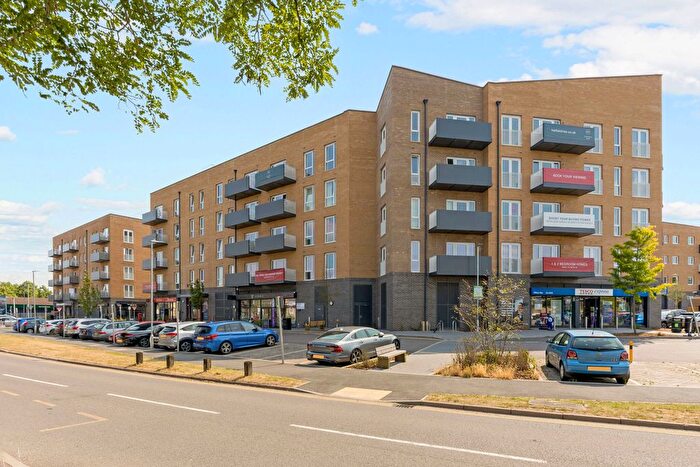
Houses for sale & to rent in Hatfield South, Hatfield
House Prices in Hatfield South
Properties in Hatfield South have an average house price of £337k and had 153 Property Transactions within the last 3 years¹.
Hatfield South is an area in Hatfield, Hertfordshire with 2,109 households², where the most expensive property was sold for £4.43M.
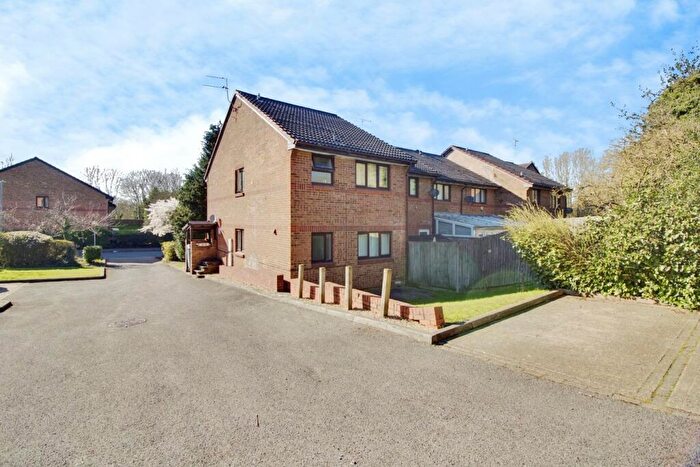
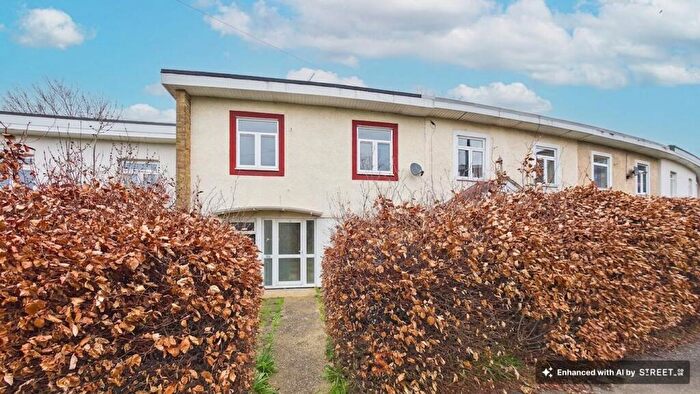
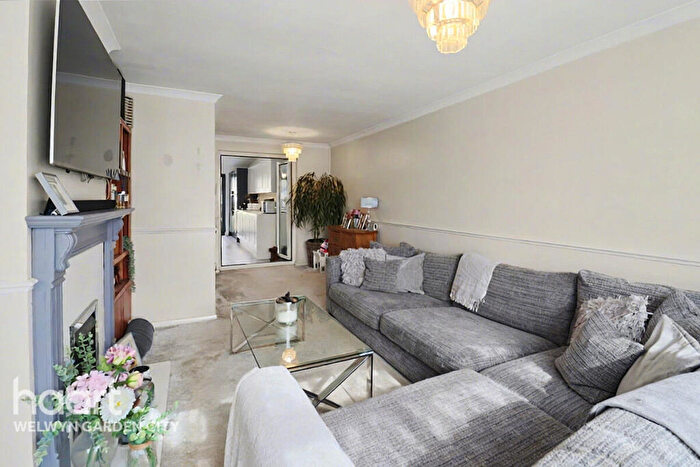
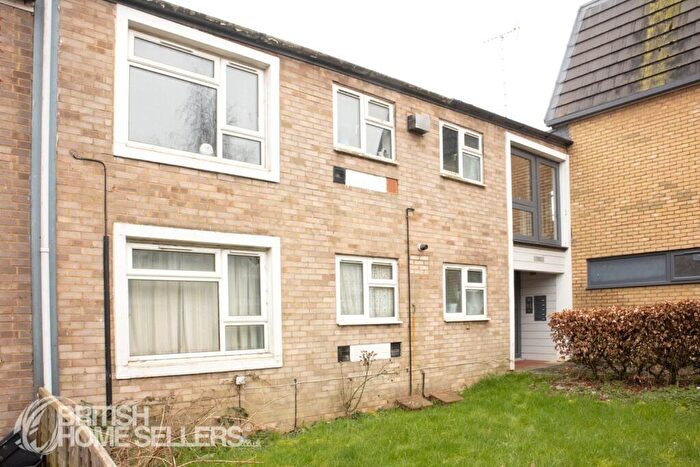
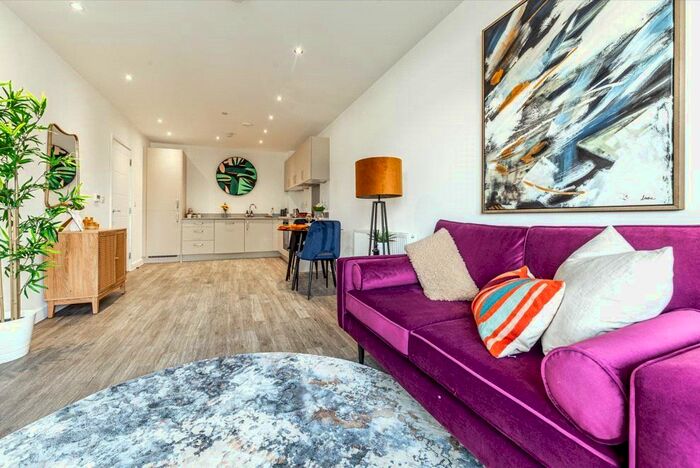
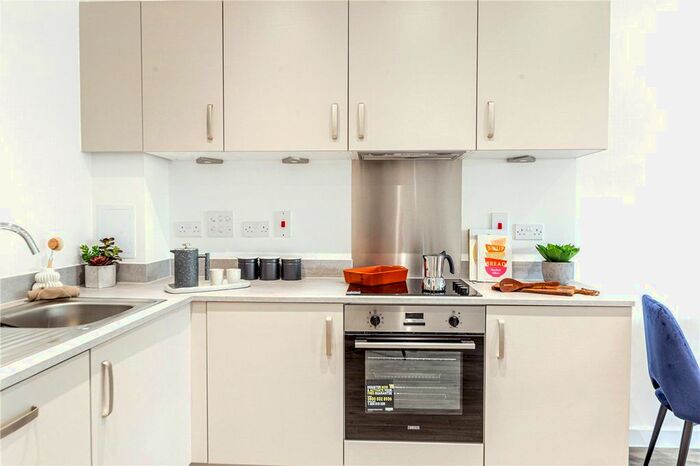
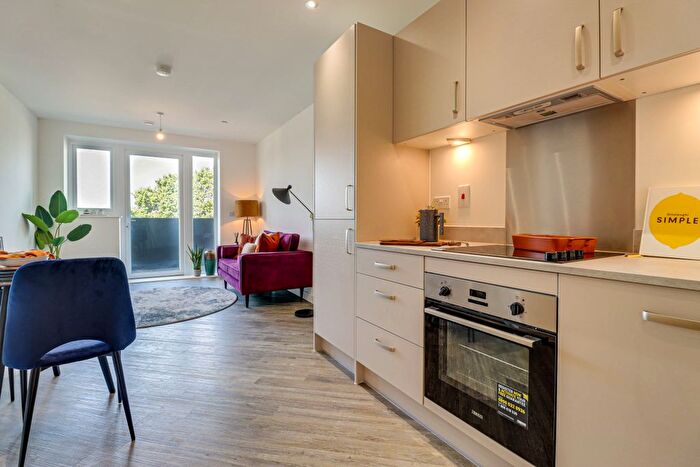
Properties for sale in Hatfield South
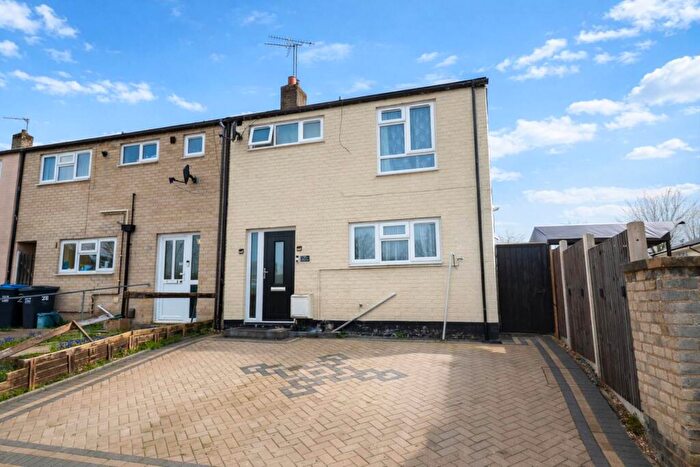
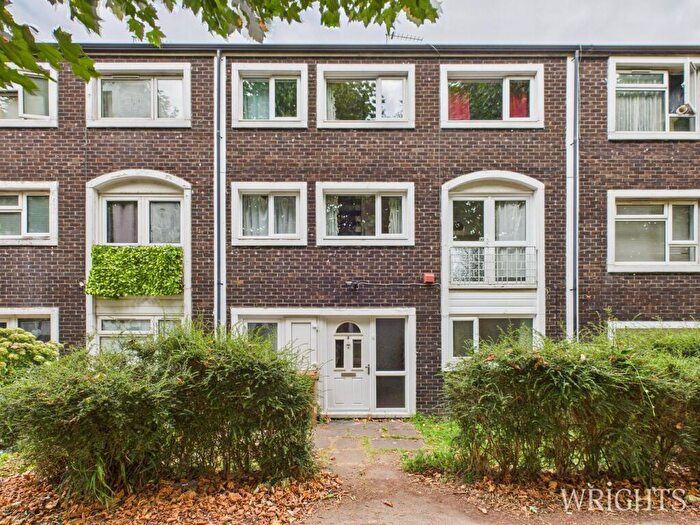
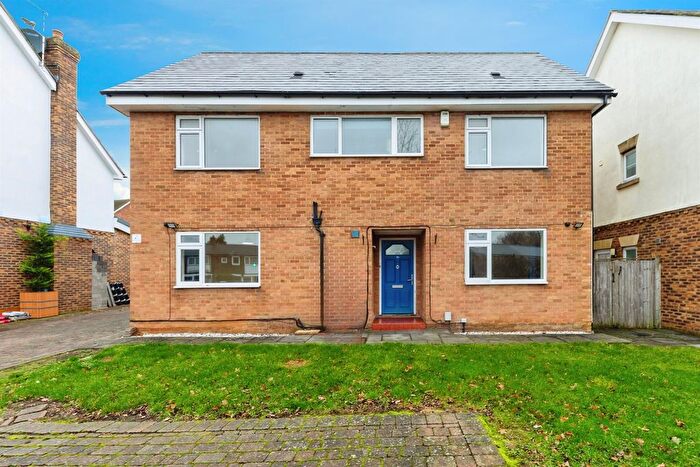
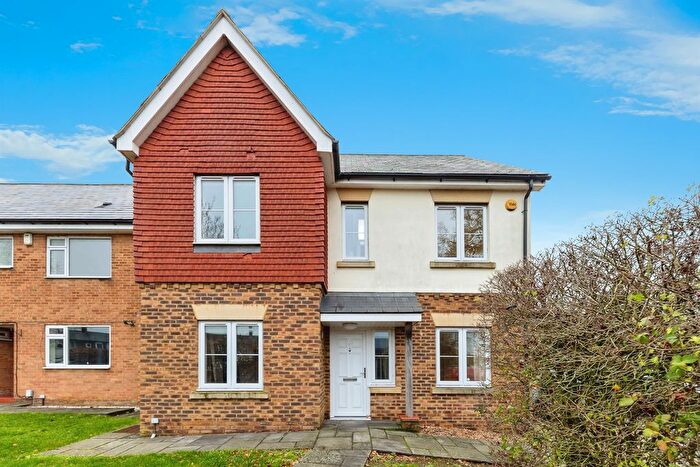
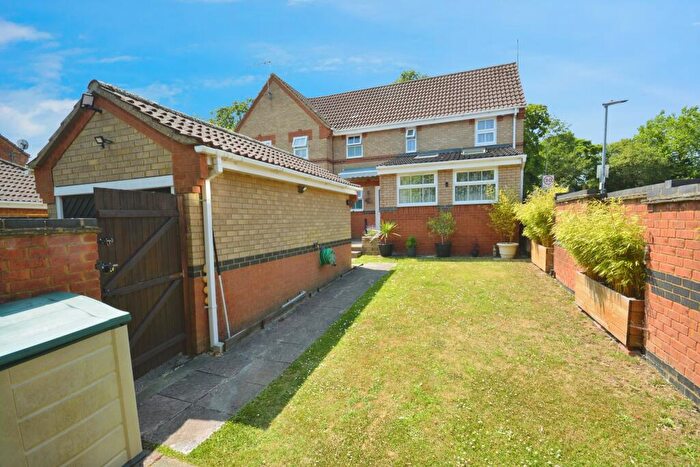
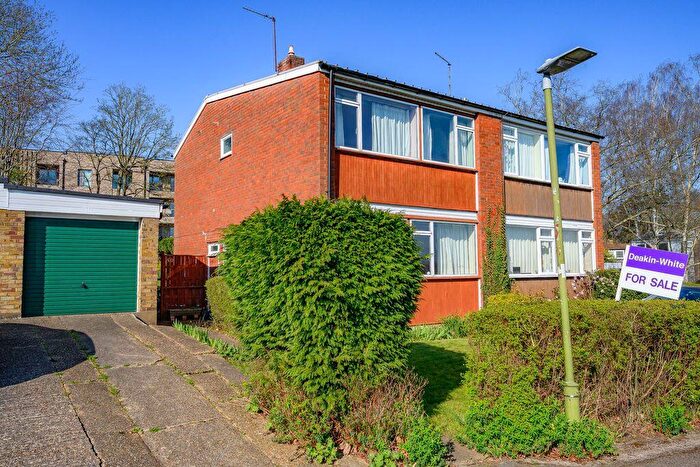
![]()
If you are looking to sell your house, let it out, or receive a property valuation, an expert can help you.
Click the button below to get started.


Roads and Postcodes in Hatfield South
Navigate through our locations to find the location of your next house in Hatfield South, Hatfield for sale or to rent.
Transport near Hatfield South

- FAQ
- Price Paid By Year
- Property Type Price
Frequently asked questions about Hatfield South
What is the average price for a property for sale in Hatfield South?
The average price for a property for sale in Hatfield South is £337,418. This amount is 31% lower than the average price in Hatfield. There are 955 property listings for sale in Hatfield South.
What streets have the most expensive properties for sale in Hatfield South?
The streets with the most expensive properties for sale in Hatfield South are Bishops Rise at an average of £700,727, Lark Rise at an average of £595,000 and Brickfield at an average of £490,000.
What streets have the most affordable properties for sale in Hatfield South?
The streets with the most affordable properties for sale in Hatfield South are Woodpecker Close at an average of £183,750, Redhall Close at an average of £187,437 and Five Oaks at an average of £200,000.
Which train stations are available in or near Hatfield South?
Some of the train stations available in or near Hatfield South are Welham Green, Hatfield and Brookman's Park.
Property Price Paid in Hatfield South by Year
The average sold property price by year was:
| Year | Average Sold Price | Price Change |
Sold Properties
|
|---|---|---|---|
| 2025 | £298,286 | -28% |
58 Properties |
| 2024 | £381,888 | 11% |
50 Properties |
| 2023 | £338,444 | 2% |
45 Properties |
| 2022 | £332,128 | 8% |
47 Properties |
| 2021 | £304,002 | 7% |
81 Properties |
| 2020 | £284,143 | 10% |
53 Properties |
| 2019 | £254,497 | -13% |
48 Properties |
| 2018 | £288,674 | -1% |
65 Properties |
| 2017 | £290,424 | 10% |
67 Properties |
| 2016 | £260,143 | 11% |
57 Properties |
| 2015 | £231,842 | 14% |
78 Properties |
| 2014 | £198,960 | 7% |
94 Properties |
| 2013 | £185,130 | 2% |
65 Properties |
| 2012 | £181,199 | 3% |
48 Properties |
| 2011 | £175,006 | -4% |
65 Properties |
| 2010 | £181,297 | 9% |
66 Properties |
| 2009 | £164,643 | -14% |
41 Properties |
| 2008 | £186,950 | 5% |
62 Properties |
| 2007 | £178,237 | 2% |
146 Properties |
| 2006 | £175,128 | 3% |
134 Properties |
| 2005 | £169,831 | 1% |
107 Properties |
| 2004 | £168,607 | 13% |
126 Properties |
| 2003 | £146,075 | 17% |
145 Properties |
| 2002 | £121,647 | 17% |
126 Properties |
| 2001 | £101,073 | 10% |
119 Properties |
| 2000 | £90,780 | 17% |
121 Properties |
| 1999 | £75,497 | 5% |
112 Properties |
| 1998 | £71,663 | 12% |
108 Properties |
| 1997 | £62,885 | 14% |
99 Properties |
| 1996 | £53,800 | -5% |
100 Properties |
| 1995 | £56,379 | - |
91 Properties |
Property Price per Property Type in Hatfield South
Here you can find historic sold price data in order to help with your property search.
The average Property Paid Price for specific property types in the last three years are:
| Property Type | Average Sold Price | Sold Properties |
|---|---|---|
| Semi Detached House | £657,071.00 | 14 Semi Detached Houses |
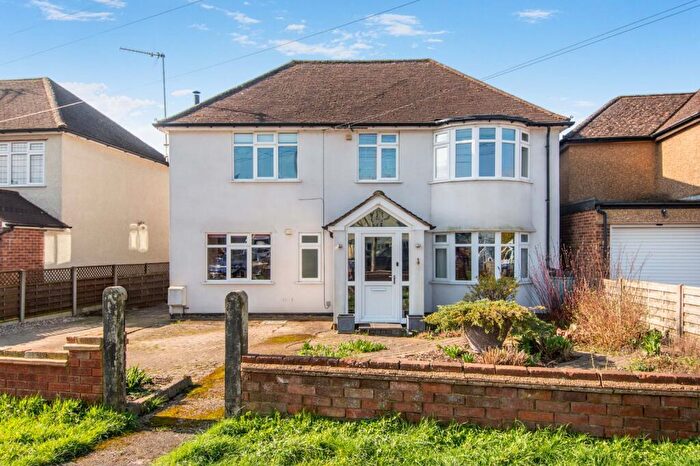
| Detached House | £524,500.00 | 2 Detached Houses |
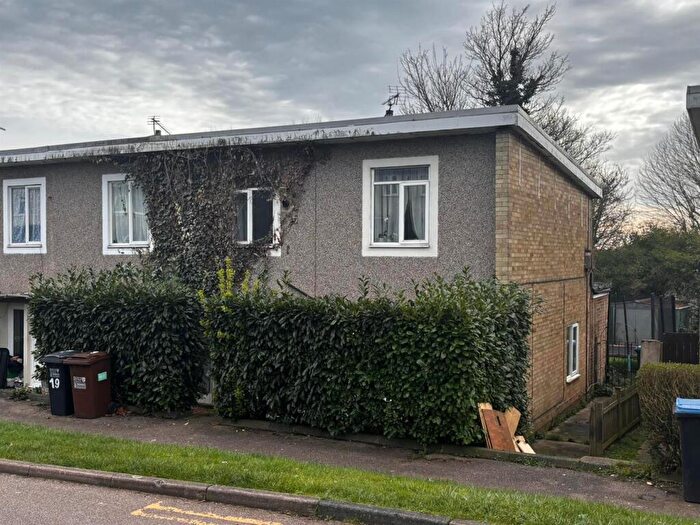
| Terraced House | £335,817.00 | 102 Terraced Houses |
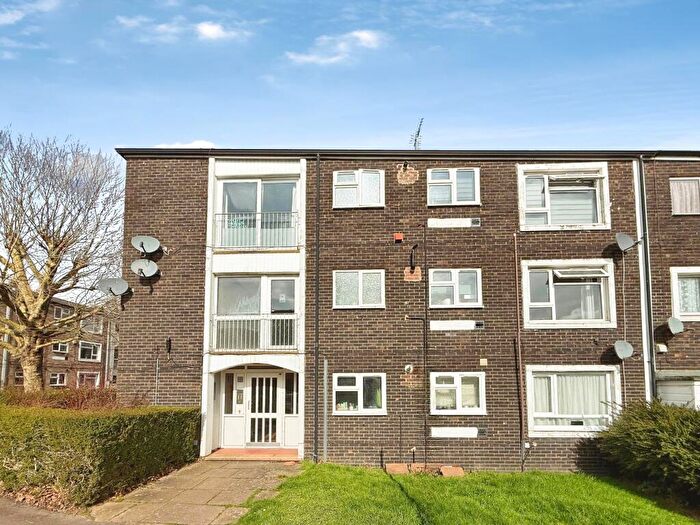
| Flat | £203,532.00 | 35 Flats |