
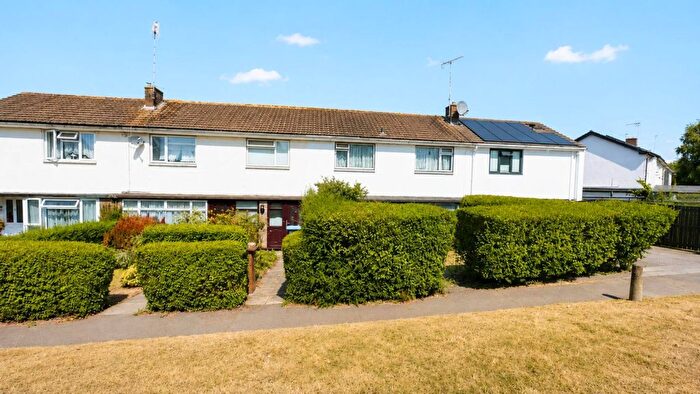
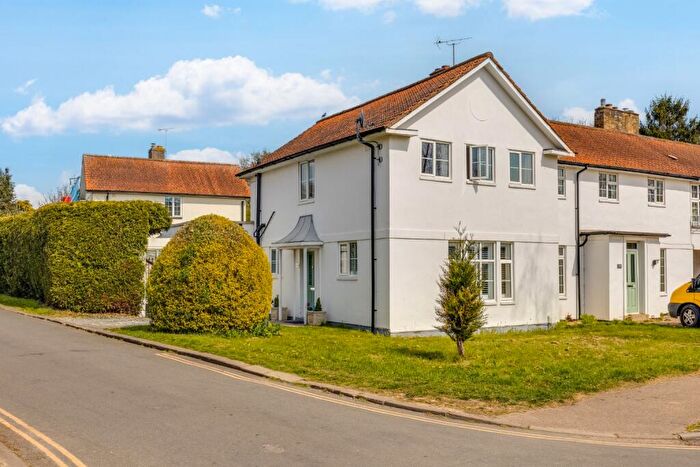
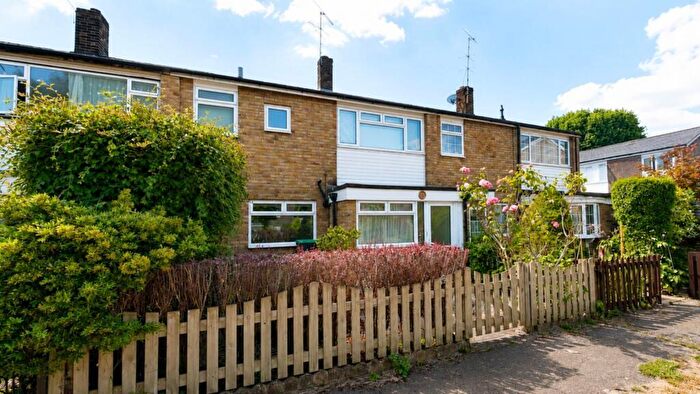
Houses for sale in Hatfield, Hertfordshire
House Prices in Hatfield
Properties in Hatfield have an average house price of £486k and had 1,208 Property Transactions within the last 3 years.¹
Hatfield is an area in Hertfordshire with 17,597 households², where the most expensive property was sold for £4.43M.
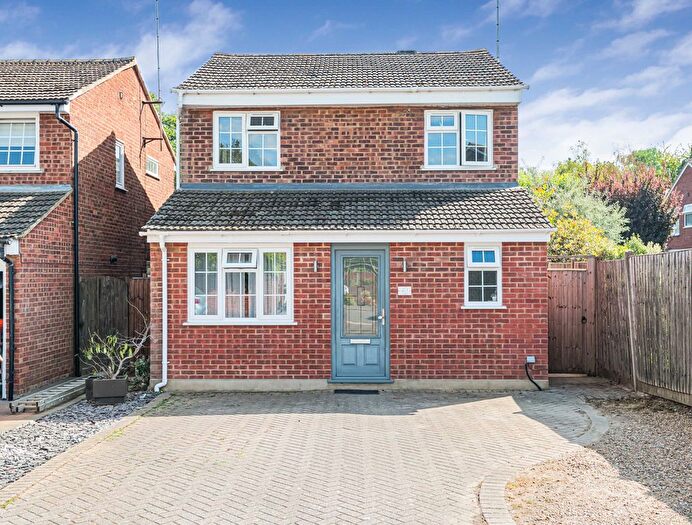
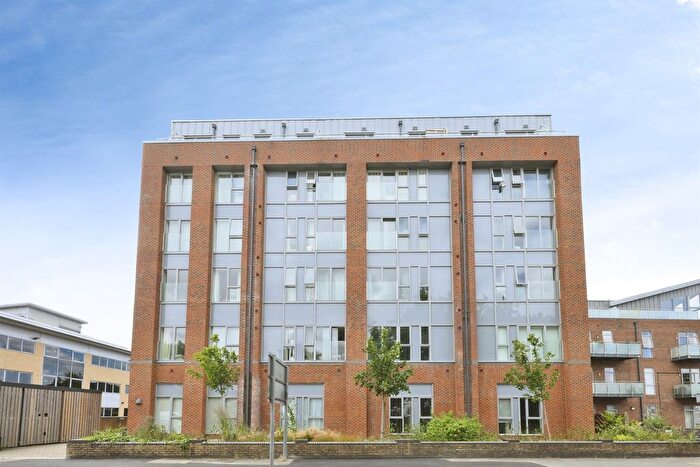
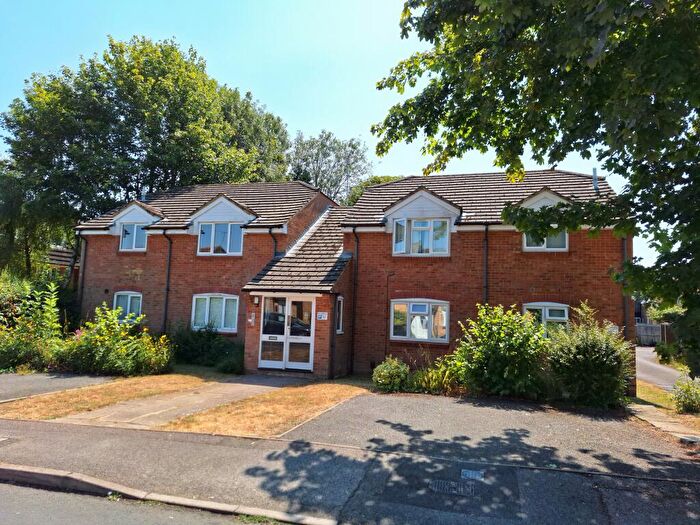
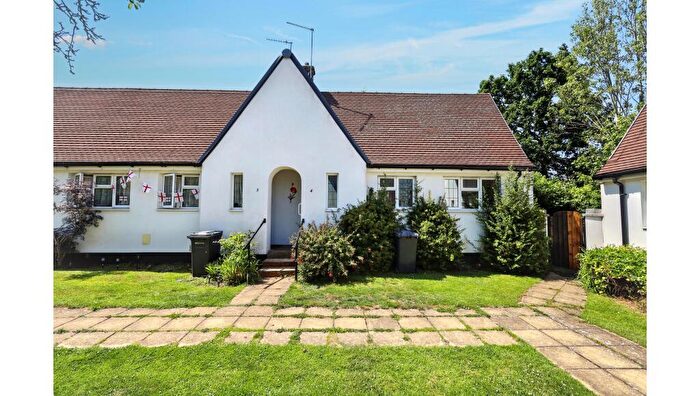
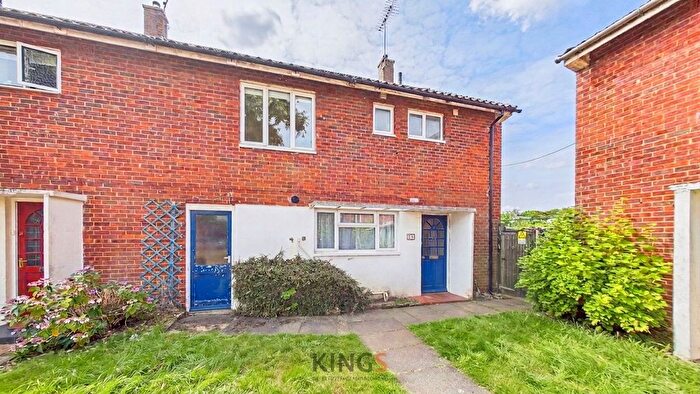
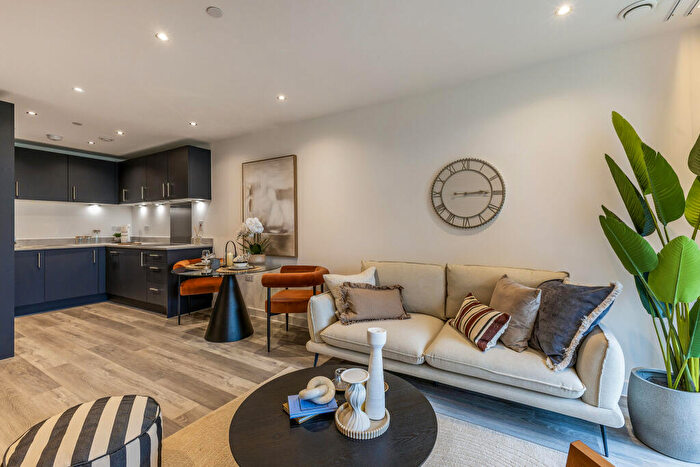
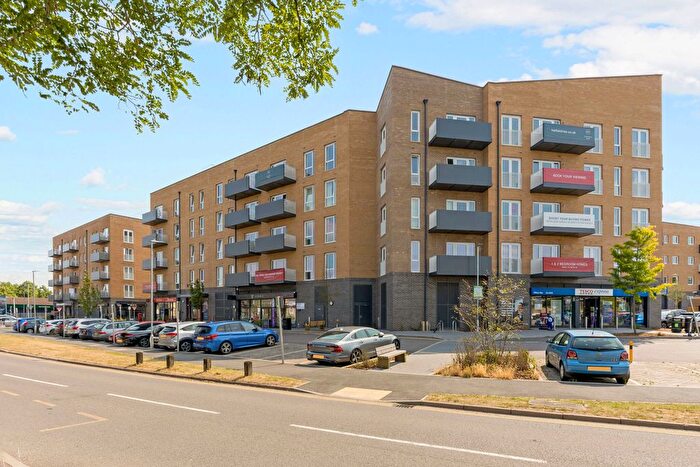
Properties for sale in Hatfield
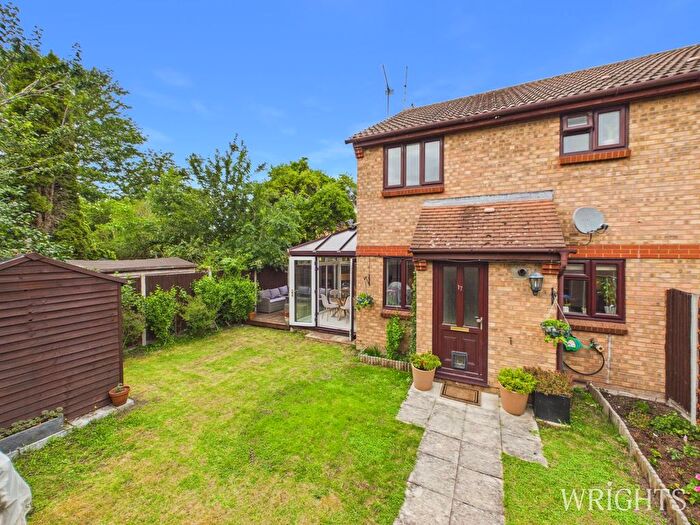
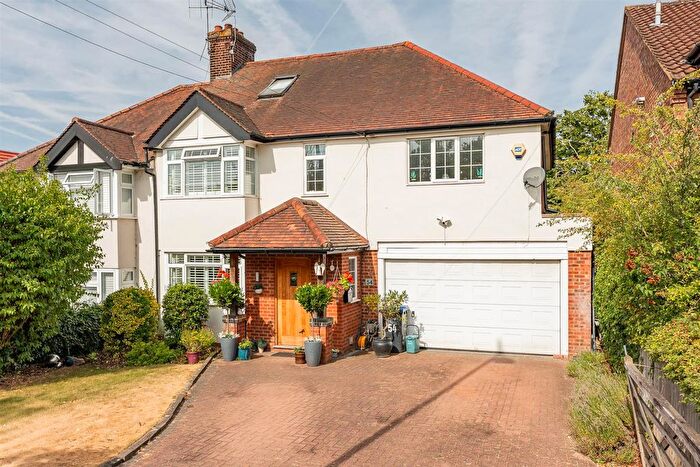
![]()
If you are looking to sell your house, let it out, or receive a property valuation, an expert can help you.
Click the button below to get started.

Neighbourhoods in Hatfield
Navigate through our locations to find the location of your next house in Hatfield, Hertfordshire for sale or to rent.
Property price trends in Hatfield
According to the latest Land Registry data, the average home in Hatfield sold for £660,758 in 2026. That figure comes from a substantial record of 19,573 sales logged over the past 31 years.
Prices have continued to climb over the last three years. Compared with 2023, when the typical sale came in around £517,388, that's a rise of roughly 27.7%.
Looking back five years, average prices are up about 44.8% since 2021, a gain of around £204,367 in cash terms.
Zoom out to the past decade for the fuller picture. Back in 2016, homes here averaged £406,785, so the typical sold price has climbed about 62.4% since then, roughly 5% a year. Stretch the view to fifteen years and that annual pace edges up closer to 5.9%.
Frequently asked questions about Hatfield
What is the average price for a property for sale in Hatfield?
The average price for a property for sale in Hatfield is £485,649. This amount is 9% lower than the average price in Hertfordshire. There are 9,393 property listings for sale in Hatfield.
What locations have the most expensive properties for sale in Hatfield?
The locations with the most expensive properties for sale in Hatfield are Brookmans Park And Little Heath at an average of £1,227,637, Welham Green and Hatfield South at an average of £972,400 and Welham Green at an average of £487,368.
What locations have the most affordable properties for sale in Hatfield?
The locations with the most affordable properties for sale in Hatfield are Hatfield Central at an average of £327,033, Hatfield South at an average of £335,396 and Hatfield Villages at an average of £382,336.
Which train stations are available in or near Hatfield?
Some of the train stations available in or near Hatfield are Hatfield, Welham Green and Brookman's Park.
Property Price Paid in Hatfield by Year
The average sold property price by year was:
| Year | Average Sold Price | Price Change |
Sold Properties
|
|---|---|---|---|
| 2026 | £660,758 | 33% |
29 Properties |
| 2025 | £445,315 | -9% |
427 Properties |
| 2024 | £486,939 | -6% |
385 Properties |
| 2023 | £517,388 | 0,5% |
367 Properties |
| 2022 | £514,877 | 11% |
503 Properties |
| 2021 | £456,391 | 4% |
723 Properties |
| 2020 | £437,208 | 2% |
412 Properties |
| 2019 | £429,643 | 0,5% |
483 Properties |
| 2018 | £427,627 | 4% |
532 Properties |
| 2017 | £412,413 | 1% |
545 Properties |
Property Price per Property Type in Hatfield
Here you can find historic sold price data in order to help with your property search.
The average Property Paid Price for specific property types in the last three years are:
| Property Type | Average Sold Price | Sold Properties |
|---|---|---|
| Semi Detached House | £544,111.00 | 254 Semi Detached Houses |
| Terraced House | £393,723.00 | 475 Terraced Houses |
| Detached House | £1,065,690.00 | 178 Detached Houses |
| Flat | £238,369.00 | 301 Flats |
Transport in Hatfield
Please see below transportation links in this area:
