
Houses for sale & to rent in Hertford, Hertfordshire
House Prices in Hertford
Properties in Hertford have an average house price of £518k and had 1,635 Property Transactions within the last 3 years.¹
Hertford is an area in Hertfordshire with 14,835 households², where the most expensive property was sold for £3.1M.
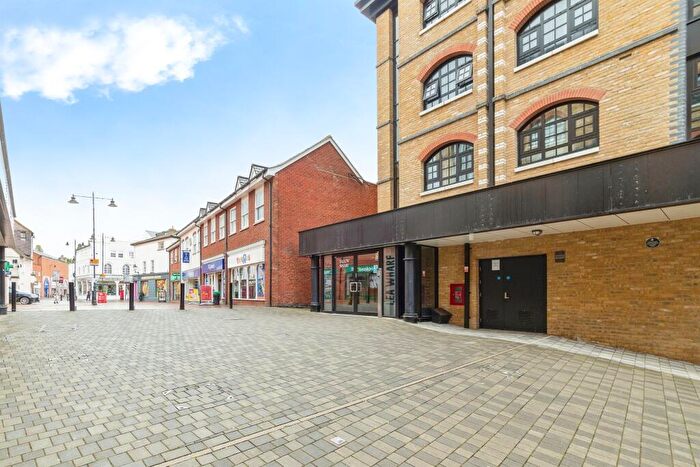
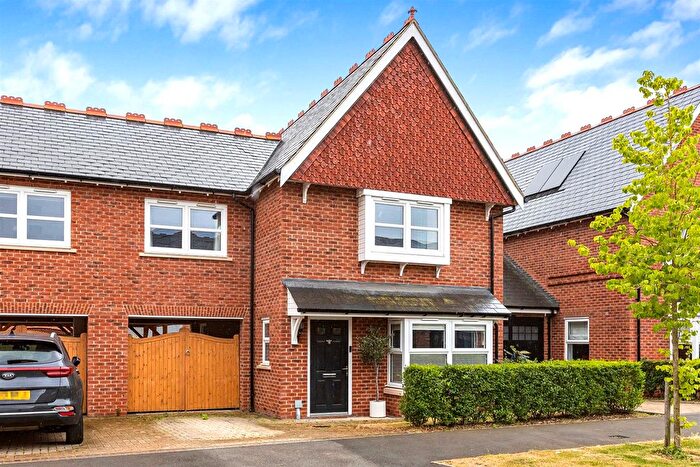
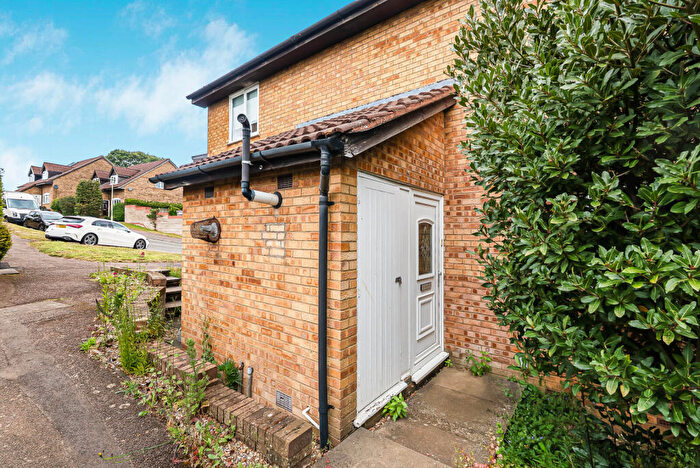
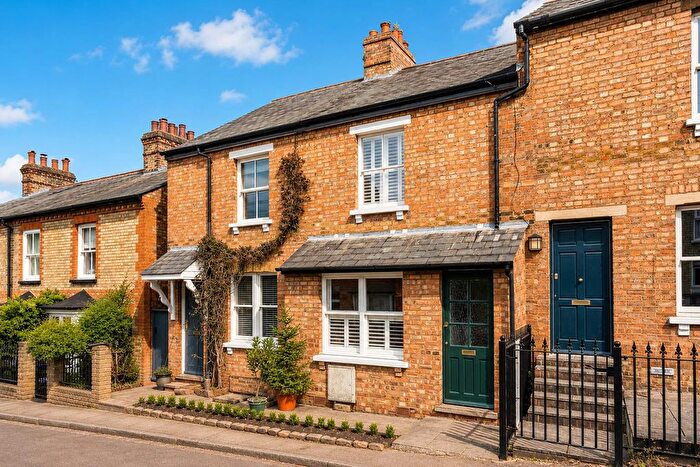
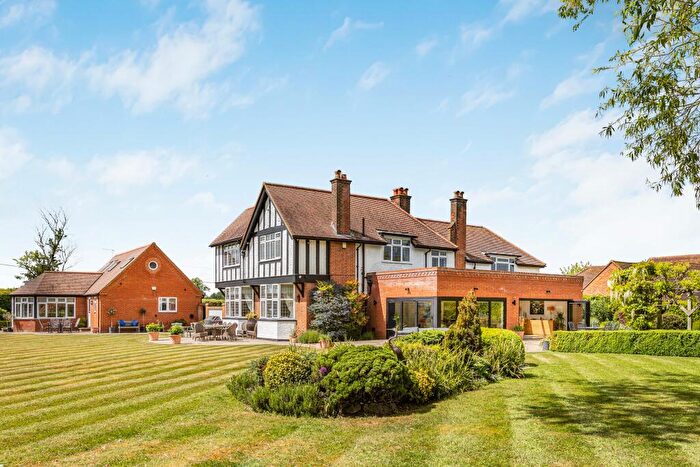
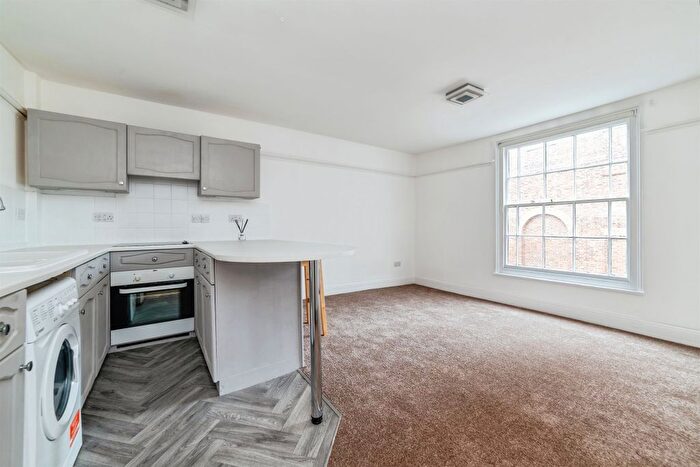
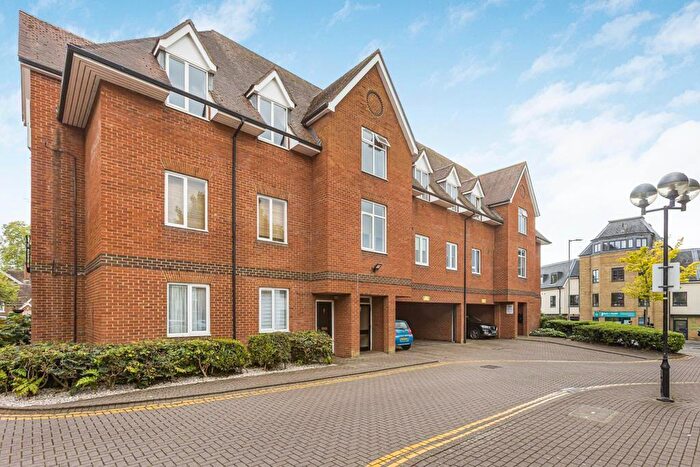
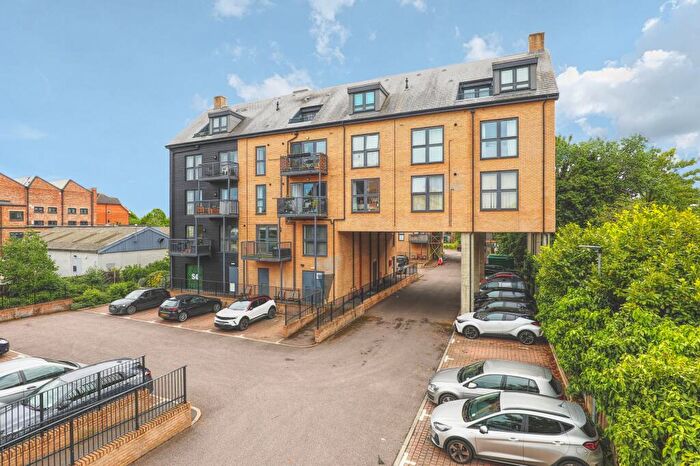
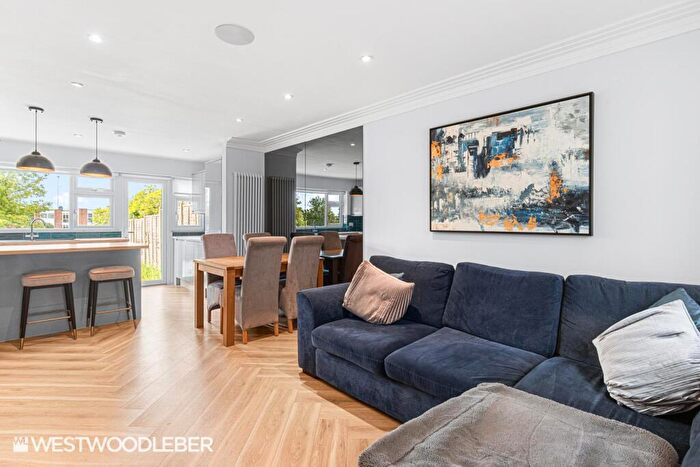
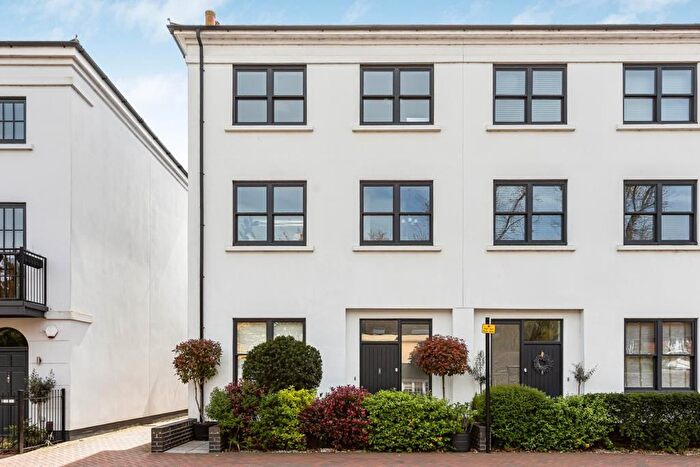
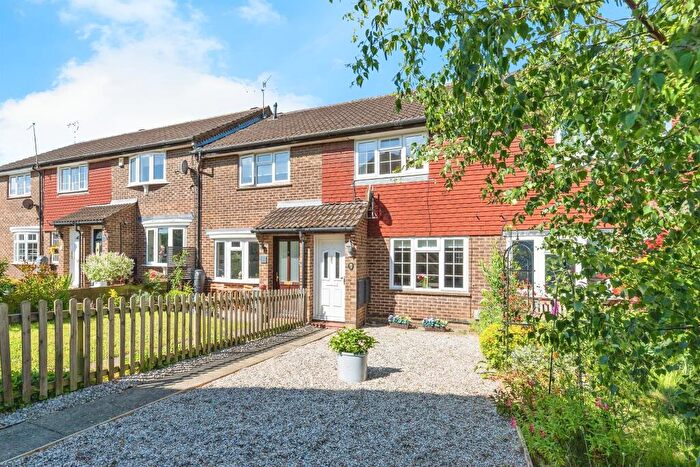
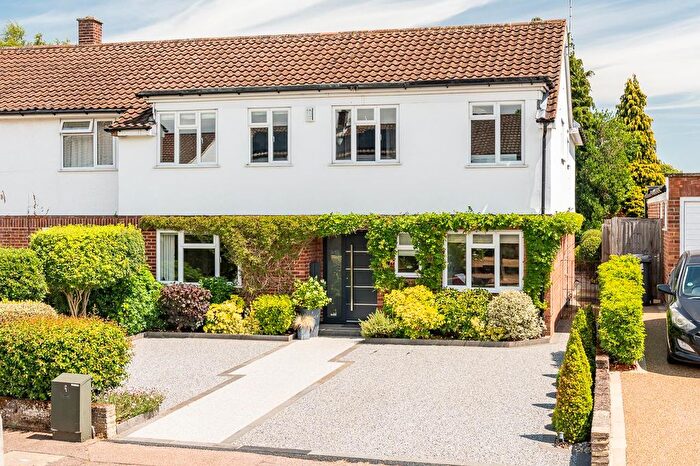
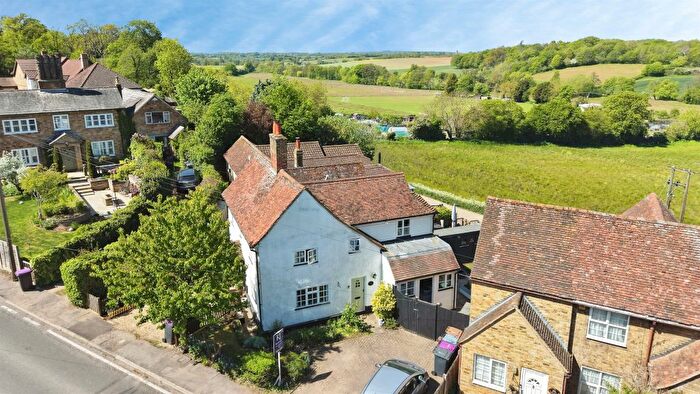
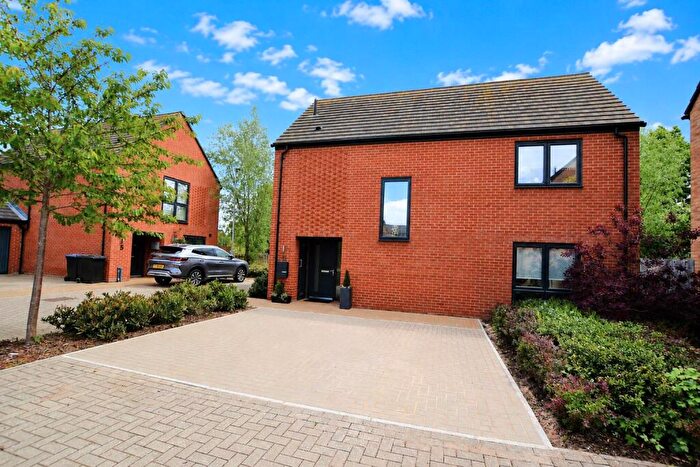
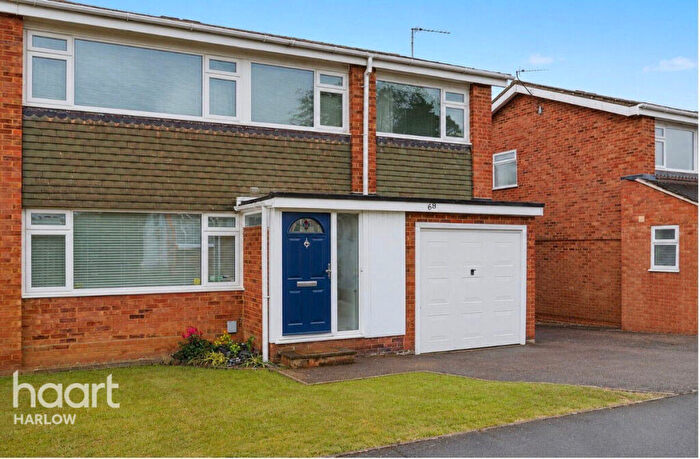
Properties for sale in Hertford
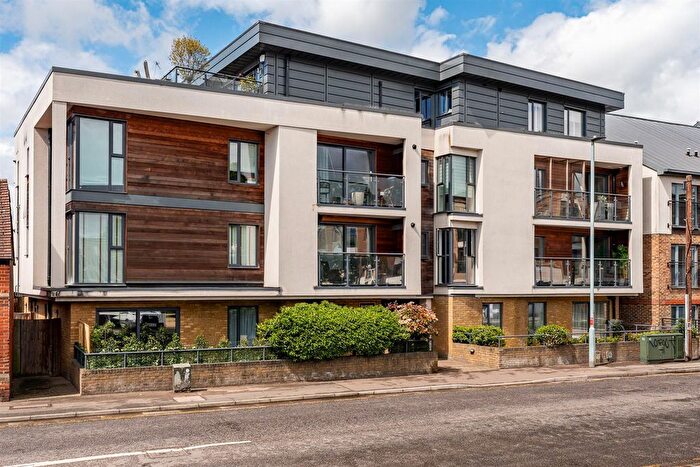
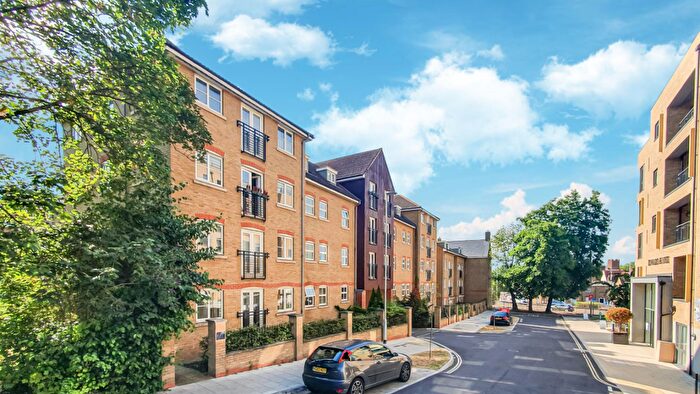
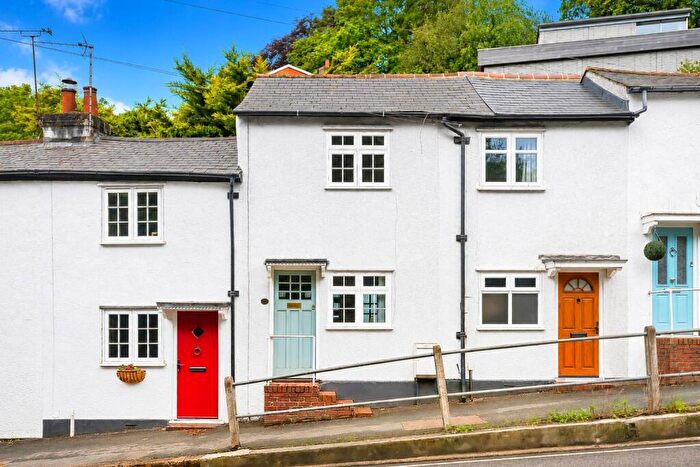


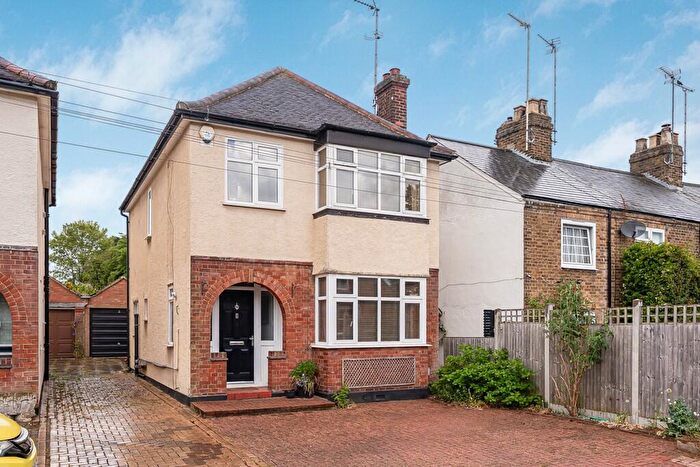
![]()
If you are looking to sell your house, let it out, or receive a property valuation, an expert can help you.
Click the button below to get started.

Neighbourhoods in Hertford
Navigate through our locations to find the location of your next house in Hertford, Hertfordshire for sale or to rent.
Transport in Hertford
Please see below transportation links in this area:

- FAQ
- Price Paid By Year
- Property Type Price
Frequently asked questions about Hertford
What is the average price for a property for sale in Hertford?
The average price for a property for sale in Hertford is £518,060. This amount is 3% lower than the average price in Hertfordshire. There are more than 10,000 property listings for sale in Hertford.
What locations have the most expensive properties for sale in Hertford?
The locations with the most expensive properties for sale in Hertford are Hertford Rural South at an average of £1,020,253, Brookmans Park And Little Heath at an average of £994,285 and Hertford Rural North at an average of £785,188.
What locations have the most affordable properties for sale in Hertford?
The locations with the most affordable properties for sale in Hertford are Watton-at-stone at an average of £437,390, Hertford Castle at an average of £458,413 and Hertford Sele at an average of £476,166.
Which train stations are available in or near Hertford?
Some of the train stations available in or near Hertford are Hertford North, Hertford East and Ware.
Property Price Paid in Hertford by Year
The average sold property price by year was:
| Year | Average Sold Price | Price Change |
Sold Properties
|
|---|---|---|---|
| 2026 | £576,219 | 11% |
35 Properties |
| 2025 | £515,621 | 1% |
544 Properties |
| 2024 | £508,530 | -4% |
570 Properties |
| 2023 | £527,781 | 3% |
486 Properties |
| 2022 | £512,157 | 5% |
666 Properties |
| 2021 | £484,552 | -2% |
893 Properties |
| 2020 | £492,923 | 3% |
615 Properties |
| 2019 | £477,134 | 7% |
576 Properties |
| 2018 | £444,880 | -5% |
765 Properties |
| 2017 | £465,742 | 11% |
664 Properties |
| 2016 | £414,764 | 10% |
868 Properties |
| 2015 | £371,524 | 5% |
912 Properties |
| 2014 | £353,834 | 3% |
894 Properties |
| 2013 | £344,235 | 6% |
724 Properties |
| 2012 | £323,676 | 1% |
638 Properties |
| 2011 | £320,614 | 8% |
603 Properties |
| 2010 | £293,754 | -5% |
623 Properties |
| 2009 | £307,836 | 3% |
513 Properties |
| 2008 | £300,055 | -3% |
457 Properties |
| 2007 | £308,807 | 7% |
952 Properties |
| 2006 | £286,952 | 2% |
1,056 Properties |
| 2005 | £282,317 | 12% |
797 Properties |
| 2004 | £248,283 | 3% |
980 Properties |
| 2003 | £239,798 | 9% |
868 Properties |
| 2002 | £217,671 | 16% |
1,052 Properties |
| 2001 | £182,132 | 13% |
1,000 Properties |
| 2000 | £159,139 | 15% |
917 Properties |
| 1999 | £134,550 | 10% |
999 Properties |
| 1998 | £120,589 | 11% |
851 Properties |
| 1997 | £107,586 | 14% |
922 Properties |
| 1996 | £92,520 | 5% |
857 Properties |
| 1995 | £87,681 | - |
757 Properties |
Property Price per Property Type in Hertford
Here you can find historic sold price data in order to help with your property search.
The average Property Paid Price for specific property types in the last three years are:
| Property Type | Average Sold Price | Sold Properties |
|---|---|---|
| Semi Detached House | £614,069.00 | 337 Semi Detached Houses |
| Detached House | £949,677.00 | 209 Detached Houses |
| Terraced House | £481,005.00 | 604 Terraced Houses |
| Flat | £311,501.00 | 485 Flats |