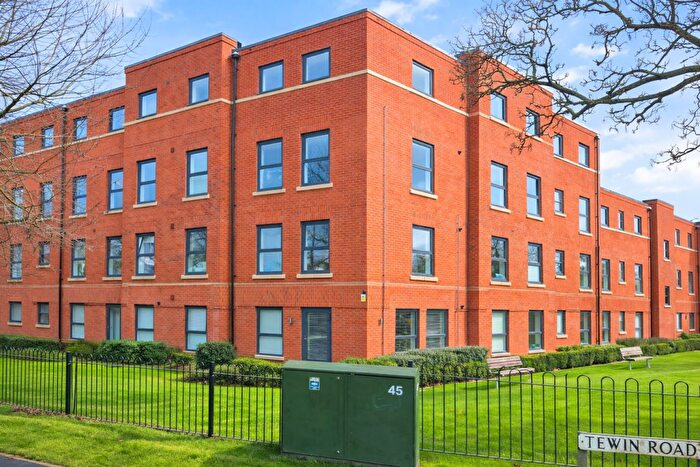
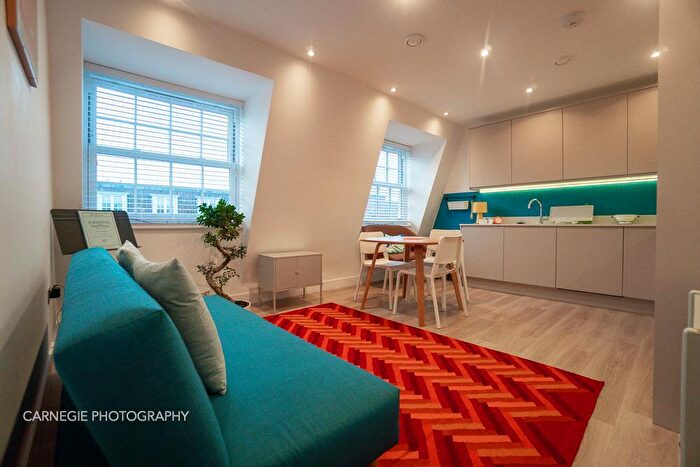
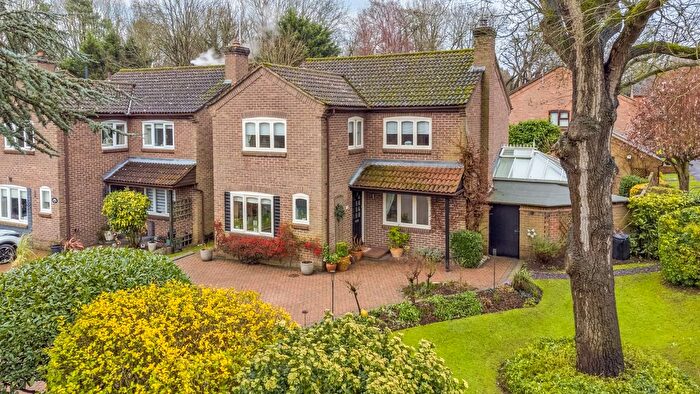
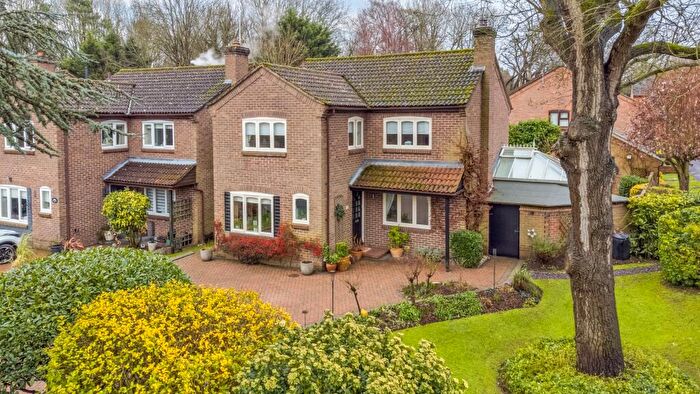
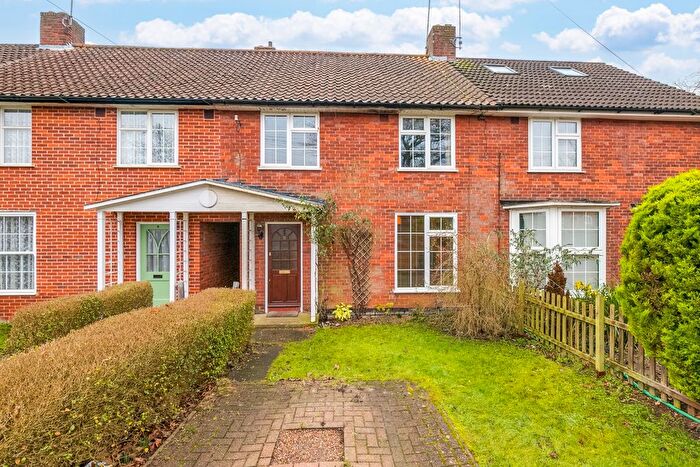
Houses for sale & to rent in Welwyn Garden City, Hertfordshire
House Prices in Welwyn Garden City
Properties in Welwyn Garden City have an average house price of £433,722.00 and had 1,432 Property Transactions within the last 3 years.¹
Welwyn Garden City is an area in Hertfordshire with 19,809 households², where the most expensive property was sold for £1,750,000.00.
Properties for sale in Welwyn Garden City
Neighbourhoods in Welwyn Garden City
Navigate through our locations to find the location of your next house in Welwyn Garden City, Hertfordshire for sale or to rent.
Transport in Welwyn Garden City
Please see below transportation links in this area:
- FAQ
- Price Paid By Year
- Property Type Price
Frequently asked questions about Welwyn Garden City
What is the average price for a property for sale in Welwyn Garden City?
The average price for a property for sale in Welwyn Garden City is £433,722. This amount is 18% lower than the average price in Hertfordshire. There are 5,465 property listings for sale in Welwyn Garden City.
What locations have the most expensive properties for sale in Welwyn Garden City?
The locations with the most expensive properties for sale in Welwyn Garden City are Handside at an average of £569,064, Sherrards at an average of £562,533 and Hatfield Villages at an average of £560,937.
What locations have the most affordable properties for sale in Welwyn Garden City?
The locations with the most affordable properties for sale in Welwyn Garden City are Peartree at an average of £328,926, Haldens at an average of £377,681 and Hollybush at an average of £393,110.
Which train stations are available in or near Welwyn Garden City?
Some of the train stations available in or near Welwyn Garden City are Welwyn Garden City, Welwyn North and Hatfield.
Property Price Paid in Welwyn Garden City by Year
The average sold property price by year was:
| Year | Average Sold Price | Price Change |
Sold Properties
|
|---|---|---|---|
| 2025 | £441,572 | 3% |
393 Properties |
| 2024 | £430,038 | -0,3% |
534 Properties |
| 2023 | £431,509 | -0,1% |
505 Properties |
| 2022 | £432,000 | 9% |
748 Properties |
| 2021 | £393,421 | 0,3% |
834 Properties |
| 2020 | £392,407 | 8% |
732 Properties |
| 2019 | £361,519 | -3% |
822 Properties |
| 2018 | £370,607 | -0,2% |
776 Properties |
| 2017 | £371,319 | 0,3% |
786 Properties |
| 2016 | £370,125 | 13% |
722 Properties |
| 2015 | £322,599 | 12% |
723 Properties |
| 2014 | £282,600 | 4% |
861 Properties |
| 2013 | £270,987 | 8% |
688 Properties |
| 2012 | £249,032 | -4% |
559 Properties |
| 2011 | £258,606 | 4% |
517 Properties |
| 2010 | £247,924 | 6% |
507 Properties |
| 2009 | £232,300 | -3% |
543 Properties |
| 2008 | £240,261 | 1% |
468 Properties |
| 2007 | £237,897 | 5% |
981 Properties |
| 2006 | £225,251 | 6% |
1,107 Properties |
| 2005 | £211,881 | -1% |
893 Properties |
| 2004 | £214,638 | 10% |
1,010 Properties |
| 2003 | £194,213 | 13% |
896 Properties |
| 2002 | £168,672 | 13% |
873 Properties |
| 2001 | £146,568 | 10% |
891 Properties |
| 2000 | £131,737 | 15% |
790 Properties |
| 1999 | £112,041 | 6% |
885 Properties |
| 1998 | £105,335 | 11% |
852 Properties |
| 1997 | £93,706 | 11% |
839 Properties |
| 1996 | £83,655 | 4% |
780 Properties |
| 1995 | £80,515 | - |
652 Properties |
Property Price per Property Type in Welwyn Garden City
Here you can find historic sold price data in order to help with your property search.
The average Property Paid Price for specific property types in the last three years are:
| Property Type | Average Sold Price | Sold Properties |
|---|---|---|
| Semi Detached House | £542,332.00 | 292 Semi Detached Houses |
| Terraced House | £421,334.00 | 556 Terraced Houses |
| Detached House | £746,373.00 | 159 Detached Houses |
| Flat | £258,338.00 | 425 Flats |

