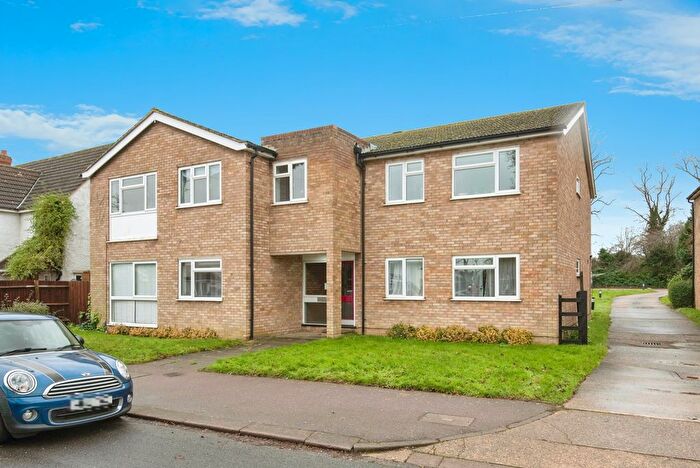
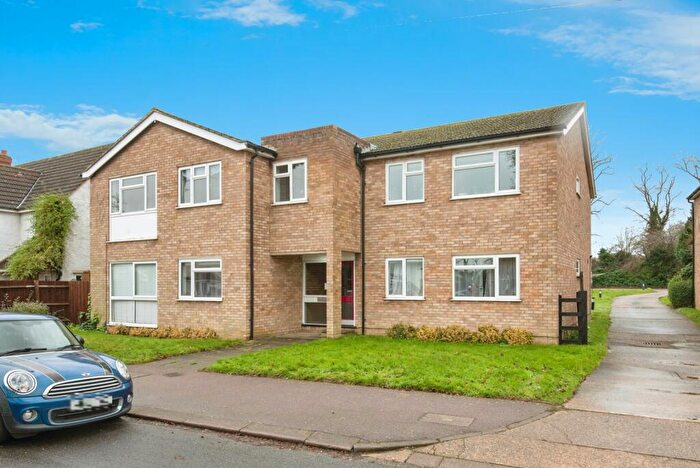
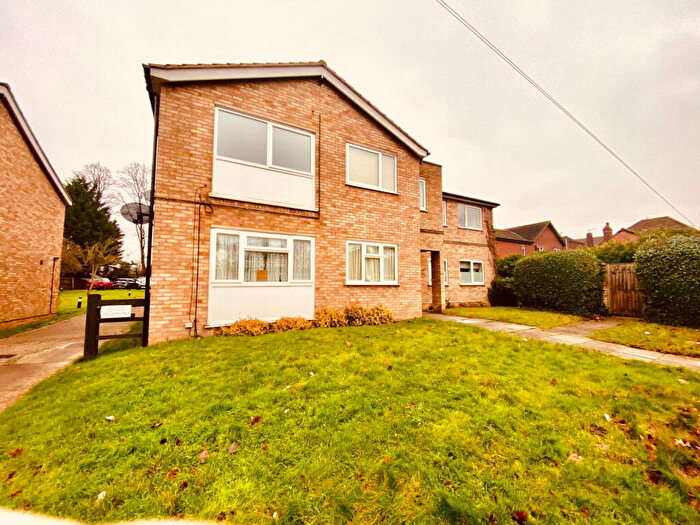
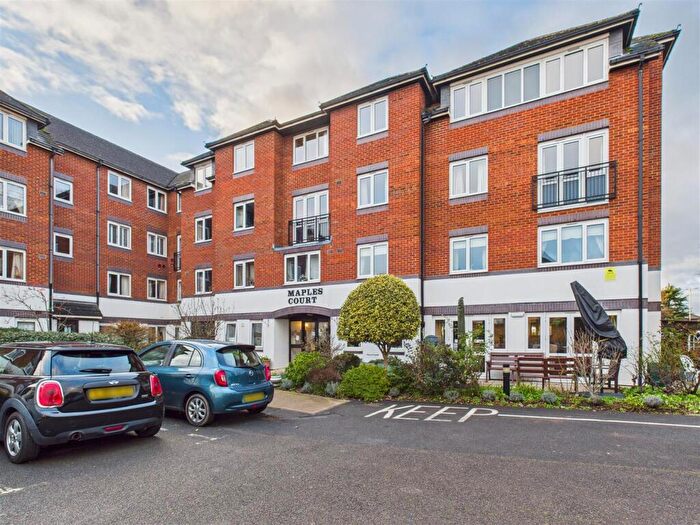
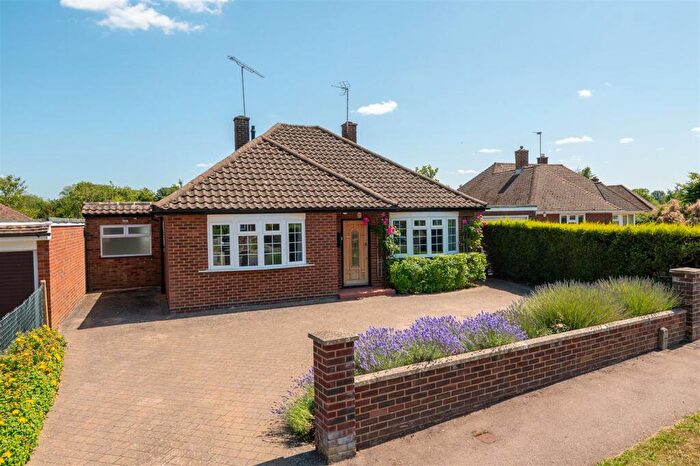
Houses for sale & to rent in Hitchin Oughton, Hitchin
House Prices in Hitchin Oughton
Properties in Hitchin Oughton have an average house price of £409,027.00 and had 182 Property Transactions within the last 3 years¹.
Hitchin Oughton is an area in Hitchin, Hertfordshire with 2,175 households², where the most expensive property was sold for £1,050,000.00.
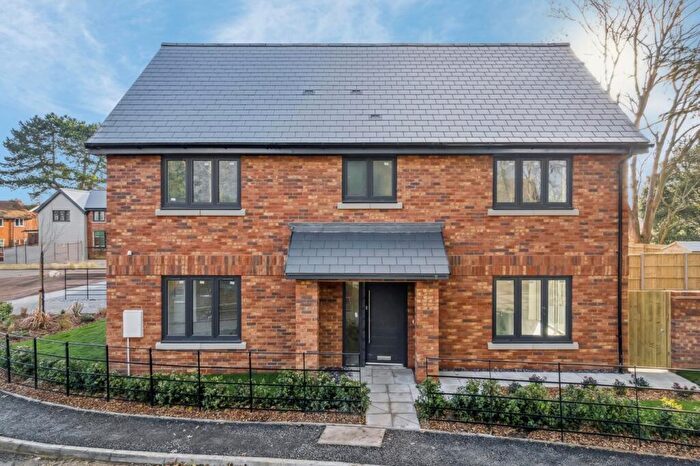
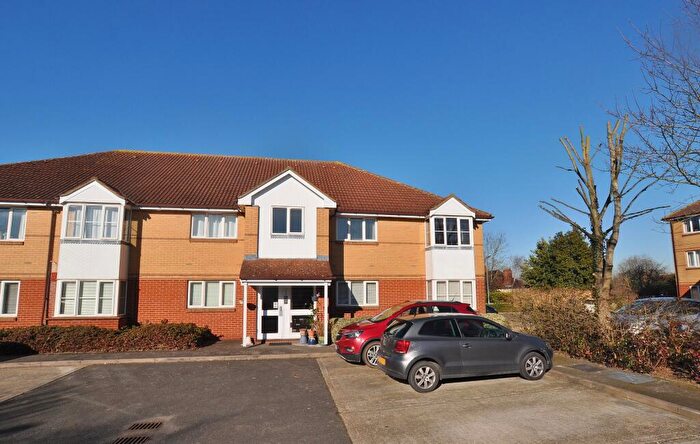
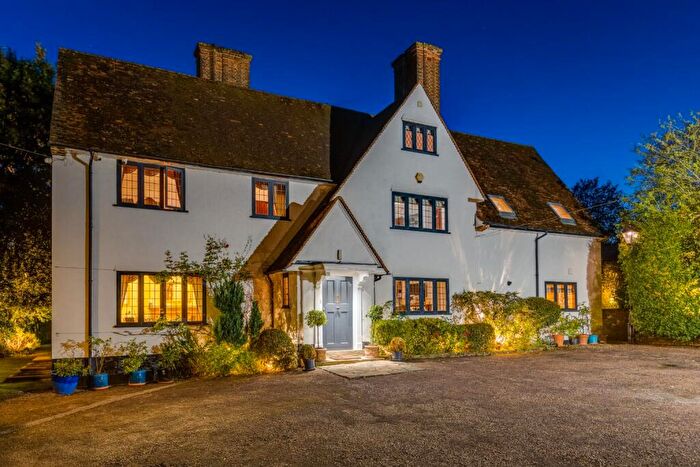
Properties for sale in Hitchin Oughton
Roads and Postcodes in Hitchin Oughton
Navigate through our locations to find the location of your next house in Hitchin Oughton, Hitchin for sale or to rent.
| Streets | Postcodes |
|---|---|
| Beaumont Close | SG5 2SA |
| Bedford Road | SG5 2TJ SG5 2TP SG5 2TU SG5 2UB SG5 2UE SG5 2UQ SG5 2UU SG5 2WA SG5 2NG SG5 2TT |
| Beechwood Close | SG5 2TQ |
| Berkeley Close | SG5 2NR |
| Bingen Road | SG5 2PP SG5 2PR |
| Bowyers Close | SG5 2UH |
| Burford Way | SG5 2UY SG5 2UZ SG5 2XE SG5 2XH SG5 2XP |
| Carling Place | SG5 2TZ |
| Chalkdell Path | SG5 2LG |
| Crispin Terrace | SG5 2LB |
| Dugdale Court | SG5 2QR SG5 2QS |
| Firs Close | SG5 2TX |
| Fosman Close | SG5 2LL |
| Freemans Close | SG5 2SE |
| Friday Furlong | SG5 2ND |
| Greenside Drive | SG5 2LP |
| Hine Way | SG5 2SH SG5 2SL SG5 2SN |
| John Barker Place | SG5 2PE SG5 2PF SG5 2PH SG5 2PD SG5 2PG |
| Kent Place | SG5 2LE |
| Kings Hedges | SG5 2PT SG5 2PZ SG5 2QE SG5 2QH |
| Lower Innings | SG5 2NA |
| Lucas Lane | SG5 2NX |
| Mattocke Road | SG5 2NZ SG5 2PB SG5 2EQ |
| Maxwells Path | SG5 2LJ SG5 2LQ |
| Milestone Road | SG5 2SX SG5 2SY SG5 2SZ SG5 2TH |
| Moss Way | SG5 2PS SG5 2QN SG5 2QP SG5 2QW |
| Mulberry Way | SG5 2TB |
| North Place | SG5 2NW |
| Nutleigh Grove | SG5 2NH |
| Oughton Head Way | SG5 2LA SG5 2LD |
| Oughtonhead Lane | SG5 2QX |
| Portman Close | SG5 2UX |
| Redhill Road | SG5 2NJ SG5 2NL SG5 2NP SG5 2NQ SG5 2NT SG5 2NU SG5 2NY |
| River Mead | SG5 2TE SG5 2TF SG5 2TG |
| Seebohm Close | SG5 2SJ |
| South Place | SG5 2NN |
| Spellbrooke | SG5 2NB |
| Swinburne Avenue | SG5 2QT SG5 2QZ SG5 2RA SG5 2RB SG5 2RD SG5 2RG SG5 2RL SG5 2RR |
| Symonds Road | SG5 2JJ SG5 2JL |
| Talbot Street | SG5 2QU |
| The Crescent | SG5 2PA |
| Times Close | SG5 2UT |
| Truemans Road | SG5 2TA SG5 2TD |
| Wellingham Avenue | SG5 2UJ SG5 2UL SG5 2UN |
| Westbury Close | SG5 2NE SG5 2NF SG5 2NS |
| Westmill Lane | SG5 2SR |
| Westmill Road | SG5 2SB SG5 2SD SG5 2SP SG5 2SQ SG5 2SF SG5 2SG |
Transport near Hitchin Oughton
- FAQ
- Price Paid By Year
- Property Type Price
Frequently asked questions about Hitchin Oughton
What is the average price for a property for sale in Hitchin Oughton?
The average price for a property for sale in Hitchin Oughton is £409,027. This amount is 17% lower than the average price in Hitchin. There are 808 property listings for sale in Hitchin Oughton.
What streets have the most expensive properties for sale in Hitchin Oughton?
The streets with the most expensive properties for sale in Hitchin Oughton are Talbot Street at an average of £874,053, Times Close at an average of £567,500 and Bowyers Close at an average of £502,033.
What streets have the most affordable properties for sale in Hitchin Oughton?
The streets with the most affordable properties for sale in Hitchin Oughton are John Barker Place at an average of £188,333, Mattocke Road at an average of £269,625 and River Mead at an average of £301,666.
Which train stations are available in or near Hitchin Oughton?
Some of the train stations available in or near Hitchin Oughton are Hitchin, Letchworth and Arlesey.
Property Price Paid in Hitchin Oughton by Year
The average sold property price by year was:
| Year | Average Sold Price | Price Change |
Sold Properties
|
|---|---|---|---|
| 2025 | £451,419 | 9% |
39 Properties |
| 2024 | £410,428 | 5% |
44 Properties |
| 2023 | £390,914 | -0,3% |
39 Properties |
| 2022 | £392,218 | 2% |
60 Properties |
| 2021 | £385,940 | 8% |
68 Properties |
| 2020 | £354,119 | 4% |
50 Properties |
| 2019 | £340,804 | -2% |
47 Properties |
| 2018 | £346,156 | -3% |
66 Properties |
| 2017 | £356,376 | 11% |
74 Properties |
| 2016 | £317,205 | 12% |
54 Properties |
| 2015 | £279,252 | 16% |
73 Properties |
| 2014 | £235,433 | 4% |
69 Properties |
| 2013 | £226,207 | -3% |
67 Properties |
| 2012 | £232,696 | 17% |
44 Properties |
| 2011 | £192,105 | 0,4% |
47 Properties |
| 2010 | £191,301 | -7% |
49 Properties |
| 2009 | £205,167 | 3% |
48 Properties |
| 2008 | £198,349 | -3% |
38 Properties |
| 2007 | £203,860 | 4% |
95 Properties |
| 2006 | £196,310 | 5% |
92 Properties |
| 2005 | £185,537 | 10% |
52 Properties |
| 2004 | £166,702 | 1% |
70 Properties |
| 2003 | £164,254 | 22% |
76 Properties |
| 2002 | £127,793 | 4% |
95 Properties |
| 2001 | £122,788 | 7% |
78 Properties |
| 2000 | £114,426 | 24% |
72 Properties |
| 1999 | £87,128 | 6% |
73 Properties |
| 1998 | £81,587 | 18% |
85 Properties |
| 1997 | £67,222 | 7% |
61 Properties |
| 1996 | £62,229 | -31% |
79 Properties |
| 1995 | £81,625 | - |
91 Properties |
Property Price per Property Type in Hitchin Oughton
Here you can find historic sold price data in order to help with your property search.
The average Property Paid Price for specific property types in the last three years are:
| Property Type | Average Sold Price | Sold Properties |
|---|---|---|
| Semi Detached House | £449,641.00 | 91 Semi Detached Houses |
| Detached House | £723,656.00 | 12 Detached Houses |
| Terraced House | £395,711.00 | 46 Terraced Houses |
| Flat | £201,181.00 | 33 Flats |

