
Houses for sale & to rent in Hitchin, Hertfordshire
House Prices in Hitchin
Properties in Hitchin have an average house price of £504k and had 2,139 Property Transactions within the last 3 years.¹
Hitchin is an area in Hertfordshire with 20,888 households², where the most expensive property was sold for £2.58M.
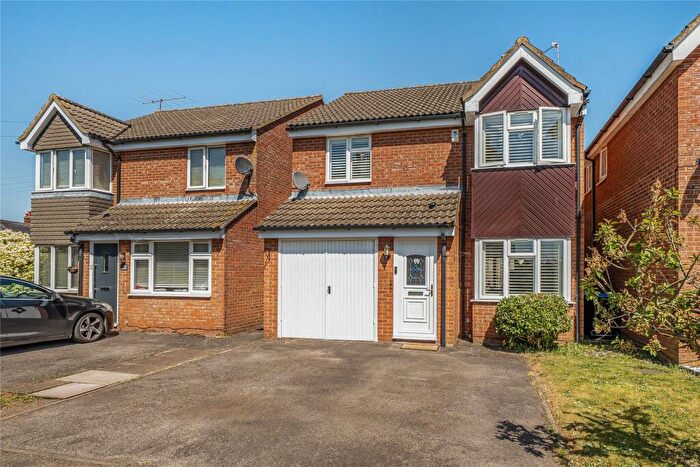
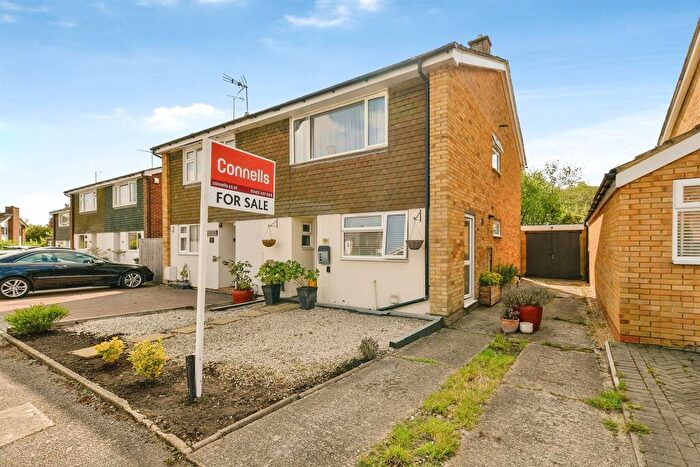
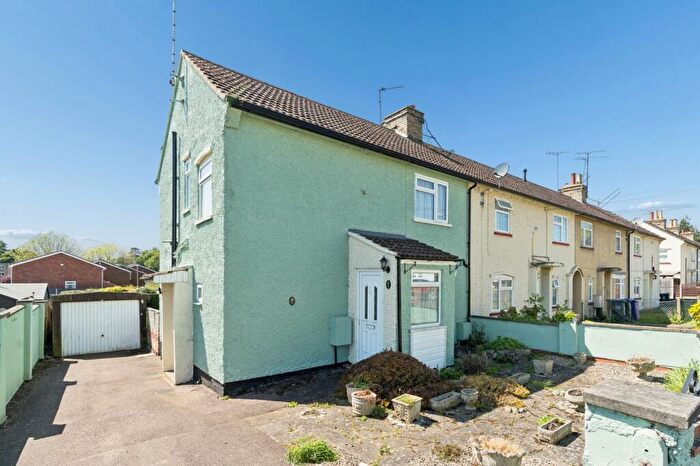
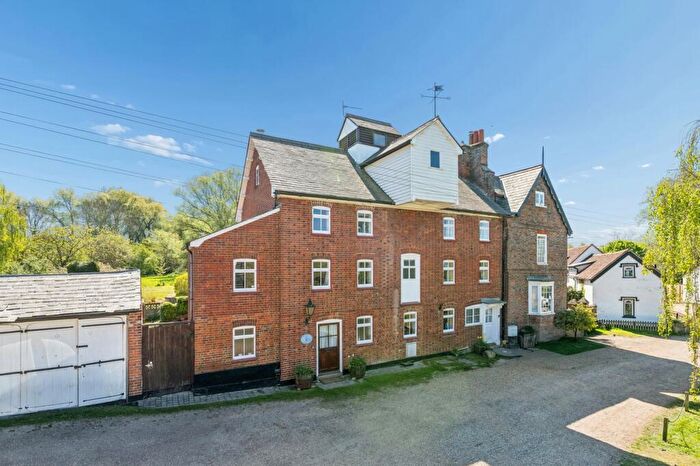
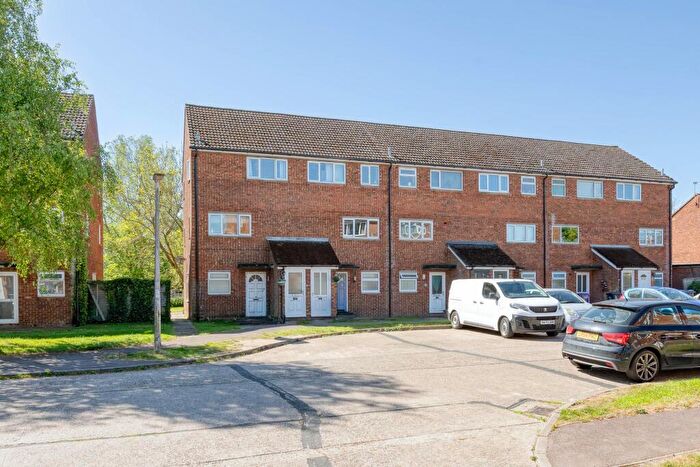
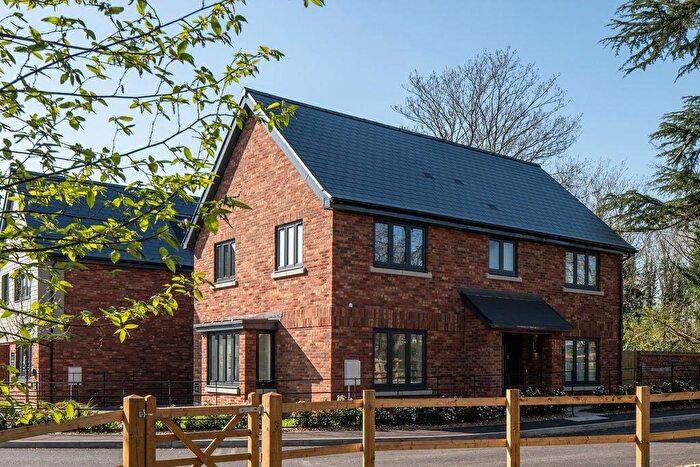
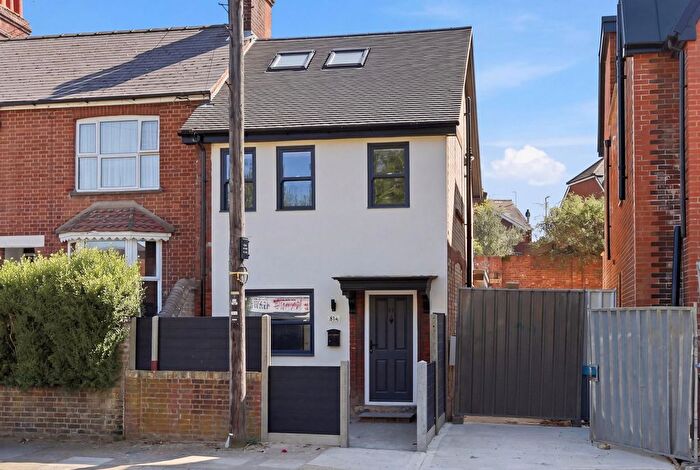
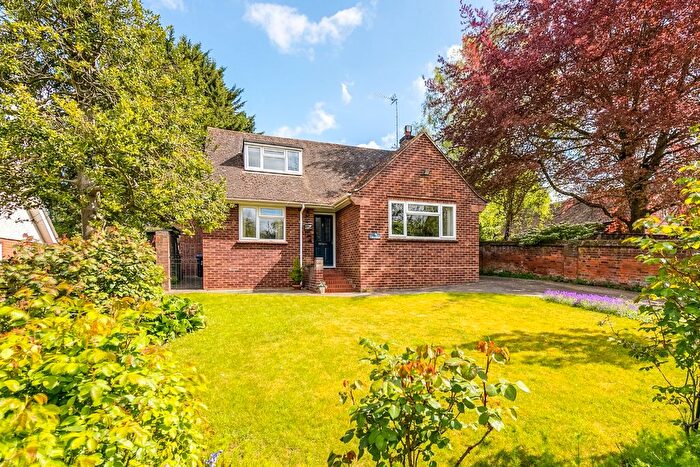
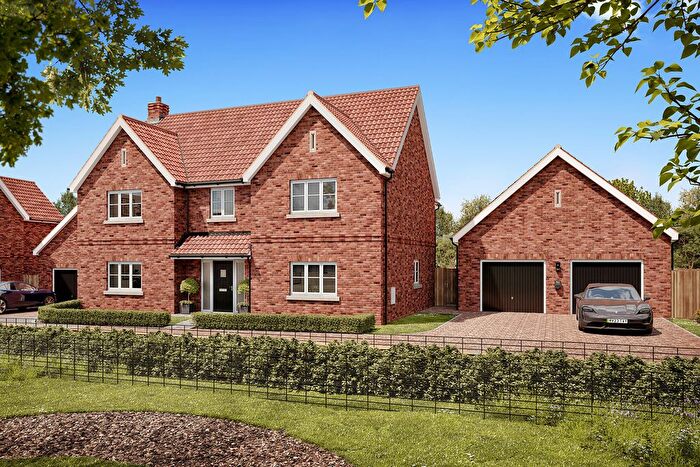
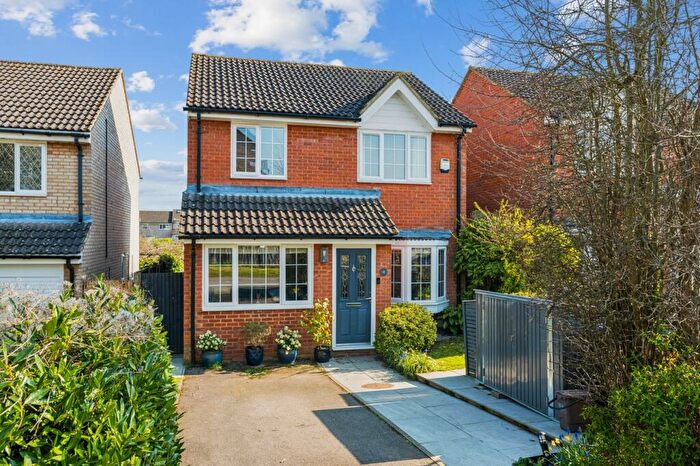
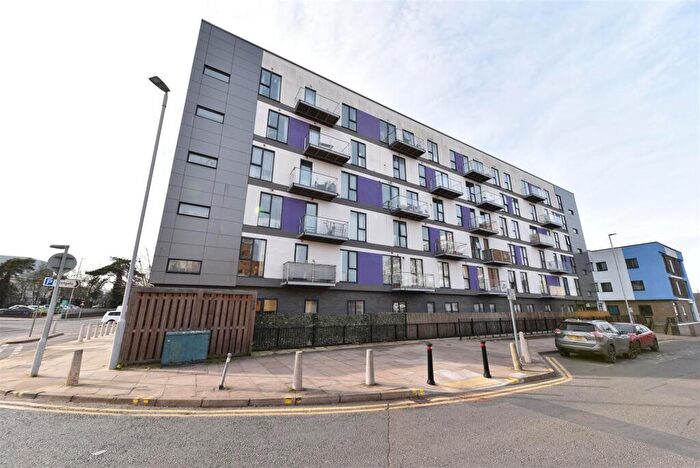
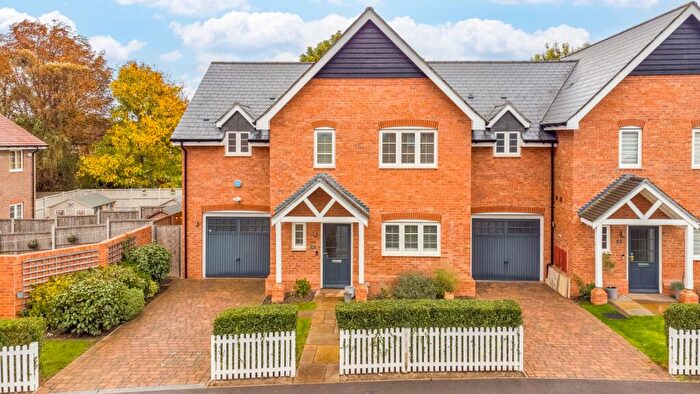
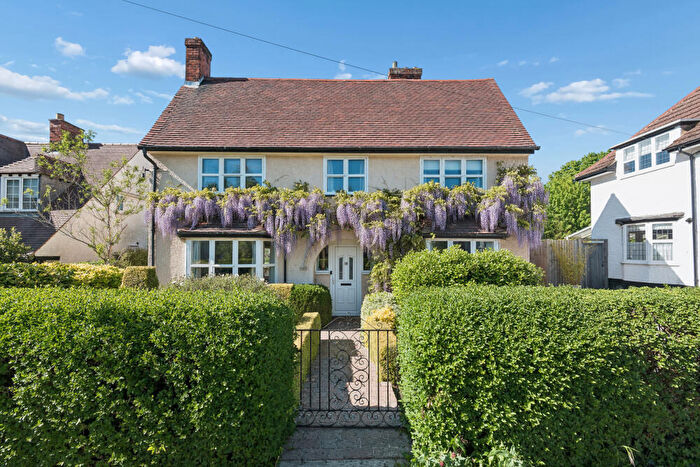
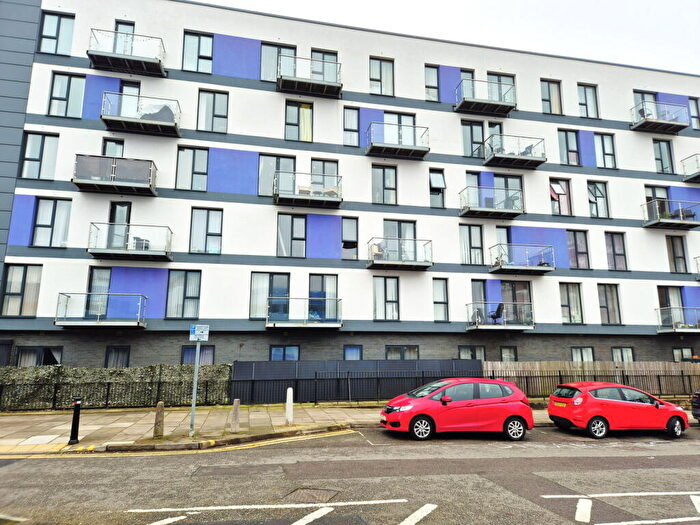
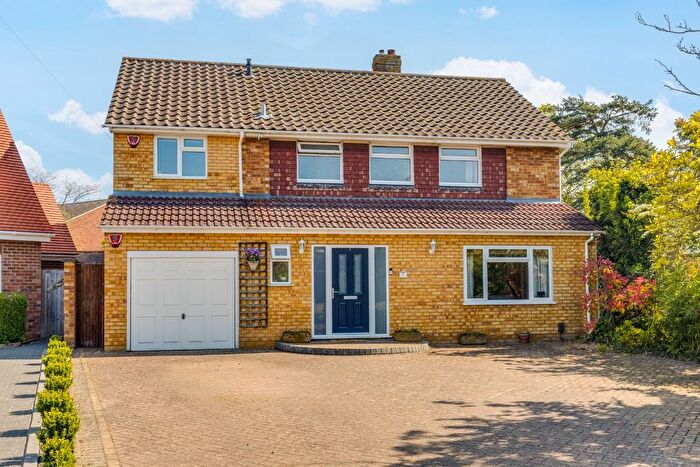
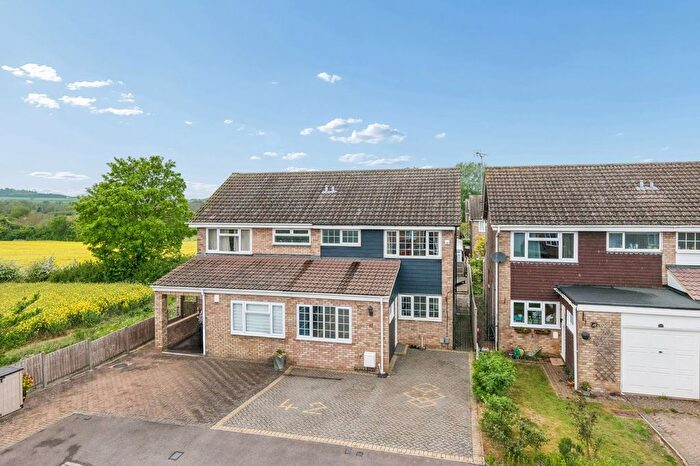
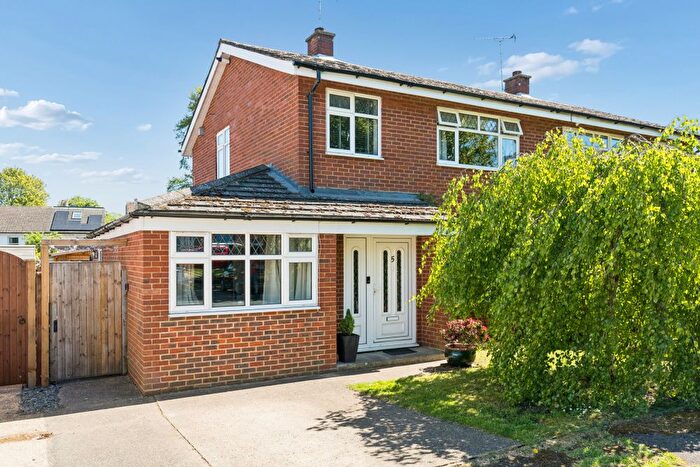
Properties for sale in Hitchin
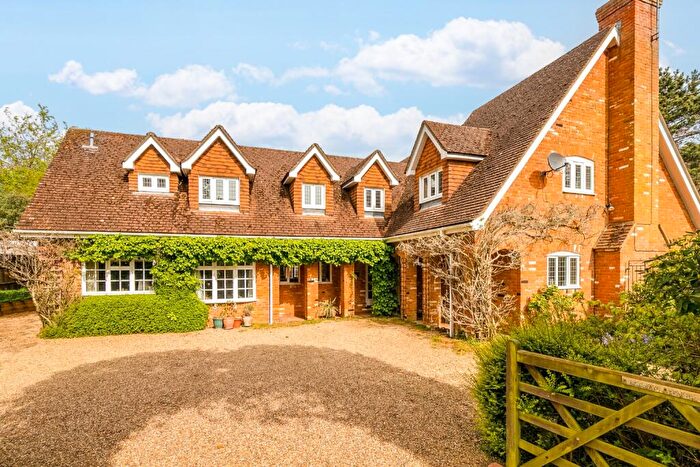
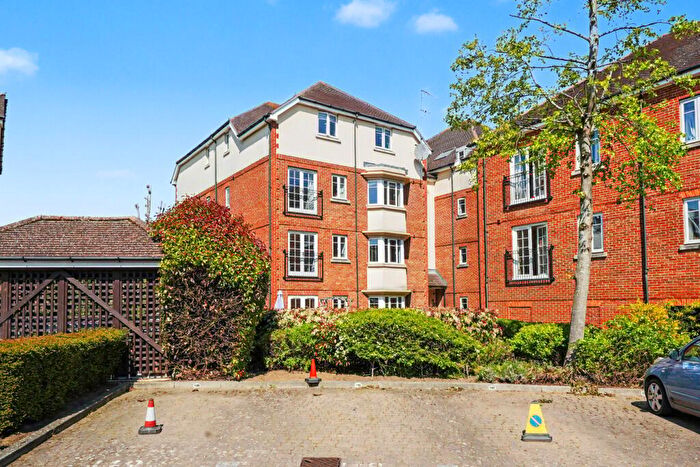
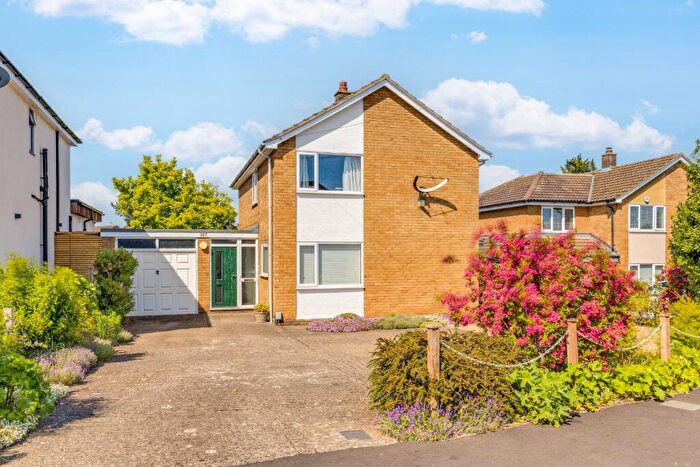
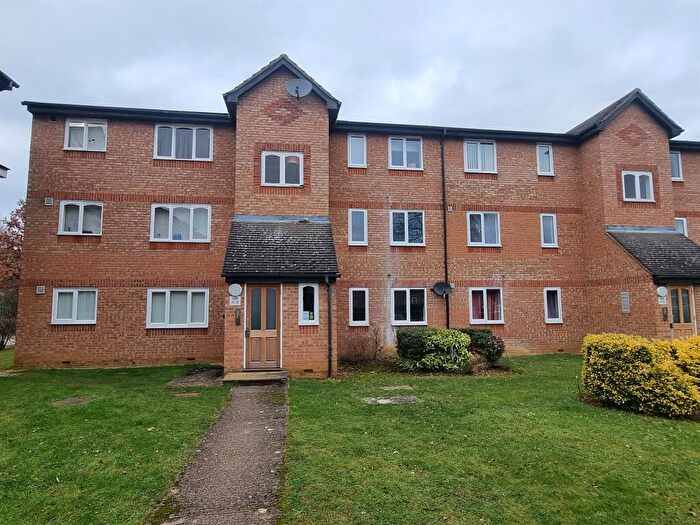
![]()
If you are looking to sell your house, let it out, or receive a property valuation, an expert can help you.
Click the button below to get started.

Neighbourhoods in Hitchin
Navigate through our locations to find the location of your next house in Hitchin, Hertfordshire for sale or to rent.
Transport in Hitchin
Please see below transportation links in this area:

- FAQ
- Price Paid By Year
- Property Type Price
Frequently asked questions about Hitchin
What is the average price for a property for sale in Hitchin?
The average price for a property for sale in Hitchin is £504,301. This amount is 5% lower than the average price in Hertfordshire. There are more than 10,000 property listings for sale in Hitchin.
What locations have the most expensive properties for sale in Hitchin?
The locations with the most expensive properties for sale in Hitchin are Kimpton at an average of £819,046, Hitchwood, Offa And Hoo at an average of £680,803 and Hitchin Priory at an average of £621,627.
What locations have the most affordable properties for sale in Hitchin?
The locations with the most affordable properties for sale in Hitchin are Hitchin Oughton at an average of £420,028, Codicote at an average of £428,348 and Hitchin Walsworth at an average of £436,201.
Which train stations are available in or near Hitchin?
Some of the train stations available in or near Hitchin are Hitchin, Letchworth and Stevenage.
Property Price Paid in Hitchin by Year
The average sold property price by year was:
| Year | Average Sold Price | Price Change |
Sold Properties
|
|---|---|---|---|
| 2026 | £579,056 | 10% |
56 Properties |
| 2025 | £521,454 | 3% |
722 Properties |
| 2024 | £504,379 | 5% |
739 Properties |
| 2023 | £477,567 | -2% |
622 Properties |
| 2022 | £485,003 | 4% |
789 Properties |
| 2021 | £466,782 | -2% |
999 Properties |
| 2020 | £477,750 | 10% |
702 Properties |
| 2019 | £429,243 | 1% |
807 Properties |
| 2018 | £425,656 | 0,4% |
817 Properties |
| 2017 | £424,078 | 8% |
853 Properties |
| 2016 | £391,401 | 11% |
882 Properties |
| 2015 | £349,796 | 10% |
1,063 Properties |
| 2014 | £314,500 | 8% |
936 Properties |
| 2013 | £288,597 | 2% |
864 Properties |
| 2012 | £282,072 | 3% |
685 Properties |
| 2011 | £273,896 | -2% |
735 Properties |
| 2010 | £279,310 | 15% |
728 Properties |
| 2009 | £236,479 | -14% |
740 Properties |
| 2008 | £270,176 | 3% |
558 Properties |
| 2007 | £263,035 | 3% |
1,248 Properties |
| 2006 | £255,869 | 8% |
1,281 Properties |
| 2005 | £234,133 | -0,1% |
943 Properties |
| 2004 | £234,329 | 13% |
982 Properties |
| 2003 | £204,848 | 17% |
1,026 Properties |
| 2002 | £170,450 | 8% |
1,195 Properties |
| 2001 | £157,356 | 15% |
1,099 Properties |
| 2000 | £133,855 | 17% |
886 Properties |
| 1999 | £111,085 | 4% |
1,059 Properties |
| 1998 | £106,554 | 13% |
963 Properties |
| 1997 | £92,462 | 7% |
1,180 Properties |
| 1996 | £85,851 | -2% |
983 Properties |
| 1995 | £87,522 | - |
743 Properties |
Property Price per Property Type in Hitchin
Here you can find historic sold price data in order to help with your property search.
The average Property Paid Price for specific property types in the last three years are:
| Property Type | Average Sold Price | Sold Properties |
|---|---|---|
| Semi Detached House | £561,194.00 | 570 Semi Detached Houses |
| Terraced House | £421,330.00 | 600 Terraced Houses |
| Detached House | £870,542.00 | 426 Detached Houses |
| Flat | £248,932.00 | 543 Flats |