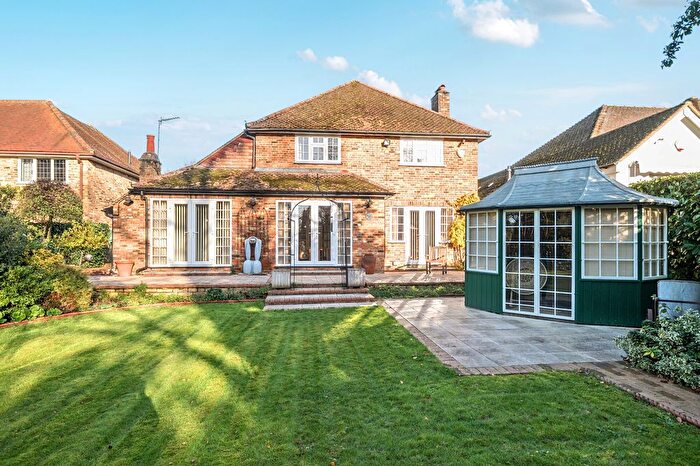
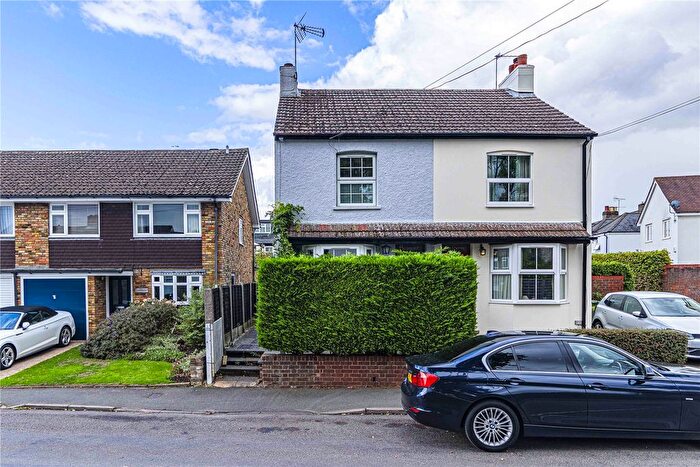
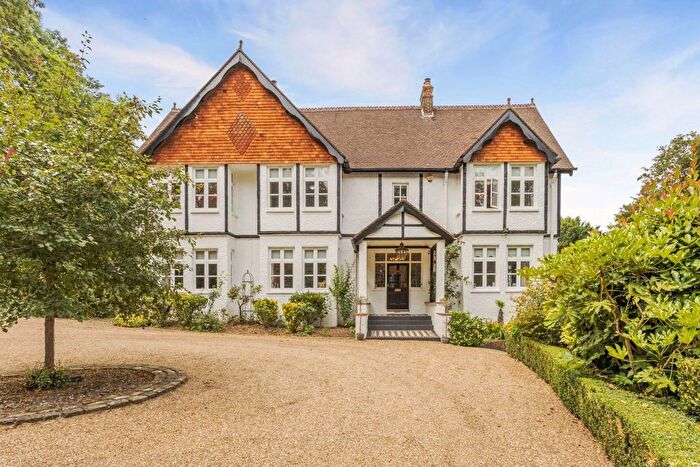
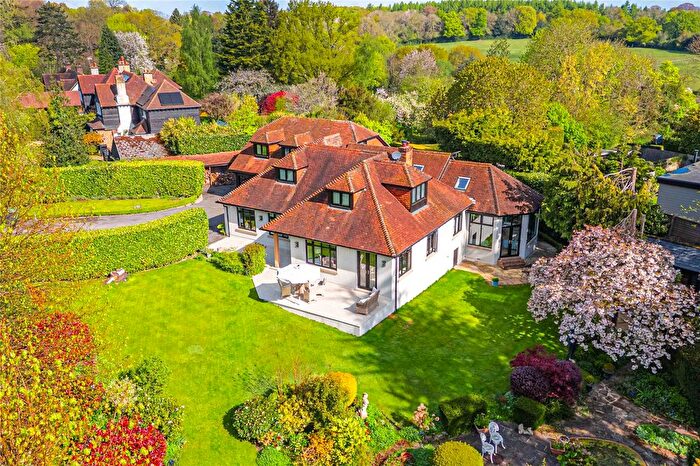
Houses for sale & to rent in Bovingdon, Flaunden And Chipperfield, Kings Langley
House Prices in Bovingdon, Flaunden And Chipperfield
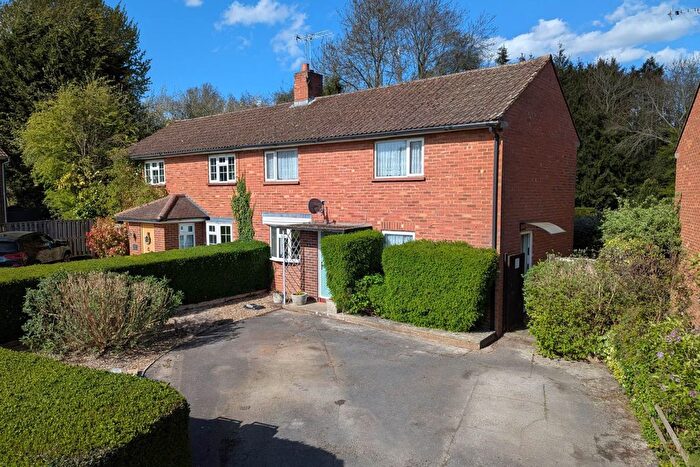
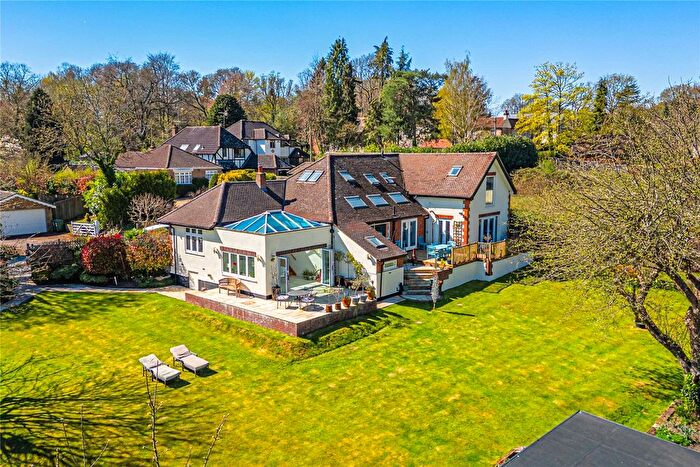
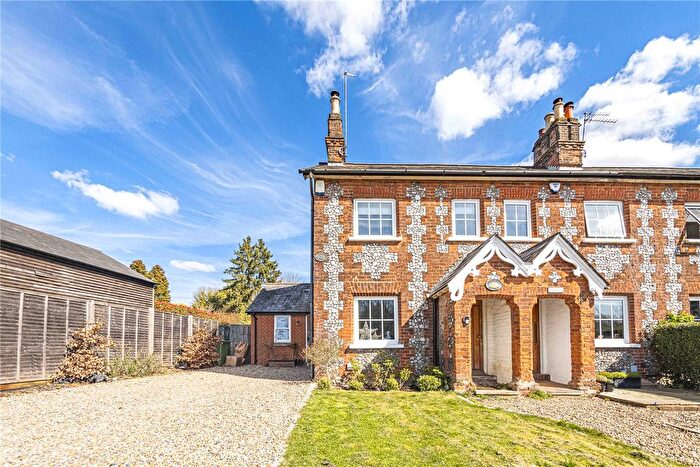
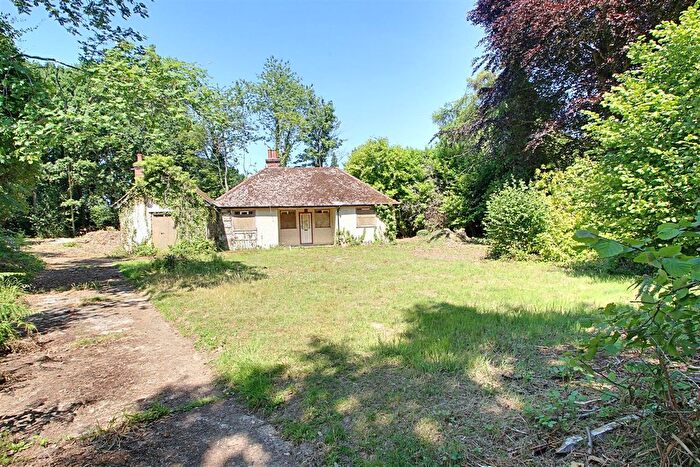
Properties in Bovingdon, Flaunden And Chipperfield have an average house price of £970,710.00 and had 82 Property Transactions within the last 3 years¹.
Bovingdon, Flaunden And Chipperfield is an area in Kings Langley, Hertfordshire with 746 households², where the most expensive property was sold for £3,750,000.00.
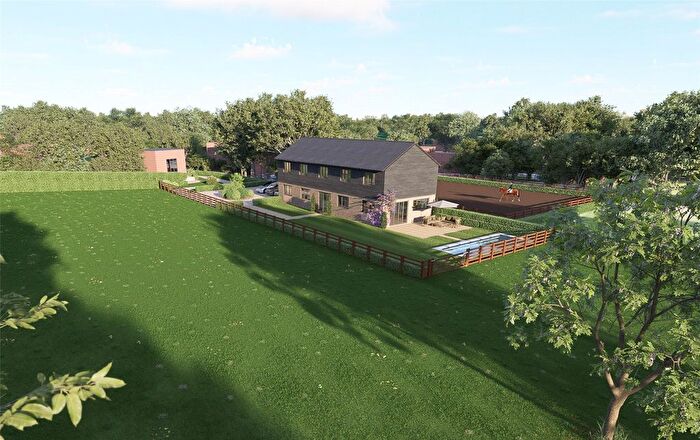
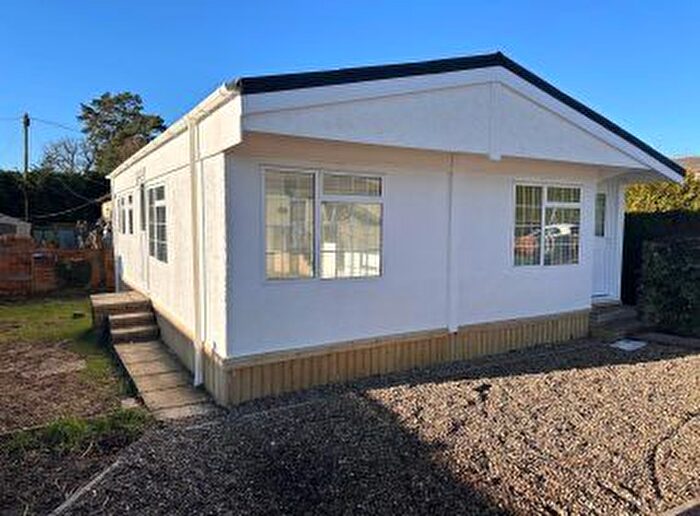
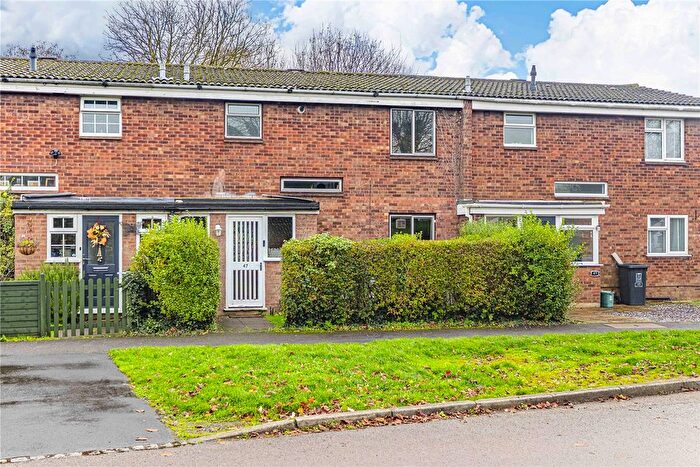
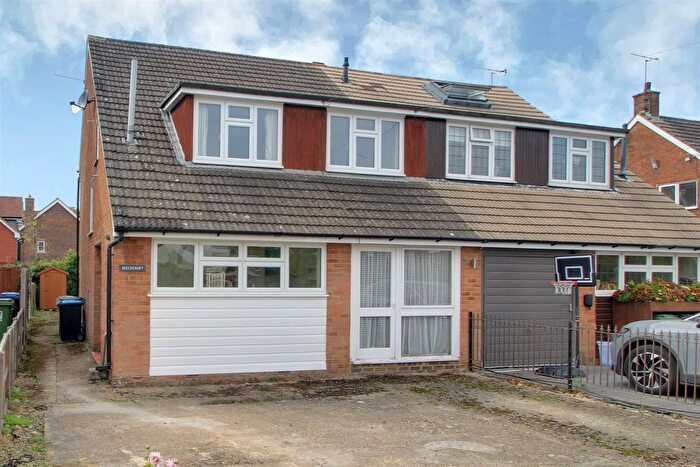
Properties for sale in Bovingdon, Flaunden And Chipperfield
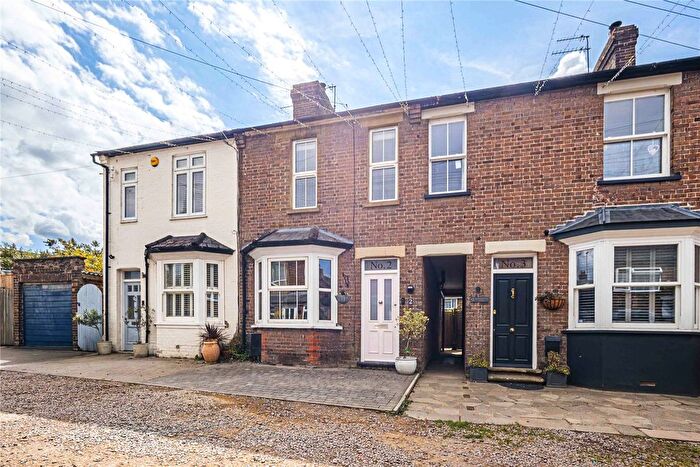
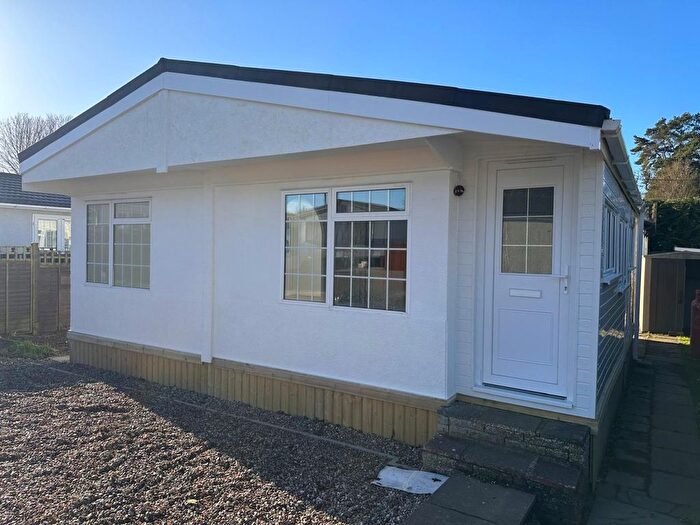
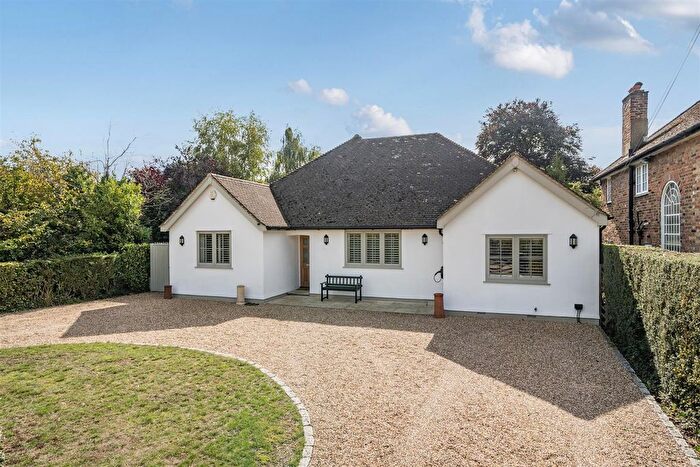
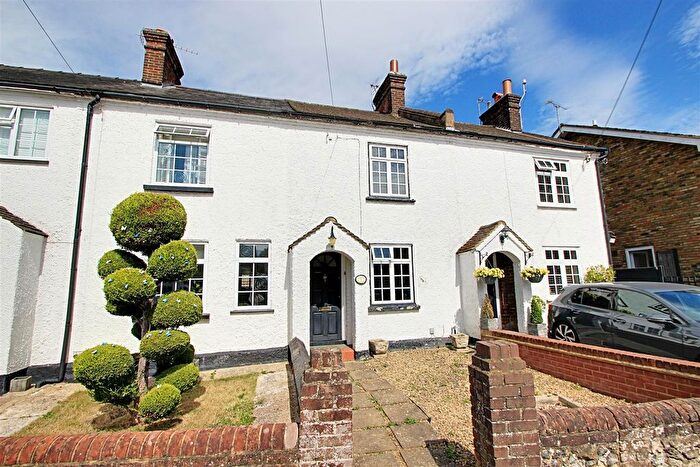
Previously listed properties in Bovingdon, Flaunden And Chipperfield
Roads and Postcodes in Bovingdon, Flaunden And Chipperfield
Navigate through our locations to find the location of your next house in Bovingdon, Flaunden And Chipperfield, Kings Langley for sale or to rent.
| Streets | Postcodes |
|---|---|
| Alexandra Road | WD4 9DS |
| Bulstrode Close | WD4 9LT |
| Bulstrode Cottages | WD4 9LU |
| Bulstrode Lane | WD4 9LG |
| Chapelcroft | WD4 9DP WD4 9DR WD4 9DT WD4 9EH WD4 9EJ WD4 9EL WD4 9EQ |
| Croft Close | WD4 9PA |
| Croft End Road | WD4 9DZ WD4 9EE WD4 9EF |
| Croft Field | WD4 9ED |
| Croft Lane | WD4 9DU WD4 9DX WD4 9DY |
| Croft Meadow | WD4 9EA WD4 9EB |
| Dunny Lane | WD4 9DB WD4 9DD WD4 9DF WD4 9DH |
| Fairydell Close | WD4 9FB |
| Forge Close | WD4 9DL |
| Glenrose Close | WD4 9NN |
| Kings Close | WD4 9ES |
| Kings Lane | WD4 9EN WD4 9EP |
| Kings Mews | WD4 9BF |
| Langley Road | WD4 9JG WD4 9JP WD4 9JQ WD4 9JR WD4 9JS WD4 9JH |
| Megg Lane | WD4 9JN WD4 9JW |
| New Road | WD4 9LL |
| Nunfield | WD4 9EW |
| Nursery Gardens | WD4 9FA |
| Queen Street | WD4 9BT |
| Rucklers Lane | WD4 9LD WD4 9LE WD4 9LF |
| Scatterdells Lane | WD4 9ET WD4 9EU WD4 9EX WD4 9EY WD4 9EZ |
| Scatterdells Park | WD4 9DW |
| St Pauls Court | WD4 9BQ |
| Stoney Lane | WD4 9LS |
| The Common | WD4 9BL WD4 9BN WD4 9BS WD4 9BU WD4 9BY |
| The Grove | WD4 9JF |
| The Street | WD4 9BH WD4 9BJ |
| Tower Hill | WD4 9LH WD4 9LJ WD4 9LN WD4 9LP WD4 9LR WD4 9LW |
| Tulip Close | WD4 9DN |
| Wayside | WD4 9JJ WD4 9JL |
Transport near Bovingdon, Flaunden And Chipperfield
- FAQ
- Price Paid By Year
- Property Type Price
Frequently asked questions about Bovingdon, Flaunden And Chipperfield
What is the average price for a property for sale in Bovingdon, Flaunden And Chipperfield?
The average price for a property for sale in Bovingdon, Flaunden And Chipperfield is £970,710. This amount is 49% higher than the average price in Kings Langley. There are 99 property listings for sale in Bovingdon, Flaunden And Chipperfield.
What streets have the most expensive properties for sale in Bovingdon, Flaunden And Chipperfield?
The streets with the most expensive properties for sale in Bovingdon, Flaunden And Chipperfield are Wayside at an average of £1,740,000, Kings Lane at an average of £1,578,333 and Megg Lane at an average of £1,401,250.
What streets have the most affordable properties for sale in Bovingdon, Flaunden And Chipperfield?
The streets with the most affordable properties for sale in Bovingdon, Flaunden And Chipperfield are Croft Close at an average of £300,400, Croft End Road at an average of £481,666 and St Pauls Court at an average of £550,000.
Which train stations are available in or near Bovingdon, Flaunden And Chipperfield?
Some of the train stations available in or near Bovingdon, Flaunden And Chipperfield are Apsley, King's Langley and Hemel Hempstead.
Property Price Paid in Bovingdon, Flaunden And Chipperfield by Year
The average sold property price by year was:
| Year | Average Sold Price | Price Change |
Sold Properties
|
|---|---|---|---|
| 2025 | £970,076 | -7% |
13 Properties |
| 2024 | £1,041,647 | -17% |
17 Properties |
| 2023 | £1,220,416 | 34% |
18 Properties |
| 2022 | £803,286 | 12% |
34 Properties |
| 2021 | £709,084 | -26% |
35 Properties |
| 2020 | £894,619 | 4% |
21 Properties |
| 2019 | £859,035 | 27% |
14 Properties |
| 2018 | £627,527 | 4% |
18 Properties |
| 2017 | £602,780 | -49% |
25 Properties |
| 2016 | £897,537 | 20% |
27 Properties |
| 2015 | £717,604 | 24% |
35 Properties |
| 2014 | £543,516 | 5% |
30 Properties |
| 2013 | £518,159 | -34% |
26 Properties |
| 2012 | £694,696 | 24% |
17 Properties |
| 2011 | £529,178 | -7% |
30 Properties |
| 2010 | £568,861 | -6% |
26 Properties |
| 2009 | £601,944 | -10% |
18 Properties |
| 2008 | £665,000 | 20% |
15 Properties |
| 2007 | £530,321 | 25% |
40 Properties |
| 2006 | £397,136 | -17% |
34 Properties |
| 2005 | £464,278 | -8% |
25 Properties |
| 2004 | £503,670 | 20% |
36 Properties |
| 2003 | £400,733 | 6% |
31 Properties |
| 2002 | £377,493 | 34% |
37 Properties |
| 2001 | £250,102 | -13% |
34 Properties |
| 2000 | £282,904 | 10% |
32 Properties |
| 1999 | £253,284 | 15% |
50 Properties |
| 1998 | £215,250 | 15% |
32 Properties |
| 1997 | £182,414 | 7% |
32 Properties |
| 1996 | £169,291 | 25% |
34 Properties |
| 1995 | £127,053 | - |
28 Properties |
Property Price per Property Type in Bovingdon, Flaunden And Chipperfield
Here you can find historic sold price data in order to help with your property search.
The average Property Paid Price for specific property types in the last three years are:
| Property Type | Average Sold Price | Sold Properties |
|---|---|---|
| Semi Detached House | £717,404.00 | 21 Semi Detached Houses |
| Detached House | £1,266,172.00 | 45 Detached Houses |
| Terraced House | £530,615.00 | 13 Terraced Houses |
| Flat | £219,000.00 | 3 Flats |

