
Houses for sale & to rent in Kings Langley, Hertfordshire
House Prices in Kings Langley
Properties in Kings Langley have an average house price of £655k and had 455 Property Transactions within the last 3 years.¹
Kings Langley is an area in Hertfordshire with 4,725 households², where the most expensive property was sold for £3.75M.
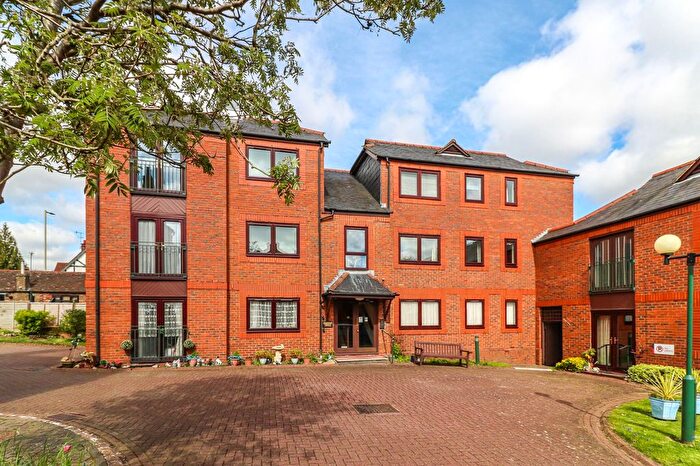
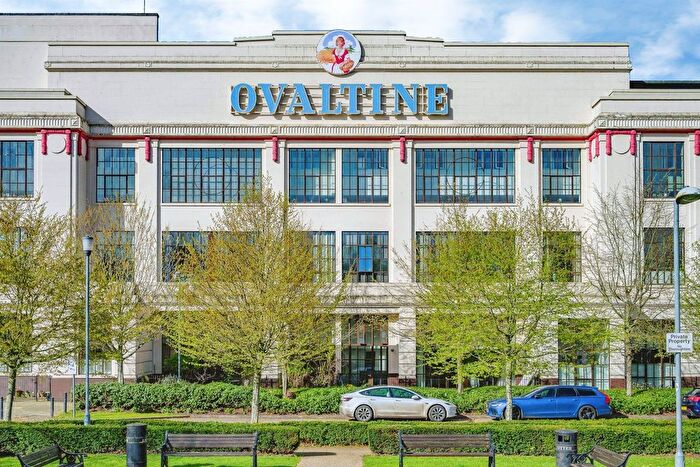
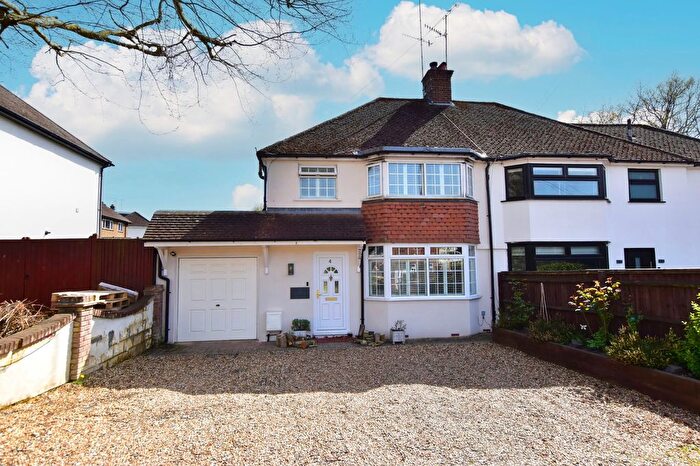
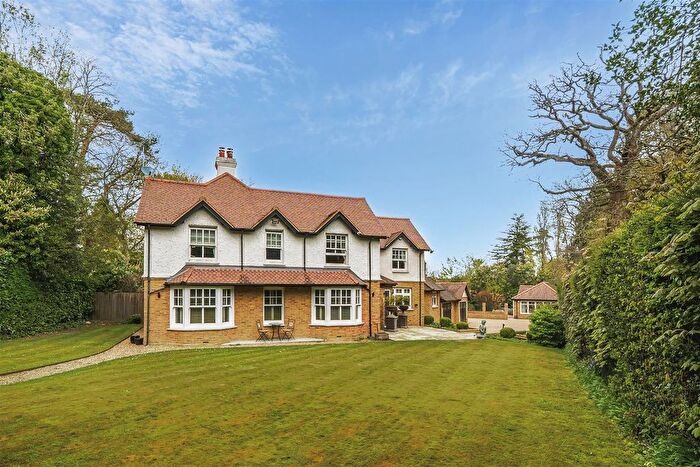
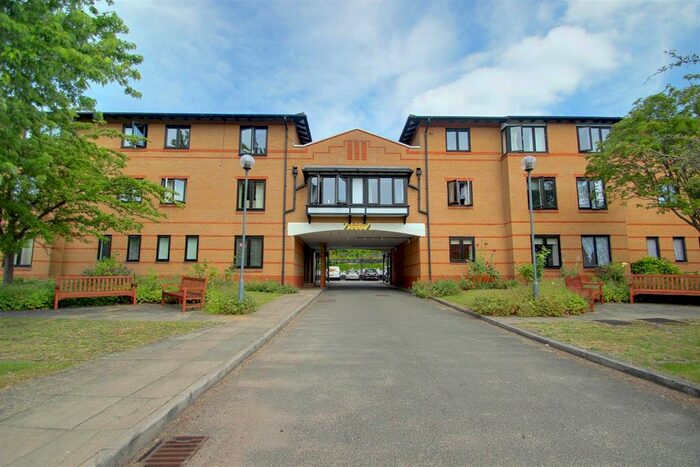
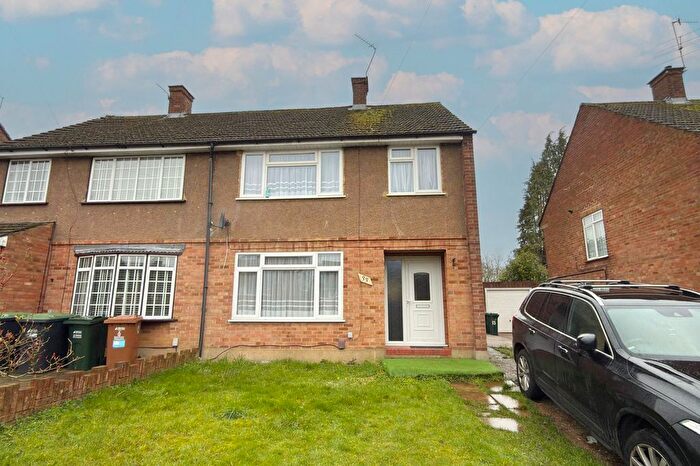
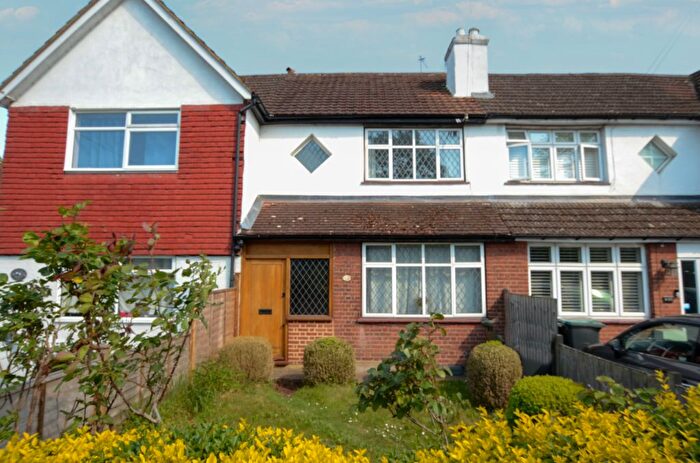
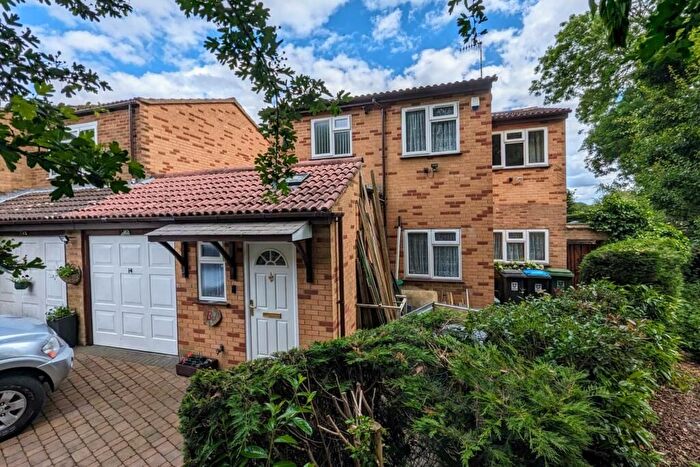
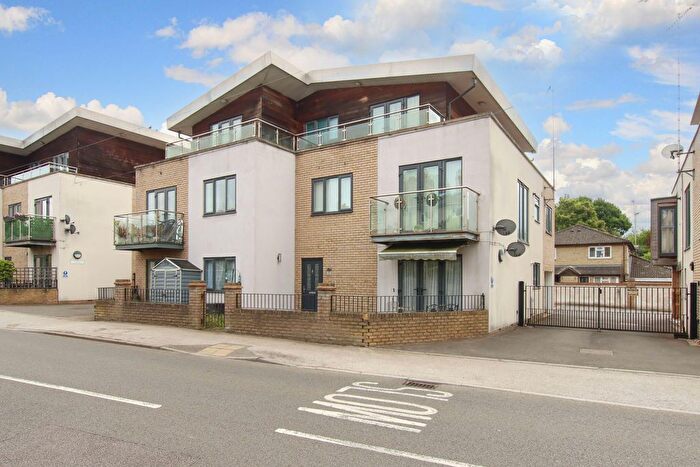
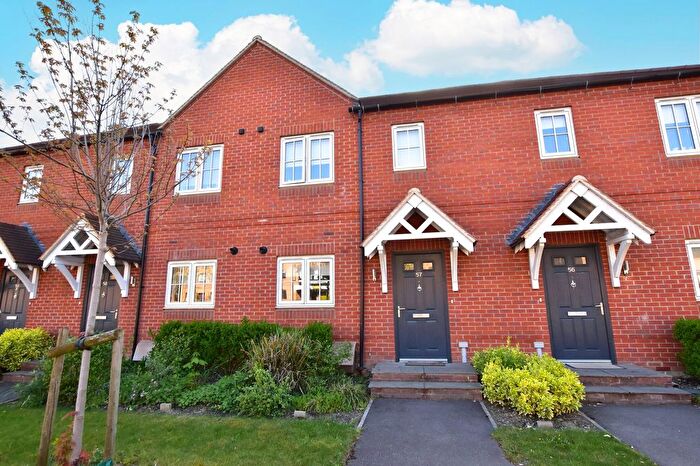
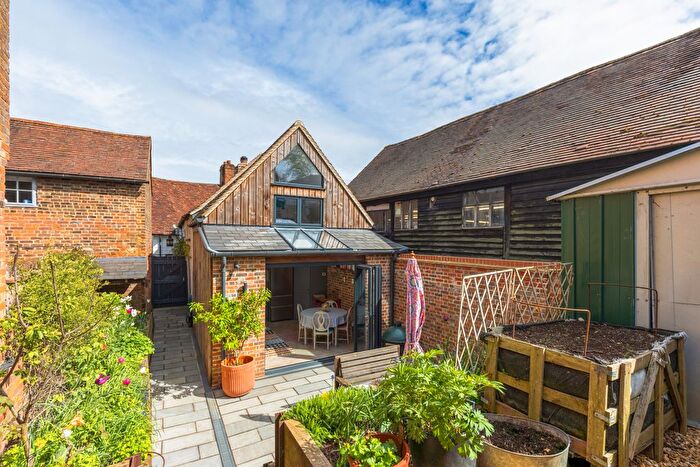
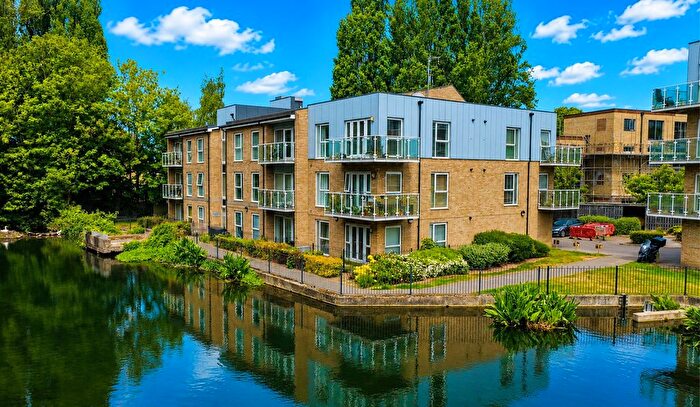
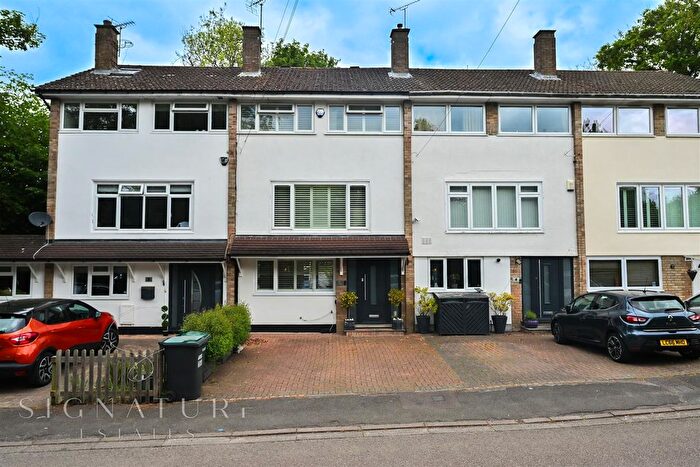
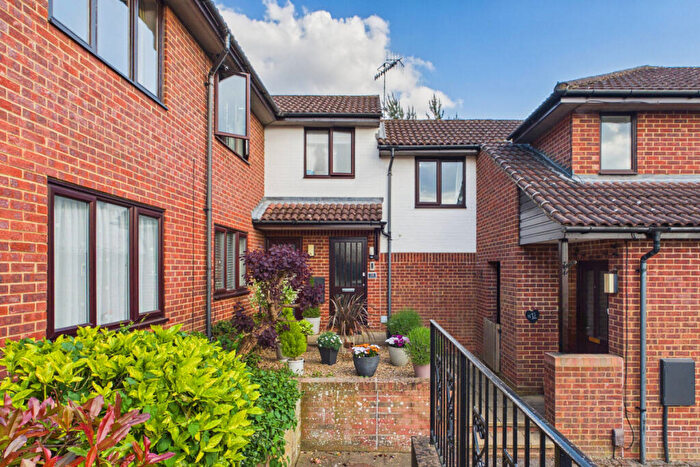
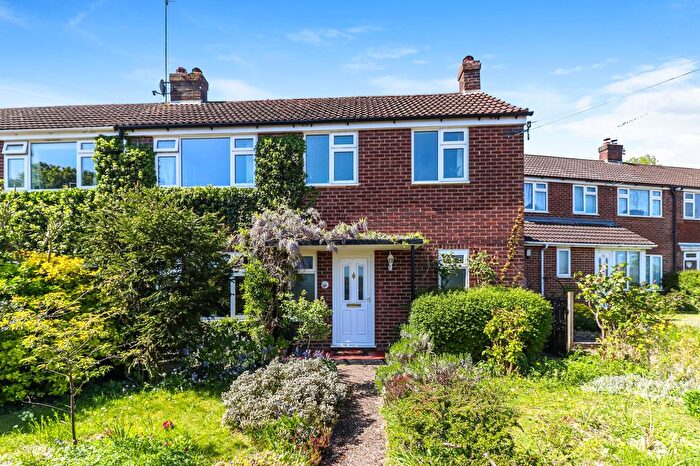
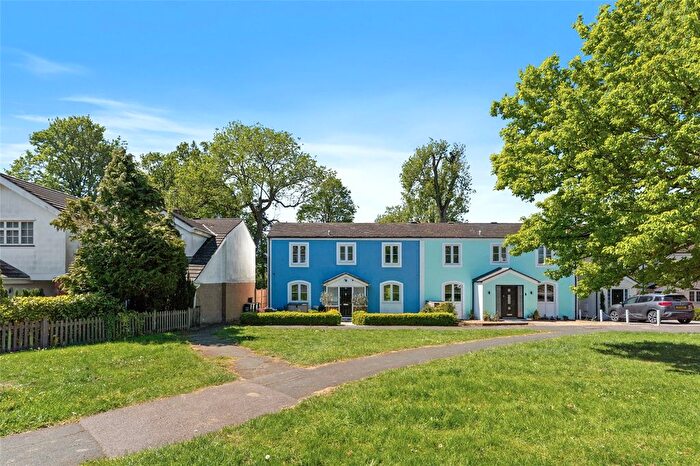
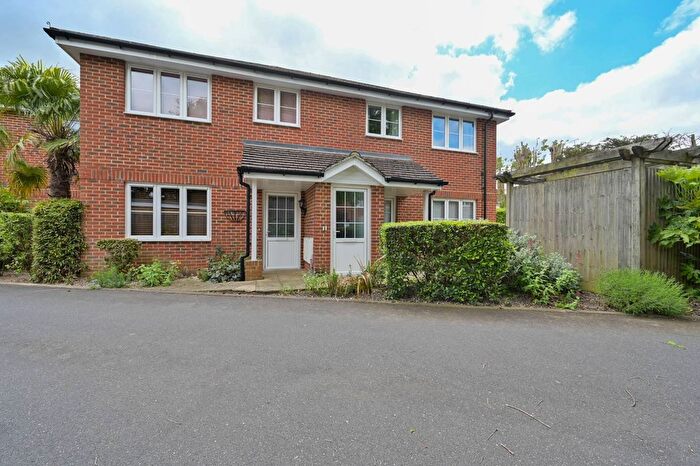
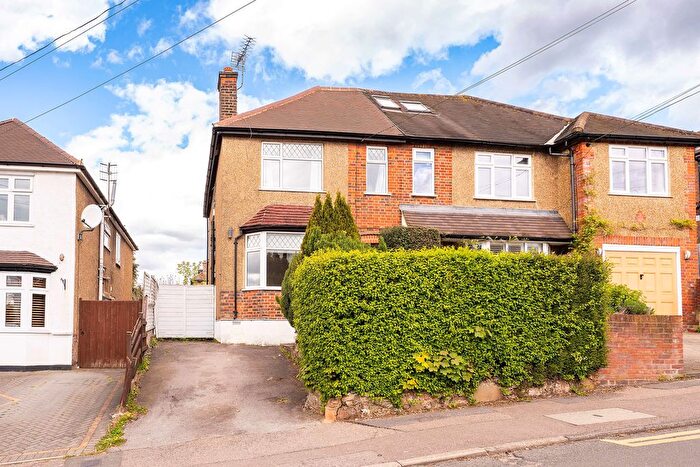
Properties for sale in Kings Langley
![]()
If you are looking to sell your house, let it out, or receive a property valuation, an expert can help you.
Click the button below to get started.

Neighbourhoods in Kings Langley
Navigate through our locations to find the location of your next house in Kings Langley, Hertfordshire for sale or to rent.
Transport in Kings Langley
Please see below transportation links in this area:

- FAQ
- Price Paid By Year
- Property Type Price
Frequently asked questions about Kings Langley
What is the average price for a property for sale in Kings Langley?
The average price for a property for sale in Kings Langley is £654,565. This amount is 23% higher than the average price in Hertfordshire. There are 9,066 property listings for sale in Kings Langley.
What locations have the most expensive properties for sale in Kings Langley?
The locations with the most expensive properties for sale in Kings Langley are Bovingdon, Flaunden And Chipperfield at an average of £1,060,836, Chorleywood North And Sarratt at an average of £975,312 and Abbots Langley And Bedmond at an average of £878,000.
What locations have the most affordable properties for sale in Kings Langley?
The locations with the most affordable properties for sale in Kings Langley are Gade Valley at an average of £504,449 and Kings Langley at an average of £630,661.
Which train stations are available in or near Kings Langley?
Some of the train stations available in or near Kings Langley are King's Langley, Apsley and Hemel Hempstead.
Property Price Paid in Kings Langley by Year
The average sold property price by year was:
| Year | Average Sold Price | Price Change |
Sold Properties
|
|---|---|---|---|
| 2026 | £596,045 | -14% |
11 Properties |
| 2025 | £680,354 | 4% |
136 Properties |
| 2024 | £654,283 | 3% |
159 Properties |
| 2023 | £635,646 | -2% |
149 Properties |
| 2022 | £647,570 | 4% |
206 Properties |
| 2021 | £618,680 | 7% |
269 Properties |
| 2020 | £573,946 | 17% |
165 Properties |
| 2019 | £474,621 | -14% |
208 Properties |
| 2018 | £539,477 | -2% |
160 Properties |
| 2017 | £549,653 | 1% |
178 Properties |
| 2016 | £544,559 | 8% |
210 Properties |
| 2015 | £499,249 | 11% |
241 Properties |
| 2014 | £443,496 | 7% |
220 Properties |
| 2013 | £410,798 | -3% |
206 Properties |
| 2012 | £423,481 | 13% |
142 Properties |
| 2011 | £369,433 | -5% |
177 Properties |
| 2010 | £387,188 | 8% |
154 Properties |
| 2009 | £357,229 | -1% |
152 Properties |
| 2008 | £360,541 | 3% |
197 Properties |
| 2007 | £348,853 | 11% |
349 Properties |
| 2006 | £311,728 | -4% |
354 Properties |
| 2005 | £325,301 | -5% |
190 Properties |
| 2004 | £342,192 | 15% |
200 Properties |
| 2003 | £291,258 | 11% |
191 Properties |
| 2002 | £259,807 | 13% |
261 Properties |
| 2001 | £225,516 | 7% |
254 Properties |
| 2000 | £210,494 | 12% |
206 Properties |
| 1999 | £186,110 | 13% |
265 Properties |
| 1998 | £161,203 | 15% |
204 Properties |
| 1997 | £137,196 | 11% |
220 Properties |
| 1996 | £122,403 | -1% |
228 Properties |
| 1995 | £123,277 | - |
175 Properties |
Property Price per Property Type in Kings Langley
Here you can find historic sold price data in order to help with your property search.
The average Property Paid Price for specific property types in the last three years are:
| Property Type | Average Sold Price | Sold Properties |
|---|---|---|
| Flat | £277,614.00 | 107 Flats |
| Semi Detached House | £619,212.00 | 120 Semi Detached Houses |
| Detached House | £994,374.00 | 161 Detached Houses |
| Terraced House | £503,321.00 | 67 Terraced Houses |