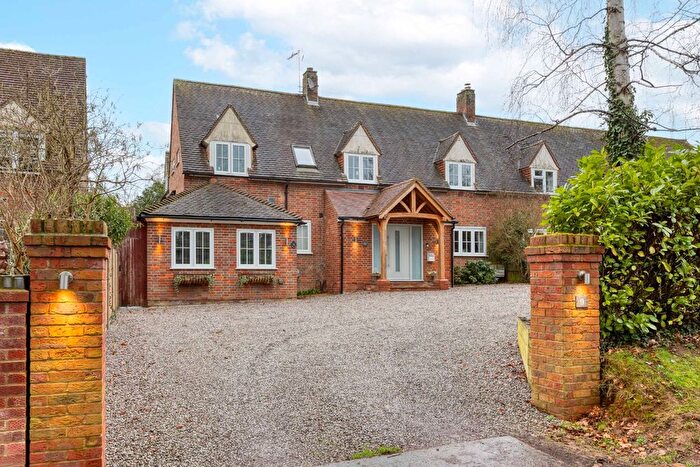
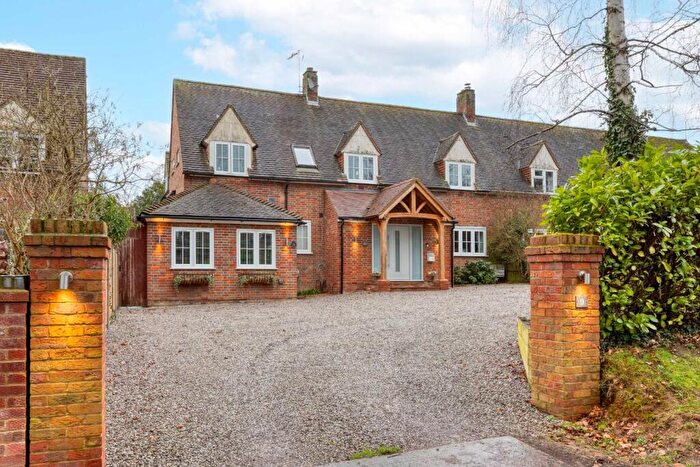
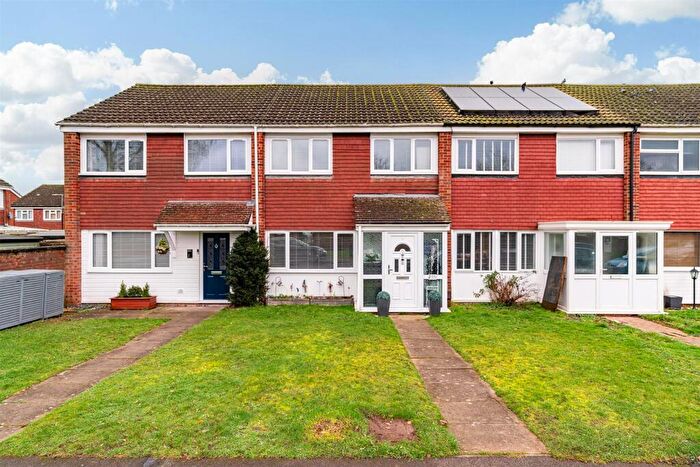
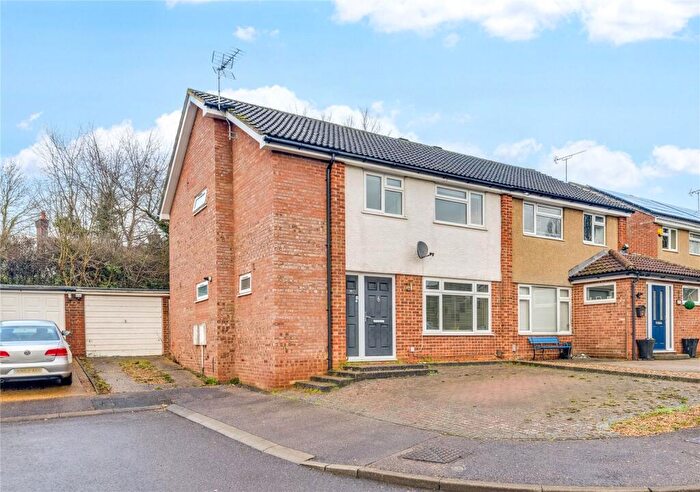
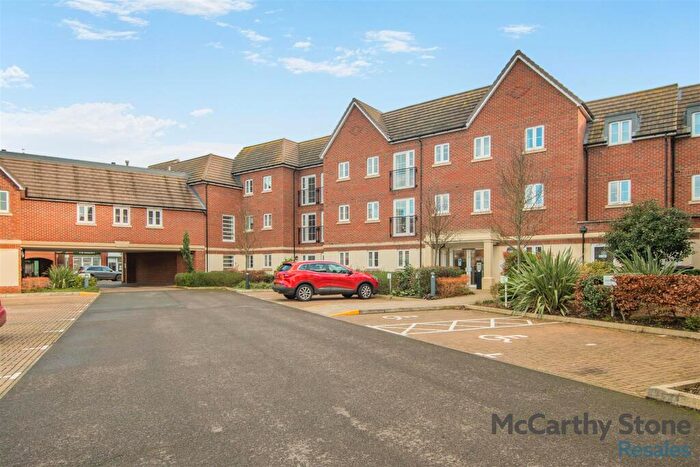
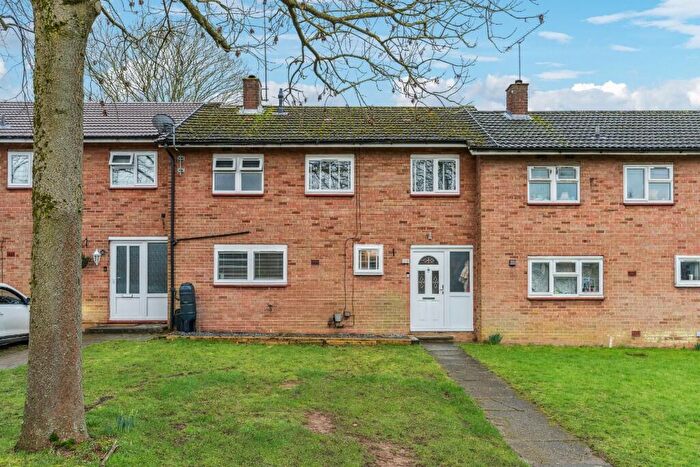
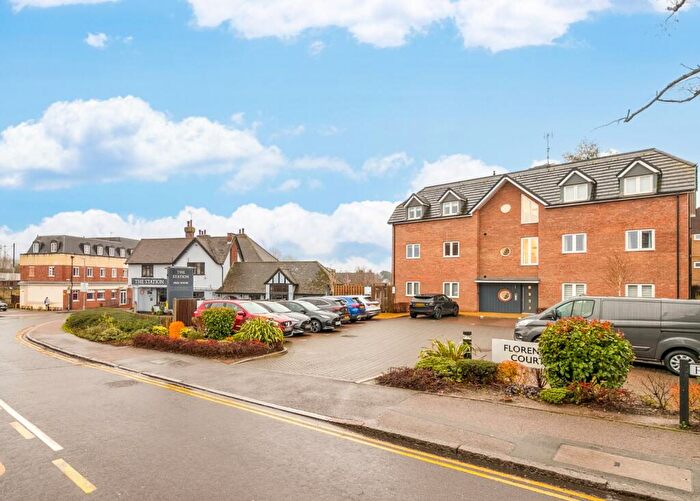
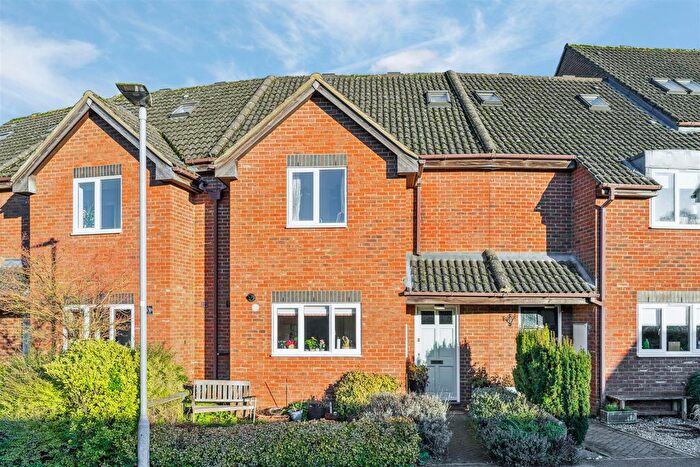
Houses for sale & to rent in Knebworth, Knebworth
House Prices in Knebworth
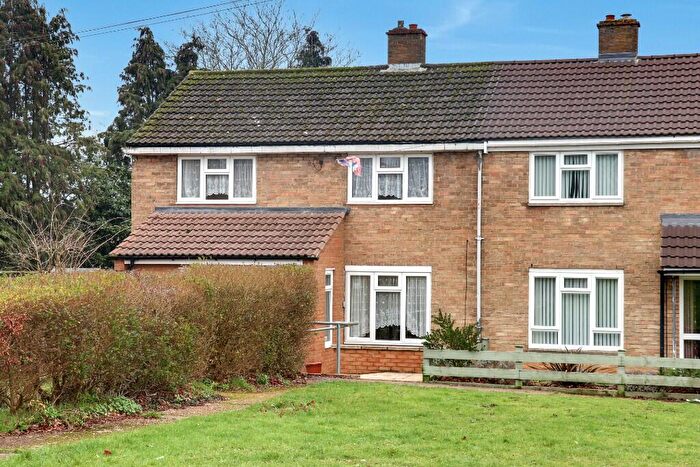
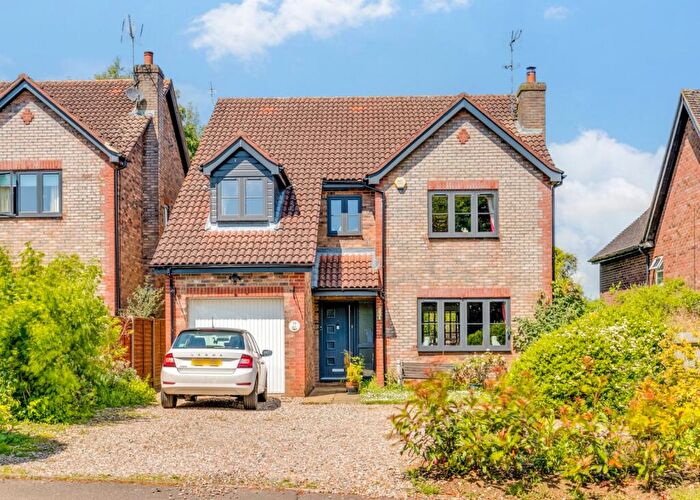
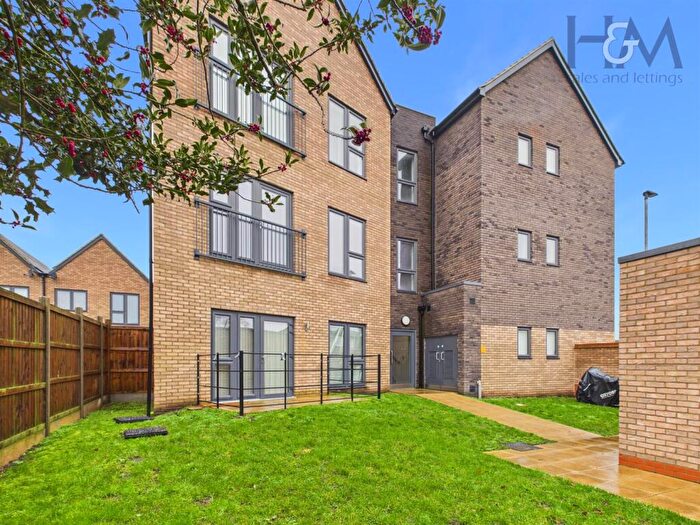
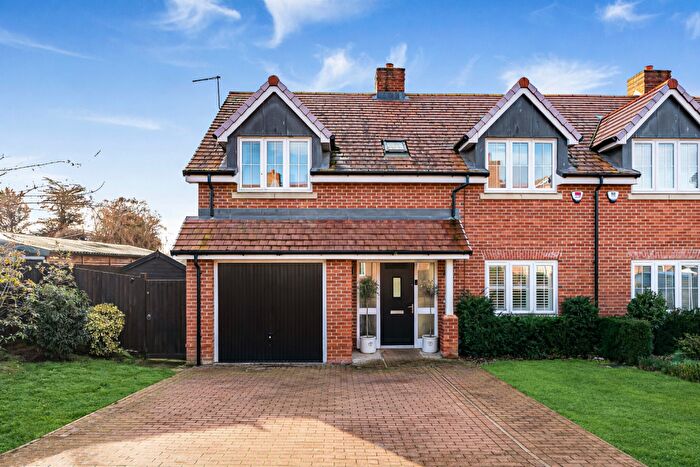
Properties in Knebworth have an average house price of £491,373.00 and had 200 Property Transactions within the last 3 years¹.
Knebworth is an area in Knebworth, Hertfordshire with 1,930 households², where the most expensive property was sold for £1,570,000.00.
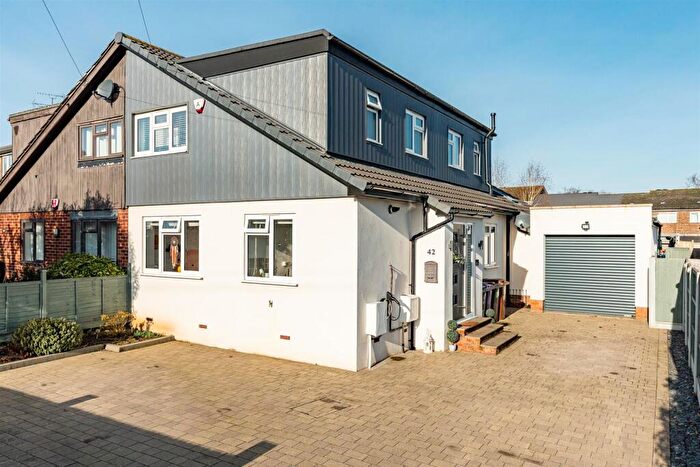
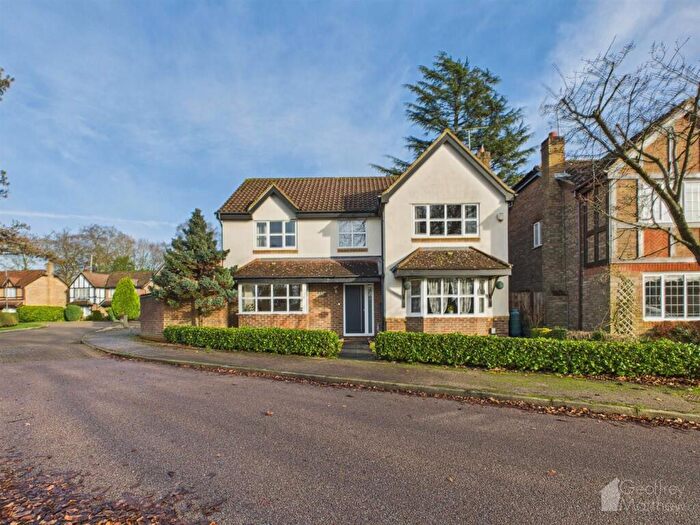
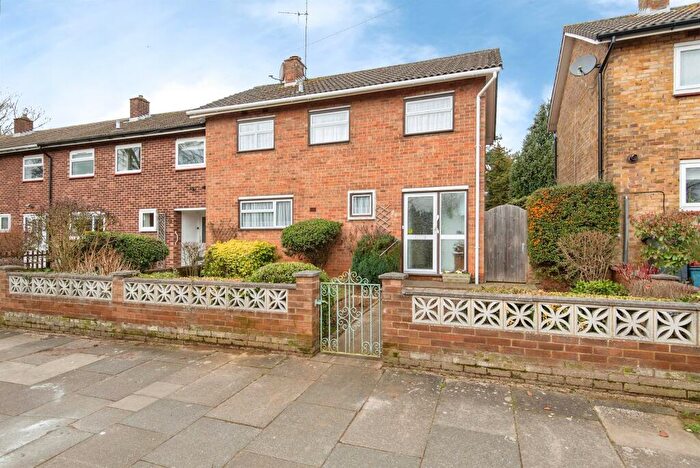
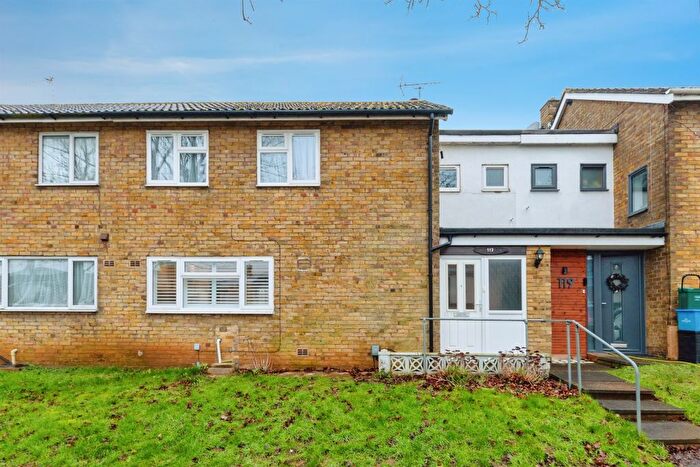
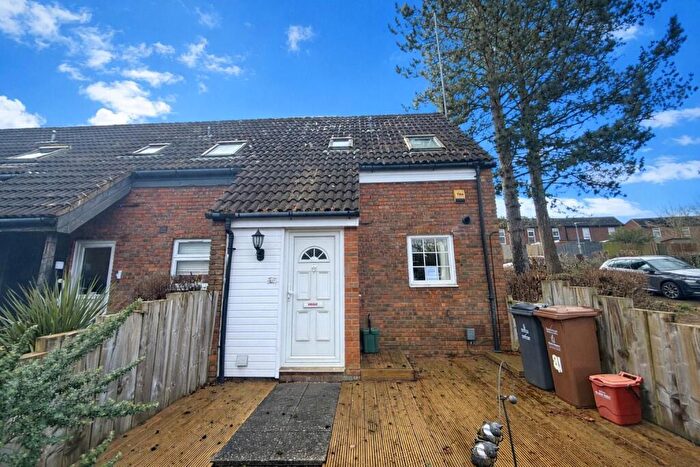
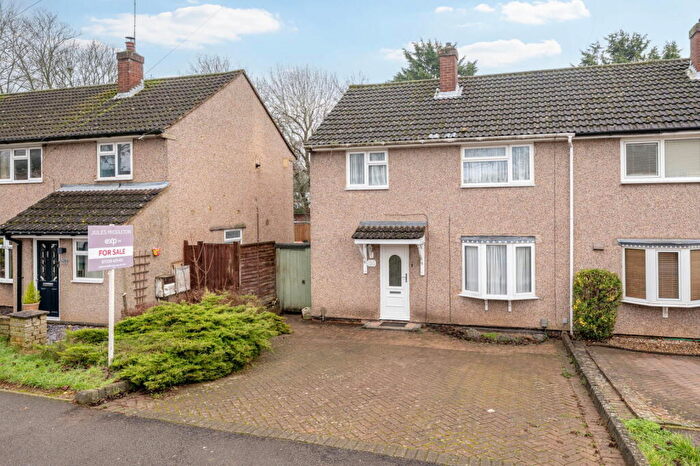
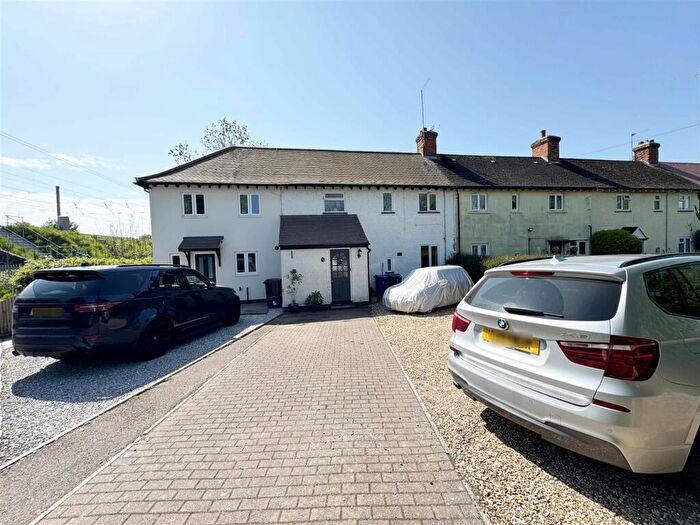
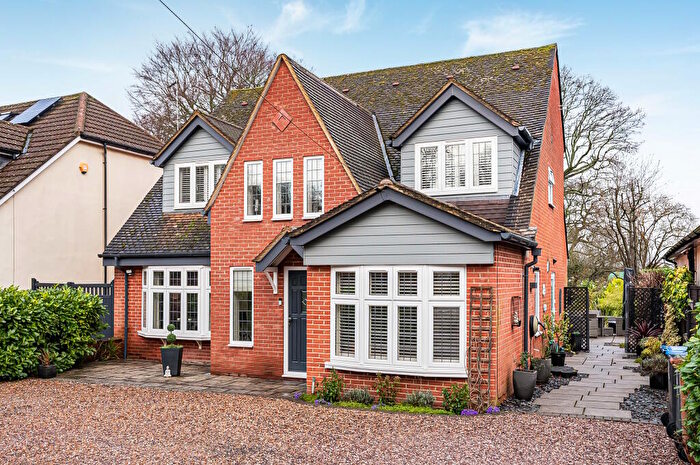
Properties for sale in Knebworth
Roads and Postcodes in Knebworth
Navigate through our locations to find the location of your next house in Knebworth, Knebworth for sale or to rent.
| Streets | Postcodes |
|---|---|
| Badger Close | SG3 6NA |
| Bell Close | SG3 6AJ |
| Bellamy Close | SG3 6EH |
| Broom Grove | SG3 6BQ SG3 6BZ |
| Cherry Close | SG3 6DS |
| Church Gardens | SG3 6AR |
| Church Place | SG3 6NX |
| Constance Place | SG3 6EE |
| Crabtree Road | SG3 6DZ |
| Danecote | SG3 6PB |
| Deanscroft | SG3 6BB SG3 6BD |
| Deards End Lane | SG3 6NL |
| Deards Wood | SG3 6PG |
| Deepings Close | SG3 6BW |
| Devey Close | SG3 6EN |
| Gibbons Way | SG3 6BX |
| Gipsy Lane | SG3 6DJ SG3 6PL |
| Gun Lane | SG3 6AU SG3 6BH SG3 6BJ |
| Gun Meadow Avenue | SG3 6BS |
| Gun Road | SG3 6BP |
| Gun Road Gardens | SG3 6EB SG3 6ED |
| Haygarth | SG3 6HE SG3 6HF |
| Hitchin Lane | SG3 6QL |
| Hollycroft Mews | SG3 6DR |
| Hornbeam Spring | SG3 6AX SG3 6AY SG3 6BE |
| Keiths Wood | SG3 6PU |
| Kerr Close | SG3 6AB SG3 6AL |
| Knebworth Park | SG3 6HQ SG3 6PX SG3 6PY |
| London Road | SG3 6EX SG3 6EY SG3 6HB SG3 6HG SG3 6HH SG3 6HJ |
| Lowe House | SG3 6EU |
| Lytton Fields | SG3 6AZ SG3 6BA |
| Manor Farm Stables | SG3 6SL |
| Meadway | SG3 6DN |
| Milestone Road | SG3 6DA |
| Muirhead Way | SG3 6BY |
| New Close | SG3 6NU |
| Nup End | SG3 6QJ |
| Nup End Green | SG3 6QH |
| Oak Tree Gardens | SG3 6EQ |
| Oakfields Avenue | SG3 6NP |
| Oakfields Road | SG3 6NS |
| Old Lane | SG3 6AD SG3 6AE SG3 6AF |
| Orchard Way | SG3 6BT SG3 6BU |
| Park Lane | SG3 6DY SG3 6PD SG3 6PE SG3 6PF SG3 6PH SG3 6PP SG3 6PR SG3 6PS SG3 6PW SG3 6QA SG3 6QB SG3 6QD SG3 6QF SG3 6RF SG3 6QE SG3 6FQ |
| Peters Way | SG3 6HP |
| Pondcroft Road | SG3 6DB SG3 6DE SG3 6DF |
| Sayer Way | SG3 6BN |
| Slip Lane | SG3 6QG |
| St Martins Road | SG3 6DD SG3 6EL SG3 6ER SG3 6EP |
| Station Approach | SG3 6AT SG3 6HL |
| Station Road | SG3 6AP |
| Stevenage Road | SG3 6AN SG3 6AW SG3 6NN |
| Stobarts Close | SG3 6ND |
| Stockens Dell | SG3 6BG |
| Stockens Green | SG3 6DG SG3 6DH SG3 6DQ |
| Stone Croft | SG3 6BL |
| Swangleys Lane | SG3 6AA SG3 6QX |
| The Green | SG3 6QN |
| Wadnall Way | SG3 6DT SG3 6DU SG3 6DX SG3 6DP |
| Watton Road | SG3 6AG SG3 6AH SG3 6AQ |
| Westland Road | SG3 6AS |
| Woodstock | SG3 6EA |
| SG3 6PT SG3 6EW SG3 6UE SG3 6UT SG3 6UZ SG3 6XN SG3 6XZ SG3 6YY SG3 6YZ |
Transport near Knebworth
- FAQ
- Price Paid By Year
- Property Type Price
Frequently asked questions about Knebworth
What is the average price for a property for sale in Knebworth?
The average price for a property for sale in Knebworth is £491,373. This amount is 3% lower than the average price in Knebworth. There are 1,093 property listings for sale in Knebworth.
What streets have the most expensive properties for sale in Knebworth?
The streets with the most expensive properties for sale in Knebworth are Deards End Lane at an average of £1,404,125, Oakfields Road at an average of £931,000 and Swangleys Lane at an average of £920,000.
What streets have the most affordable properties for sale in Knebworth?
The streets with the most affordable properties for sale in Knebworth are Haygarth at an average of £217,812, Cherry Close at an average of £231,666 and Kerr Close at an average of £260,267.
Which train stations are available in or near Knebworth?
Some of the train stations available in or near Knebworth are Knebworth, Stevenage and Welwyn North.
Property Price Paid in Knebworth by Year
The average sold property price by year was:
| Year | Average Sold Price | Price Change |
Sold Properties
|
|---|---|---|---|
| 2025 | £511,908 | 7% |
55 Properties |
| 2024 | £477,687 | -3% |
81 Properties |
| 2023 | £491,047 | 2% |
64 Properties |
| 2022 | £483,252 | -1% |
78 Properties |
| 2021 | £486,807 | 13% |
99 Properties |
| 2020 | £421,403 | -19% |
130 Properties |
| 2019 | £502,484 | 10% |
81 Properties |
| 2018 | £450,168 | -5% |
69 Properties |
| 2017 | £471,054 | 8% |
83 Properties |
| 2016 | £433,652 | 10% |
101 Properties |
| 2015 | £390,277 | -12% |
82 Properties |
| 2014 | £436,923 | 27% |
93 Properties |
| 2013 | £319,246 | -3% |
63 Properties |
| 2012 | £329,640 | 18% |
80 Properties |
| 2011 | £270,691 | -12% |
61 Properties |
| 2010 | £304,093 | -0,4% |
61 Properties |
| 2009 | £305,223 | -4% |
59 Properties |
| 2008 | £318,442 | - |
56 Properties |
| 2007 | £318,444 | 12% |
134 Properties |
| 2006 | £279,100 | -5% |
119 Properties |
| 2005 | £293,580 | 17% |
110 Properties |
| 2004 | £242,227 | 13% |
98 Properties |
| 2003 | £209,802 | -6% |
104 Properties |
| 2002 | £222,454 | 19% |
127 Properties |
| 2001 | £180,027 | 20% |
110 Properties |
| 2000 | £143,211 | 11% |
146 Properties |
| 1999 | £127,281 | 8% |
141 Properties |
| 1998 | £117,107 | 15% |
140 Properties |
| 1997 | £100,004 | 3% |
143 Properties |
| 1996 | £96,980 | 1% |
118 Properties |
| 1995 | £96,071 | - |
105 Properties |
Property Price per Property Type in Knebworth
Here you can find historic sold price data in order to help with your property search.
The average Property Paid Price for specific property types in the last three years are:
| Property Type | Average Sold Price | Sold Properties |
|---|---|---|
| Semi Detached House | £550,599.00 | 52 Semi Detached Houses |
| Detached House | £791,682.00 | 41 Detached Houses |
| Terraced House | £395,835.00 | 44 Terraced Houses |
| Flat | £313,774.00 | 63 Flats |

