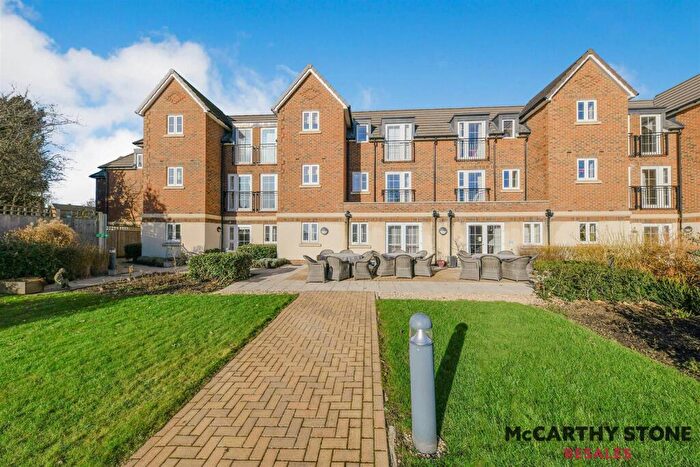
Houses for sale & to rent in Welwyn East, Knebworth
House Prices in Welwyn East
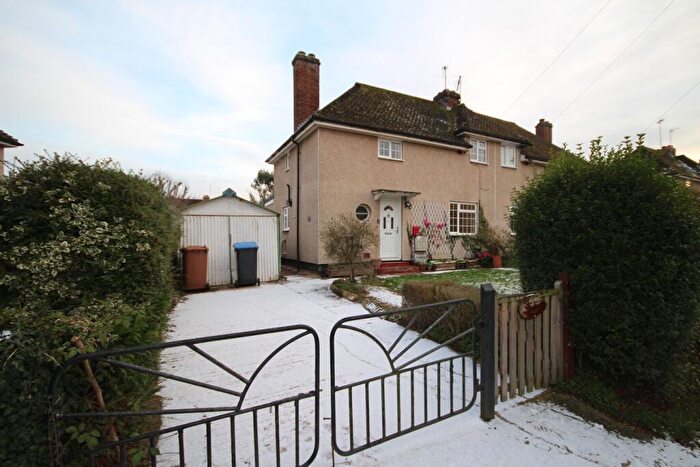
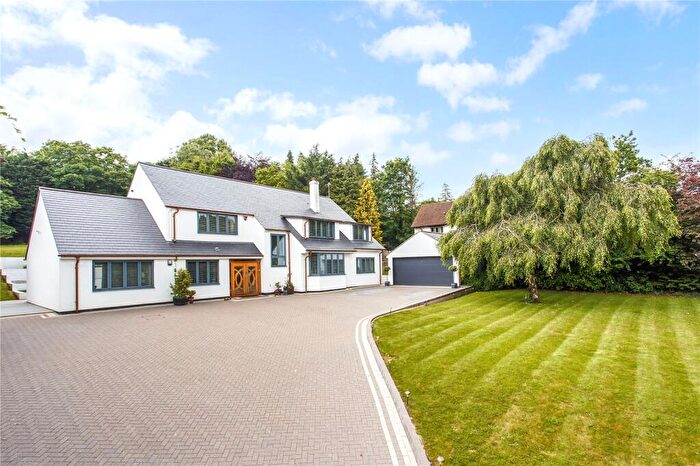
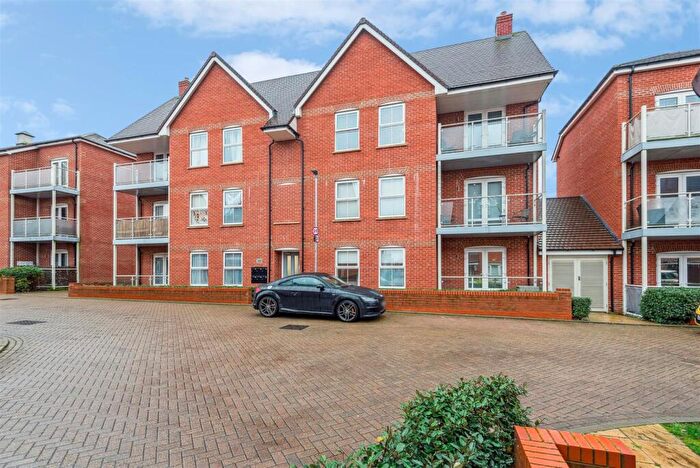
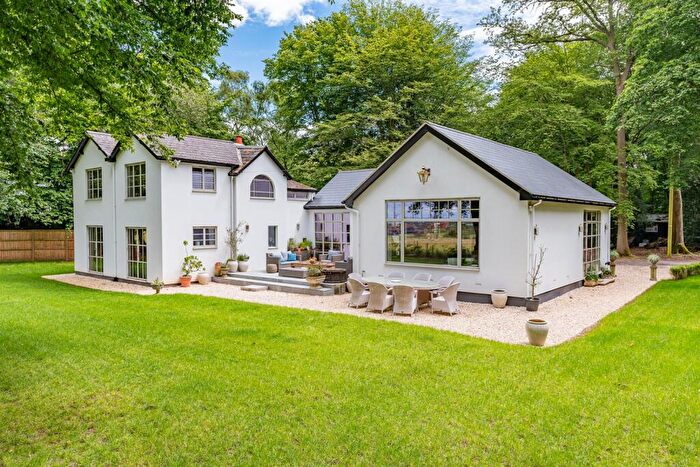
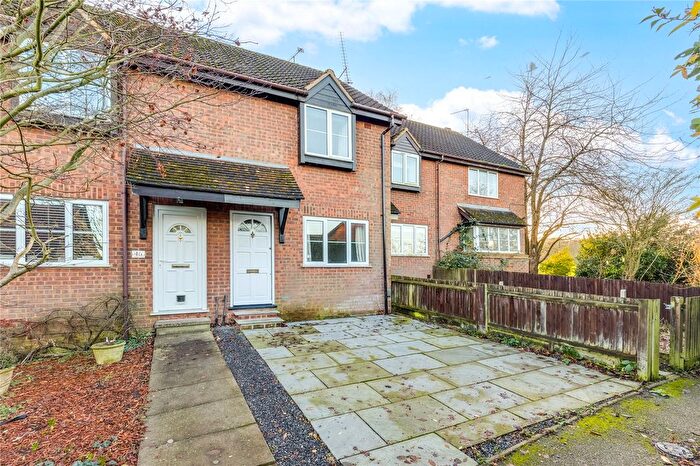
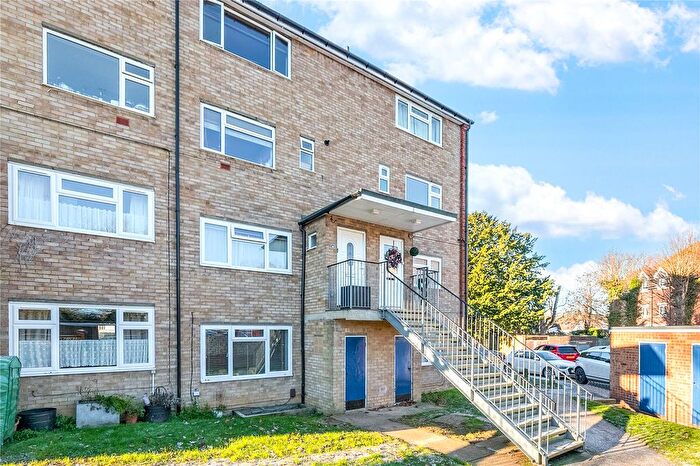
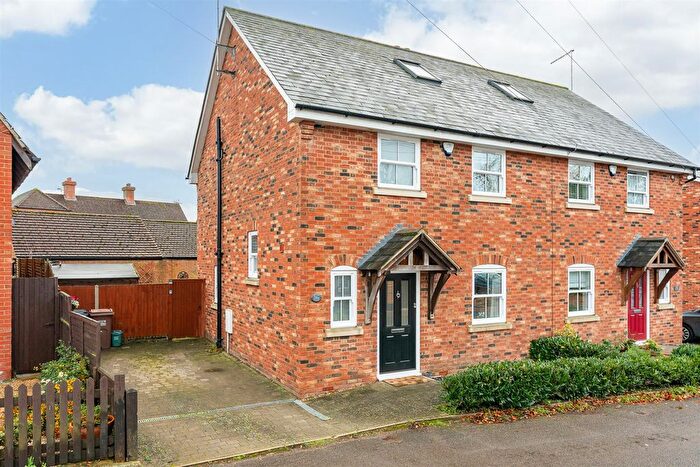
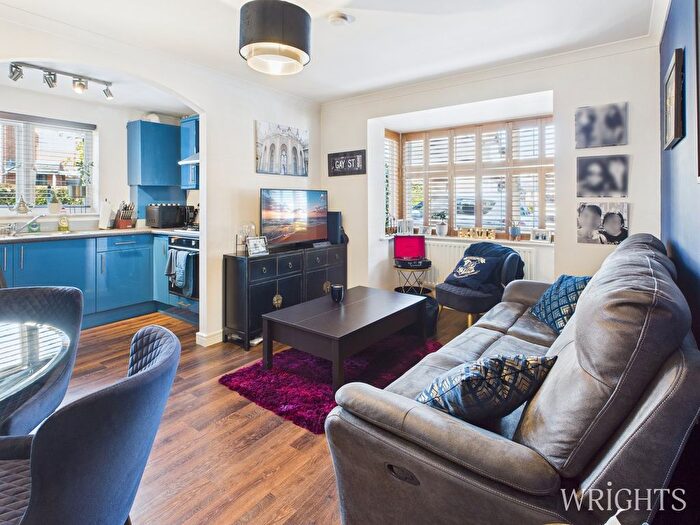
Properties in Welwyn East have an average house price of £395,398.00 and had 69 Property Transactions within the last 3 years¹.
Welwyn East is an area in Knebworth, Hertfordshire with 583 households², where the most expensive property was sold for £810,000.00.
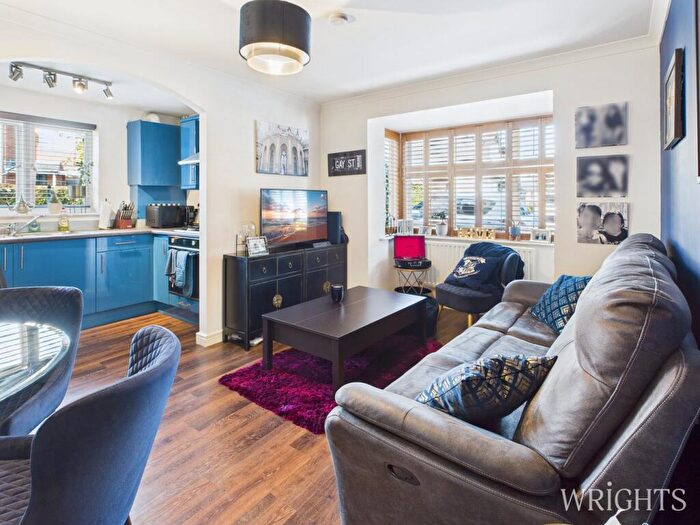
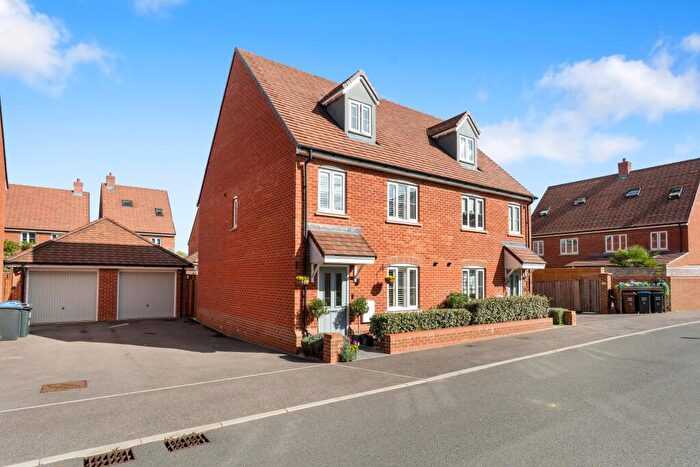
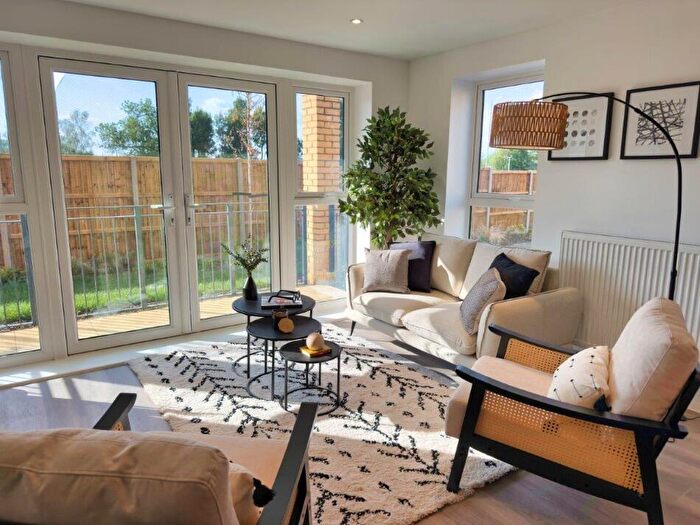
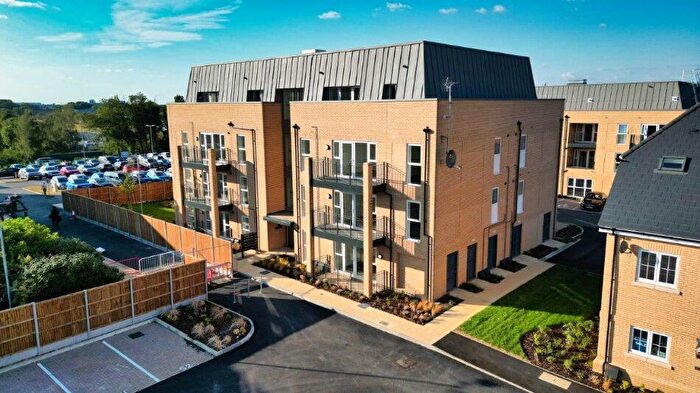
Properties for sale in Welwyn East
Roads and Postcodes in Welwyn East
Navigate through our locations to find the location of your next house in Welwyn East, Knebworth for sale or to rent.
| Streets | Postcodes |
|---|---|
| Barley Croft | SG3 6HY |
| Birch Road | SG3 6LW |
| Blythway | AL7 1ED AL7 1EF |
| Bridge Road | SG3 6JG SG3 6JL |
| Broadfield Road | SG3 6LZ |
| Carvers Croft | SG3 6LX |
| Creamery Close | SG3 6FB |
| Evergreen Close | SG3 6JN |
| Garden Close | SG3 6JF |
| Garden Road | SG3 6JZ |
| Gate House Close | SG3 6FE |
| Hall Lane | SG3 6FD SG3 6XA |
| Hay Wains | SG3 6HW |
| Holly Road | SG3 6LL |
| Kimptons Court | SG3 6JY |
| London Road | SG3 6JD SG3 6JE SG3 6JP SG3 6JS SG3 6LG SG3 6JU SG3 6FP |
| Longmead | SG3 6JH |
| Mardleybury Court | SG3 6LP |
| Mardleybury Road | SG3 6LT SG3 6LU SG3 6NB SG3 6SG |
| Mayshades Close | SG3 6LN |
| Milk Churn Way | SG3 6FF SG3 6FG SG3 6FH SG3 6FJ SG3 6FL SG3 6FN |
| New Court | SG3 6LJ |
| New Road | SG3 6JX SG3 6LB SG3 6LA SG3 6LE |
| Oak Road | SG3 6LS |
| Strawplaiters Close | SG3 6LD |
| Twin Foxes | SG3 6QT |
| White Cross Drive | SG3 6FA |
| Wickfield | SG3 6HS |
| Wickfield Close | SG3 6JJ |
| Wolves Croft | SG3 6LR |
| Wolves Mere | SG3 6JW |
Transport near Welwyn East
- FAQ
- Price Paid By Year
- Property Type Price
Frequently asked questions about Welwyn East
What is the average price for a property for sale in Welwyn East?
The average price for a property for sale in Welwyn East is £395,398. This amount is 20% lower than the average price in Knebworth. There are 617 property listings for sale in Welwyn East.
What streets have the most expensive properties for sale in Welwyn East?
The streets with the most expensive properties for sale in Welwyn East are New Road at an average of £640,333, Wolves Croft at an average of £625,000 and Oak Road at an average of £575,000.
What streets have the most affordable properties for sale in Welwyn East?
The streets with the most affordable properties for sale in Welwyn East are Kimptons Court at an average of £252,000, Carvers Croft at an average of £335,500 and Wolves Mere at an average of £344,000.
Which train stations are available in or near Welwyn East?
Some of the train stations available in or near Welwyn East are Knebworth, Welwyn North and Watton-At-Stone.
Property Price Paid in Welwyn East by Year
The average sold property price by year was:
| Year | Average Sold Price | Price Change |
Sold Properties
|
|---|---|---|---|
| 2025 | £433,937 | 15% |
16 Properties |
| 2024 | £367,277 | -17% |
18 Properties |
| 2023 | £431,363 | 13% |
11 Properties |
| 2022 | £374,312 | -4% |
24 Properties |
| 2021 | £387,825 | 3% |
31 Properties |
| 2020 | £377,475 | -6% |
20 Properties |
| 2019 | £399,360 | 12% |
25 Properties |
| 2018 | £350,018 | -4% |
26 Properties |
| 2017 | £365,760 | 1% |
25 Properties |
| 2016 | £362,064 | 31% |
38 Properties |
| 2015 | £251,602 | -11% |
24 Properties |
| 2014 | £278,804 | 7% |
31 Properties |
| 2013 | £258,000 | 6% |
22 Properties |
| 2012 | £242,527 | -3% |
18 Properties |
| 2011 | £248,666 | 3% |
18 Properties |
| 2010 | £241,125 | -4% |
24 Properties |
| 2009 | £249,653 | 8% |
16 Properties |
| 2008 | £229,420 | -38% |
19 Properties |
| 2007 | £316,029 | 31% |
52 Properties |
| 2006 | £216,556 | -8% |
46 Properties |
| 2005 | £233,017 | 1% |
34 Properties |
| 2004 | £229,610 | 14% |
41 Properties |
| 2003 | £197,549 | 12% |
53 Properties |
| 2002 | £173,780 | 5% |
47 Properties |
| 2001 | £165,439 | 26% |
53 Properties |
| 2000 | £122,878 | -11% |
38 Properties |
| 1999 | £136,147 | 24% |
59 Properties |
| 1998 | £103,768 | 22% |
50 Properties |
| 1997 | £81,422 | -21% |
77 Properties |
| 1996 | £98,184 | 26% |
37 Properties |
| 1995 | £72,466 | - |
15 Properties |
Property Price per Property Type in Welwyn East
Here you can find historic sold price data in order to help with your property search.
The average Property Paid Price for specific property types in the last three years are:
| Property Type | Average Sold Price | Sold Properties |
|---|---|---|
| Semi Detached House | £487,000.00 | 10 Semi Detached Houses |
| Detached House | £620,111.00 | 9 Detached Houses |
| Terraced House | £383,075.00 | 33 Terraced Houses |
| Flat | £246,470.00 | 17 Flats |

