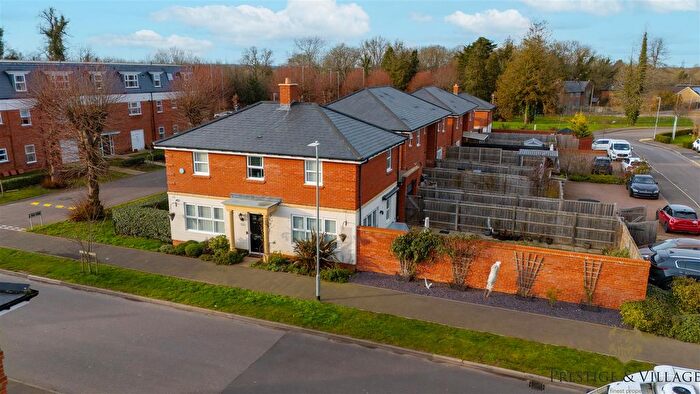
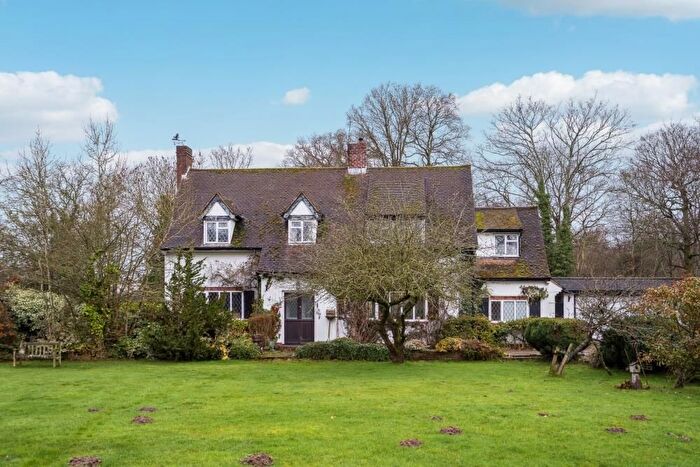
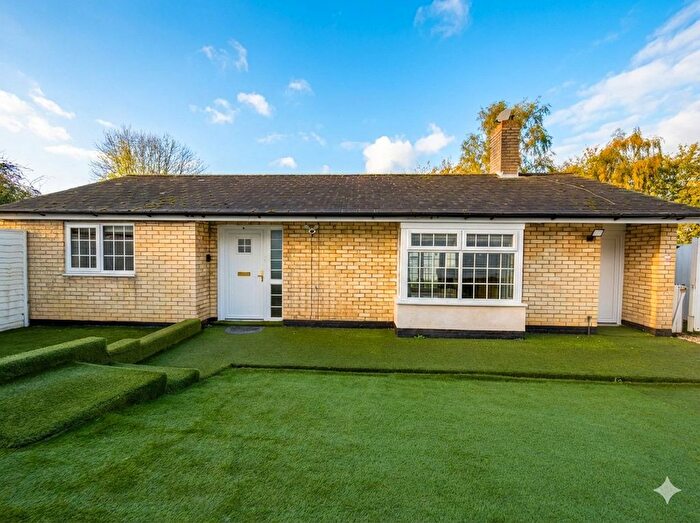
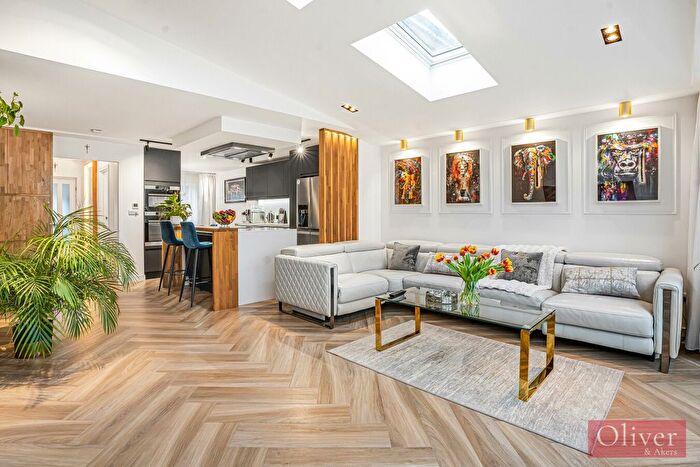
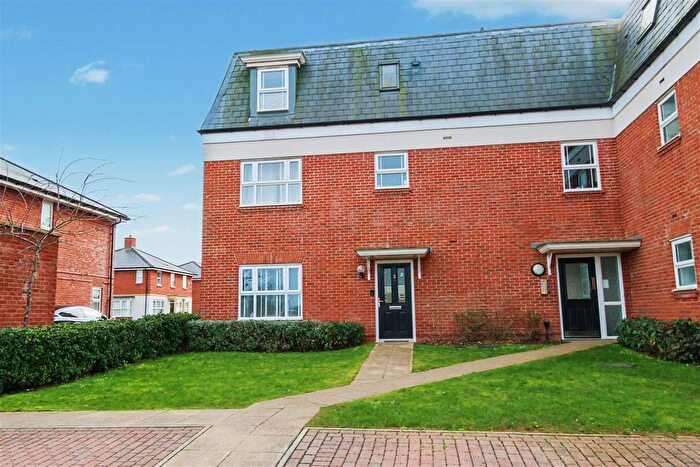
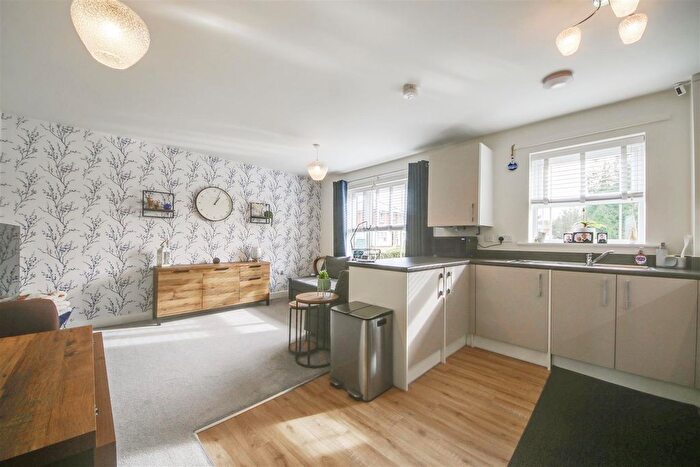
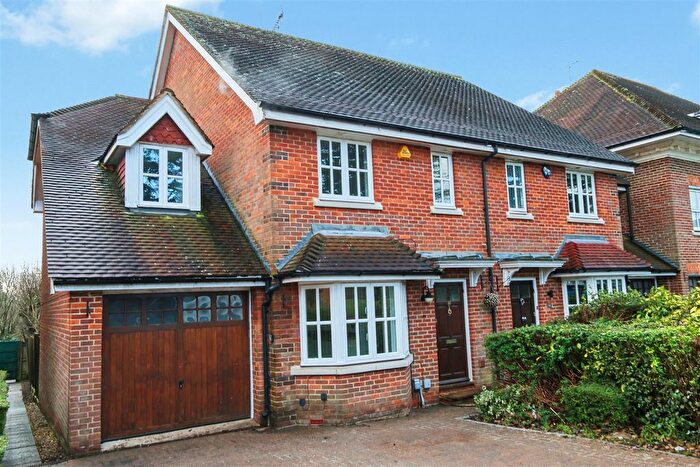
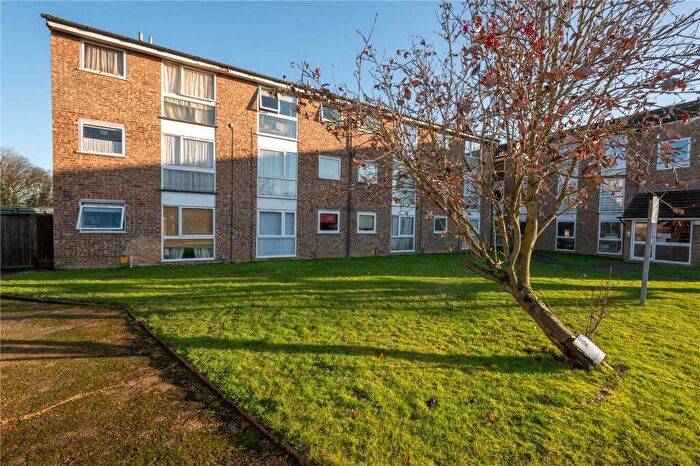
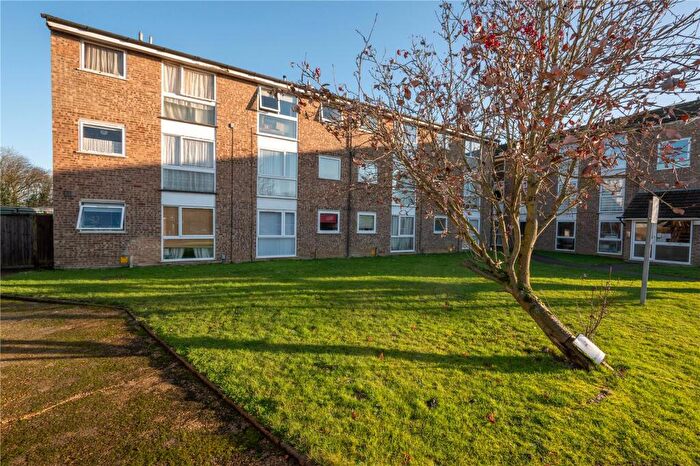
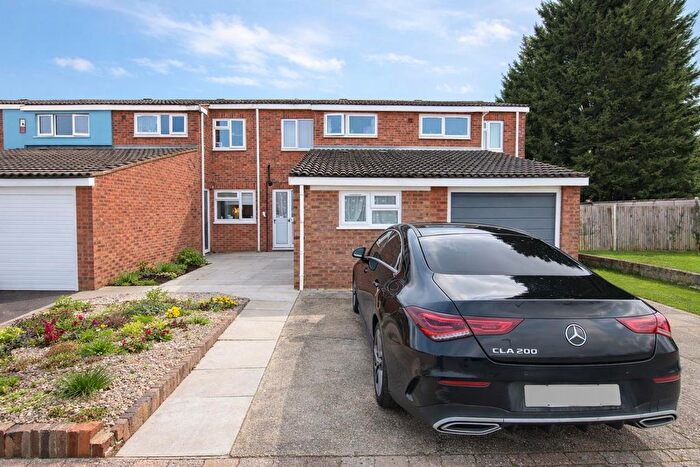
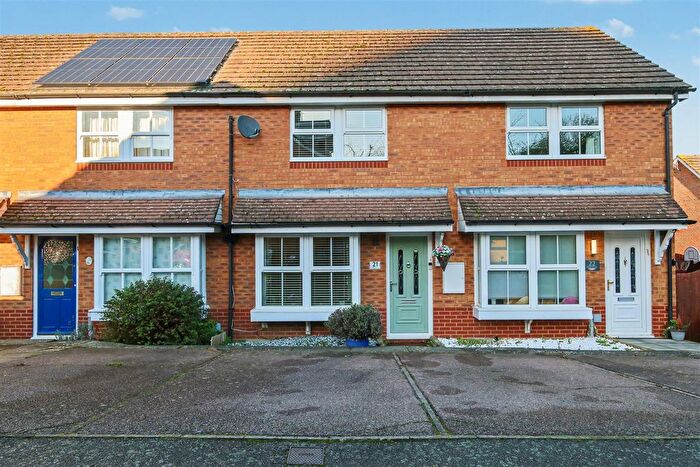
Houses for sale & to rent in Shenley, Radlett
House Prices in Shenley
Properties in Shenley have an average house price of £616,731.00 and had 121 Property Transactions within the last 3 years¹.
Shenley is an area in Radlett, Hertfordshire with 1,552 households², where the most expensive property was sold for £1,300,000.00.
Properties for sale in Shenley
Roads and Postcodes in Shenley
Navigate through our locations to find the location of your next house in Shenley, Radlett for sale or to rent.
| Streets | Postcodes |
|---|---|
| Allen Close | WD7 9JS |
| Anderson Road | WD7 9EQ |
| Andrew Close | WD7 9LN WD7 9LP |
| Armstrong Gardens | WD7 9JB |
| Black Lion Hill | WD7 9DE |
| Blenheim Mews | WD7 9LL WD7 9LR |
| Boswell Close | WD7 9DT |
| Broadley Gardens | WD7 9GA |
| Cagepond Road | WD7 9BZ |
| Charrington Close | WD7 9GZ |
| Charwood Close | WD7 9LH |
| Cockle Way | WD7 9JT |
| Court Lodge | WD7 9DU |
| Cox Close | WD7 9JQ |
| De Havilland Court | WD7 9JD |
| Edgbaston Drive | WD7 9HT |
| Emmett Close | WD7 9LG |
| Farm Close | WD7 9AD |
| Fielders Way | WD7 9EY |
| Frank Cottages | WD7 9AH |
| Grace Avenue | WD7 9DN WD7 9DP |
| Green Street | WD7 9BA WD7 9BD WD7 9BB |
| Greenwood Gardens | WD7 9LF |
| Halliday Close | WD7 9JZ |
| Hamblings Close | WD7 9JJ |
| Harris Lane | WD7 9EB WD7 9ED WD7 9EF WD7 9EG |
| Hawksmoor | WD7 9EE |
| Hazel Court | WD7 9LQ |
| Headingley Close | WD7 9HY |
| Hillcrest Road | WD7 9DB WD7 9DD |
| Howe Close | WD7 9JF |
| Hugo Gryn Way | WD7 9AB WD7 9BL |
| Juniper Gardens | WD7 9LA |
| King Charles Road | WD7 9HZ |
| King Edward Road | WD7 9BY |
| Laxton Gardens | WD7 9JY |
| London Road | WD7 9BN WD7 9BS WD7 9BT WD7 9BW WD7 9DX WD7 9DY WD7 9EN WD7 9EP WD7 9ER WD7 9EW WD7 9BP WD7 9ES |
| Lords Close | WD7 9JE |
| Madresfield Court | WD7 9JR |
| Mead Road | WD7 9DA |
| Mimms Lane | WD7 9AP |
| Monarch Walk | WD7 9BH |
| Mulberry Gardens | WD7 9LB |
| Myers Close | WD7 9JX |
| Nell Gwynn Close | WD7 9JA |
| New Road | WD7 9DZ WD7 9EA WD7 8LY |
| Newcome Path | WD7 9EL |
| Newcome Road | WD7 9EH WD7 9EJ WD7 9ET |
| North Avenue | WD7 9DF WD7 9DG |
| Old Nursery Close | WD7 9FD |
| Permain Close | WD7 9DR |
| Pippin Close | WD7 9EU |
| Porters Park Drive | WD7 9JU WD7 9DS WD7 9LU WD7 9NE |
| Poultney Close | WD7 9JH |
| Pound Lane | WD7 9BU |
| Queensway | WD7 9DQ |
| Radlett Lane | WD7 9AG WD7 9AJ WD7 9AE WD7 9DW WD7 9JP |
| Raphael Close | WD7 9JG |
| Rectory Lane | WD7 9AL WD7 9AW WD7 9BX WD7 9AN WD7 9BE |
| Ribston Close | WD7 9JW |
| Ridge Hill | WD7 9BG |
| Ridgehill Rise | WD7 9FP |
| Rowan Close | WD7 9LD |
| Russet Drive | WD7 9RH |
| Shenleybury | WD7 9DH WD7 9DL |
| Shenleybury Cottages | WD7 9DJ |
| Southerton Way | WD7 9LJ |
| The Lawns | WD7 9EZ |
| Trafford Close | WD7 9HU |
| Trent Close | WD7 9HX |
| Wayside | WD7 9JN |
| Whitebeam Close | WD7 9LE |
| Wickets End | WD7 9EX |
| Winifred Cottages | WD7 9AQ |
| Woodhall Lane | WD7 9AS WD7 9AT WD7 9AU WD7 9AZ WD7 9AA WD7 9AR WD7 9AX WD7 9AY |
Transport near Shenley
- FAQ
- Price Paid By Year
- Property Type Price
Frequently asked questions about Shenley
What is the average price for a property for sale in Shenley?
The average price for a property for sale in Shenley is £616,731. This amount is 46% lower than the average price in Radlett. There are 951 property listings for sale in Shenley.
What streets have the most expensive properties for sale in Shenley?
The streets with the most expensive properties for sale in Shenley are Radlett Lane at an average of £1,300,000, King Edward Road at an average of £1,035,000 and The Lawns at an average of £981,000.
What streets have the most affordable properties for sale in Shenley?
The streets with the most affordable properties for sale in Shenley are Hawksmoor at an average of £233,333, Poultney Close at an average of £402,750 and Laxton Gardens at an average of £420,000.
Which train stations are available in or near Shenley?
Some of the train stations available in or near Shenley are Radlett and Elstree and Borehamwood.
Property Price Paid in Shenley by Year
The average sold property price by year was:
| Year | Average Sold Price | Price Change |
Sold Properties
|
|---|---|---|---|
| 2025 | £599,236 | -4% |
36 Properties |
| 2024 | £625,250 | 0,4% |
42 Properties |
| 2023 | £623,058 | -11% |
43 Properties |
| 2022 | £692,994 | 11% |
57 Properties |
| 2021 | £618,151 | 3% |
82 Properties |
| 2020 | £600,134 | -31% |
54 Properties |
| 2019 | £785,672 | 28% |
37 Properties |
| 2018 | £568,145 | 5% |
51 Properties |
| 2017 | £539,546 | -3% |
42 Properties |
| 2016 | £554,310 | 7% |
56 Properties |
| 2015 | £514,395 | -10% |
75 Properties |
| 2014 | £565,022 | 23% |
72 Properties |
| 2013 | £436,664 | 8% |
74 Properties |
| 2012 | £400,891 | 2% |
79 Properties |
| 2011 | £391,184 | -5% |
57 Properties |
| 2010 | £411,085 | 20% |
68 Properties |
| 2009 | £329,803 | -15% |
47 Properties |
| 2008 | £379,151 | 4% |
36 Properties |
| 2007 | £362,207 | - |
97 Properties |
| 2006 | £362,264 | 18% |
138 Properties |
| 2005 | £298,496 | -4% |
81 Properties |
| 2004 | £310,658 | 10% |
86 Properties |
| 2003 | £278,918 | 4% |
91 Properties |
| 2002 | £267,005 | 14% |
123 Properties |
| 2001 | £230,637 | 11% |
119 Properties |
| 2000 | £204,658 | 15% |
88 Properties |
| 1999 | £174,470 | -2% |
197 Properties |
| 1998 | £178,260 | 20% |
233 Properties |
| 1997 | £142,987 | 2% |
142 Properties |
| 1996 | £139,762 | 1% |
60 Properties |
| 1995 | £138,327 | - |
93 Properties |
Property Price per Property Type in Shenley
Here you can find historic sold price data in order to help with your property search.
The average Property Paid Price for specific property types in the last three years are:
| Property Type | Average Sold Price | Sold Properties |
|---|---|---|
| Semi Detached House | £589,441.00 | 34 Semi Detached Houses |
| Detached House | £806,285.00 | 35 Detached Houses |
| Terraced House | £536,233.00 | 45 Terraced Houses |
| Flat | £319,000.00 | 7 Flats |

